( Jasmin ) Top VIP Escorts Service Dindigul 💧 7737669865 💧 by Dindigul Call G...
erie insurance group 2007-first-quarter-report
1. ERIE INDEMNITY COMPANY
2007 FIRST QUARTER
SHAREHOLDERS’ REPORT
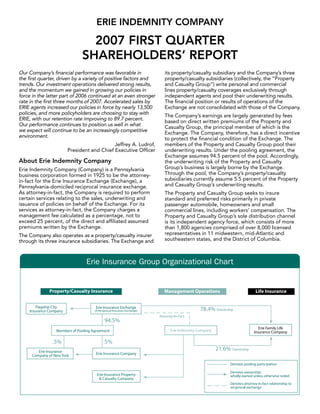
Our Company’s financial performance was favorable in its property/casualty subsidiary and the Company’s three
the first quarter, driven by a variety of positive factors and property/casualty subsidiaries (collectively, the “Property
trends. Our investment operations delivered strong results, and Casualty Group”) write personal and commercial
and the momentum we gained in growing our policies in lines property/casualty coverages exclusively through
force in the latter part of 2006 continued at an even stronger independent agents and pool their underwriting results.
rate in the first three months of 2007. Accelerated sales by The financial position or results of operations of the
ERIE agents increased our policies in force by nearly 13,500 Exchange are not consolidated with those of the Company.
policies, and more policyholders are choosing to stay with The Company’s earnings are largely generated by fees
ERIE, with our retention rate improving to 89.7 percent. based on direct written premiums of the Property and
Our performance continues to position us well in what Casualty Group, the principal member of which is the
we expect will continue to be an increasingly competitive Exchange. The Company, therefore, has a direct incentive
environment. to protect the financial condition of the Exchange. The
Jeffrey A. Ludrof, members of the Property and Casualty Group pool their
President and Chief Executive Officer underwriting results. Under the pooling agreement, the
Exchange assumes 94.5 percent of the pool. Accordingly,
About Erie Indemnity Company the underwriting risk of the Property and Casualty
Group’s business is largely borne by the Exchange.
Erie Indemnity Company (Company) is a Pennsylvania
Through the pool, the Company’s property/casualty
business corporation formed in 1925 to be the attorney-
subsidiaries currently assume 5.5 percent of the Property
in-fact for the Erie Insurance Exchange (Exchange), a
and Casualty Group’s underwriting results.
Pennsylvania-domiciled reciprocal insurance exchange.
As attorney-in-fact, the Company is required to perform The Property and Casualty Group seeks to insure
certain services relating to the sales, underwriting and standard and preferred risks primarily in private
issuance of policies on behalf of the Exchange. For its passenger automobile, homeowners and small
services as attorney-in-fact, the Company charges a commercial lines, including workers’ compensation. The
management fee calculated as a percentage, not to Property and Casualty Group’s sole distribution channel
exceed 25 percent, of the direct and affiliated assumed is its independent agency force, which consists of more
premiums written by the Exchange. than 1,800 agencies comprised of over 8,000 licensed
representatives in 11 midwestern, mid-Atlantic and
The Company also operates as a property/casualty insurer
southeastern states, and the District of Columbia.
through its three insurance subsidiaries. The Exchange and
Erie Insurance Group Organizational Chart
2. Corporate Information
Financial information Stock transfer agent
The Erie Indemnity Company submits a quarterly report American Stock Transfer & Trust Company
to the Securities and Exchange Commission on Form 59 Maiden Lane
10-Q. Shareholders may obtain a copy of the Form 10-Q Plaza Level
report without charge by writing to: Chief Financial New York, NY 10038
Officer, Erie Indemnity Company, 100 Erie Insurance (800) 937-5449
Place, Erie, PA, 16530 or by visiting the Company’s Web
Corporate headquarters
site at www.erieinsurance.com.
100 Erie Insurance Place
Common stock information Erie, PA 16530
The Erie Indemnity Company’s Class A, non-voting (814) 870-2000
common stock is traded on the NASDAQ Stock Market
Internet address
under the symbol “ERIE.” Quotations are available via
major financial news sources. Financial statement filings, shareholder information, press
releases and general news about the Company may also
be accessed at: www.erieinsurance.com.
Erie Indemnity Company First Quarter 2007 Results
Key points for the first quarter 2007: premiums of the Property and Casualty Group, upon
which management fee revenue is calculated, decreased
• Net income was $56.4 million for the first quarter of 2.6 percent to $918.2 million in the first quarter 2007,
2007, a 13.9 percent increase from $49.5 million for from $942.8 million in the first quarter of 2006. The
the same period in 2006. Net income per share-diluted decline in direct written premiums of the Property and
increased to $0.88 per share, compared to $0.73 per Casualty Group reflects the impact of rate reductions
share in the comparable quarter in 2006. and changes in risk characteristics of policyholders and
coverages provided. The increase to the management fee
• Net operating income per share (excluding net realized
rate in 2007 to 25 percent, from 24.75 percent in 2006,
gains or losses on investments and related taxes)
offset some of the decline in direct written premiums.
increased by 18.9 percent to $0.86 per share in the first
This higher management fee rate in 2007 increased
quarter of 2007, from $0.72 per share, for the same
management fee revenue by $2.3 million, or $0.02 per
period one year ago.
share-diluted, for the quarter ended March 31, 2007.
• Management fee revenue decreased 1.8 percent to
Other factors impacting direct written premiums of the
$228.6 million, from $232.9 million for the same period
Property and Casualty Group during the first quarter of
one year ago. A decline in the cost of management
2007 include:
operations allowed margins to remain steady with 2006
at 19.4 percent in the first quarter of 2007. • Year-over-year policies in force grew 1.3 percent,
or 50,223 policies, to 3,811,723 at March 31, 2007,
• The GAAP combined ratio was 89.2 in the first quarter
compared to year-over-year growth of 2,988 policies in
of 2007 compared to 86.5 in the first quarter of 2006.
the first quarter of 2006.
• The policy retention ratio increased to 89.7 percent
• The year-over-year policy retention rate for the
at March 31, 2007, compared to 89.5 percent at
Property and Casualty Group improved again to 89.7
December 31, 2006, and 88.8 percent at March 31,
percent at March 31, 2007, compared to 88.8 percent
2006.
at March 31, 2006.
• Net revenue from investment operations increased to
• New policies in force increased 3.7 percent from
$29.8 million from $20.6 million for the first quarters
March 31, 2006, levels and renewal policies in force
of 2007 and 2006, respectively, primarily driven by
increased 1.0 percent.
earnings on our limited partnership investments.
• The year-over-year average premium per policy on new
• The 2007 annualized effective tax rate of 32.7 percent
business in the first quarter of 2007 of $843 was 3.3
was offset by positive estimates of IRS examination
percent less than the $872 in the first quarter of 2006.
settlements and adjustments to deferred taxes during
the quarter offset somewhat by interest expense on • The year-over-year average premium per policy on
uncertain tax positions. renewal business declined 5.2 percent to $1,011 in the
first quarter of 2007.
Management operations
Management fee revenue decreased 1.8 percent for
the quarter ended March 31, 2007. Direct written
2
3. The Property and Casualty Group has been implementing • Development of prior accident year loss reserves
rate reductions to be more price competitive, which continued to be favorable in the first quarter of 2007,
resulted in a $34 million decrease in written premiums in improving the loss ratio 10.3 points, or $5.4 million,
the first quarter of 2007. An additional $45 million in rate compared to an improvement of 7.9 points for the first
reductions are forecast for the remainder of the year. The quarter of 2006.
most significant rate reductions have been in the Group’s - The majority of this positive development resulted
largest line of business, private passenger auto. from favorable re-estimates of reserves on prior
In addition to rate reductions, the Company continues accident quarters for automobile bodily injury and
to expand its agency force to support its growth uninsured/underinsured motorist bodily injury.
goals. Through the first quarter of 2007, the Company Improvements in accident quarter loss ratios in
appointed 66 new agencies. Consolidations and these lines were a result of improved frequency and
terminations within ERIE’s agency force resulted in a net severity trends.
increase of 38 producing agencies during the first quarter, - Offsetting this favorable development was a
bringing our total of producing agencies to 1,832 at strengthening of reserves for certain workers
March 31, 2007. The Company expects to meet its goal of compensation claims of which our share was $0.4
200 new agency appointments during 2007. In 2006, the million, or 0.8 GAAP combined ratio points.
Company appointed 139 new agencies.
• The Company recognized certain adjusting and other
The cost of management operations decreased 1.8 percent liabilities of $1.4 million, or 2.4 combined ratio points,
to $190.4 million in the first quarter of 2007, from $193.8 for estimated employee salaries and benefits of the
million for the same period in 2006. Commission costs, Exchange that were not fully considered in the reserve.
the largest component of the cost of management
In 2006, the favorable development of the first quarter
operations, decreased 2.4 percent to $130.8 million
resulted primarily from the personal auto, homeowners
from $134.1 million in the first quarter 2006. Normal
and workers’ compensation lines of business. Severity
commissions decreased 2.0 percent, and our estimate
trends improved in the first quarter of 2006 compared to
for agent bonus awards decreased 4.9 percent, primarily
those anticipated based on historical patterns.
due to a reduction in the profitability component of the
award. There were $1.5 million in additional commission The Company’s share of catastrophe losses amounted to
costs in the first quarter of 2007 from the new $50 per $0.3 million in each of the first quarters of 2007 and 2006.
policy private passenger auto bonus. These catastrophe losses contributed 0.5 points and 0.6
points to the GAAP combined ratio in the first quarters
First quarter costs of management operations, excluding
of 2007 and 2006, respectively. Underwriting losses
commissions, decreased 0.3 percent to $59.5 million in
are seasonally higher in the second and fourth quarters
2007 from $59.7 million in 2006. Personnel costs, the
and, as a consequence, the Company’s combined
second largest component of the cost of management
ratio generally increases as the year progresses. In
operations, totaled $33.9 million for the first quarter
the first quarter of 2007, our share of the reduction to
2007 versus $35.6 million in the same period in 2006, a
incurred but not reported reserves related to seasonality
decrease of 4.8 percent. The Company’s normal salary
adjustments was $3.3 million, compared to $2.3 million in
expense increased $1.2 million driven by 6 percent
the first quarter of 2006.
higher average pay rates offset by slightly lower
personnel count. Normal salary expenses were offset
Investment operations
by a $2.4 million decrease in expense for management
incentive plans, due to a reduction in the estimates for Net revenue from investment operations increased
the management incentive plan payouts, which was 44.6 percent in the first quarter of 2007 to $29.8 million
attributable to lower than targeted Property and Casualty compared to $20.6 million in the first quarter of 2006.
Group premium production. The Company’s employee
Equity in earnings of limited partnerships contributed
benefit expenses decreased $0.7 million. Health and
significantly to the improved investment performance,
vision benefit expenses increased $0.1 million in the
increasing to $12.5 million in the first quarter of 2007
first quarter of 2007. Pension and retiree health benefit
from $4.1 million in the first quarter of 2006. Optimal
expenses decreased $0.9 million due to a higher discount
market conditions resulted in a higher return on capital
rate assumption for the pension plans and the curtailment
on mezzanine debt and private equity partnership
of the retiree health plan in 2006. All other operating
investments by some of our more seasoned limited
costs increased 16.2 percent driven by increased
partnerships and appreciation of commercial properties
professional fees.
owned by our real estate limited partnerships.
Insurance underwriting operations Net investment income, which includes primarily interest
and dividends on the Company’s fixed maturity and
The Company’s insurance underwriting operations
equity security portfolios, decreased by 6.8 percent to
generated gains of $5.6 million and $7.3 million in the
$14.0 million for the quarter ended March 31, 2007, from
first quarters of 2007 and 2006, respectively. The GAAP
$15.0 million for the same period in 2006 as a result of
combined ratio for the Company was 89.2 percent in the
lower invested asset balances due to share repurchase
first quarter 2007 compared to 86.5 percent for the same
activity.
period in 2006.
Net realized gains on investments were $1.9 million in
• Earned premiums of the Property and Casualty Group
the first quarter of 2007 compared to $0.8 million in
declined $41 million reflecting the trend of rate
2006. Net realized gains on investments generally pertain
decreases.
3
4. to gains and losses on bonds, preferred stocks and “Safe Harbor” Statement Under the Private Securities
Litigation Reform Act of 1995: Certain forward-looking
common stocks. Impairment charges of $0.7 million and
statements contained herein involve risks and uncertainties.
$2.0 million were recorded on fixed maturity and equity
These statements include certain discussions relating to
securities during the first quarters of 2007 and 2006,
management fee revenue, cost of management operations,
respectively.
underwriting, premium and investment income volume,
The Company’s provision for income taxes was positively business strategies, profitability and business relationships
and the Company’s other business activities during 2007
affected by adjustments of $2.5 million from IRS audits
and beyond. In some cases, you can identify forward-looking
and adjustments to deferred taxes. These adjustments
statements by terms such as “may,” “will,” “should,” “could,”
were offset by $0.8 million of interest on uncertain tax
“would,” “expect,” “plan,” “intend,” “anticipate,” “believe,”
positions from adoption of FIN 48 during the quarter.
“contemplate,” “estimate,” “project,” “predict,” “potential”
As a consequence, the effective income tax rate for and similar expressions. These forward-looking statements
the quarter was 30.5 percent, down from the more reflect the Company’s current views about future events, are
normalized 33 percent. based on assumptions and are subject to known and unknown
risks and uncertainties that may cause results to differ materially
Liquidity and capital resources from those anticipated in those statements. Many of the factors
that will determine future events or achievements are beyond
As part of our capital management plan, the Company
our ability to control or predict.
repurchased 282,539 shares of our Class A common stock
at a cost of $15.1 million during the first quarter of 2007,
or $53.34 per share.
4
5. CONSOLIDATED STATEMENTS OF OPERATIONS
(Dollars in thousands, except in per share data)
Three months ended
March 31
2007 2006
(unaudited)
Operating revenue
Management fee revenue—net $ 216,020 $ 220,102
Premiums earned 51,974 54,026
Service agreement revenue 7,418 7,592
Total operating revenue 275,412 281,720
Operating expenses
Cost of management operations 179,886 183,154
Losses and loss adjustment expenses incurred 32,234 30,053
Policy acquisition and other underwriting expenses 11,995 14,501
Total operating expenses 224,115 227,708
Investment income—unaffiliated
Investment income, net of expenses 13,978 15,000
Net realized gains on investments 1,890 784
Equity in earnings of limited partnerships 12,518 4,142
Total investment income—unaffiliated 28,386 19,926
Income before income taxes and equity in earnings of
Erie Family Life Insurance Company 79,683 73,938
Provision for income taxes 24,592 25,077
Equity in earnings of Erie Family Life Insurance
Company, net of tax 1,270 605
Net income $ 56,361 $ 49,466
Net income per share:
Class A common stock—basic $ 0.97 $ 0.81
Class A common stock—diluted 0.88 0.73
Class B common stock—basic and diluted 149.01 121.08
Weighted average shares outstanding:
Class A common stock—basic 57,691,289 60,630,395
Class A common stock—diluted 63,906,458 67,505,125
Class B common stock—basic and diluted 2,573 2,833
Dividends declared per share:
Class A common stock $ 0.40 $ 0.36
Class B common stock 60.00 54.00
5
6. CONSOLIDATED STATEMENTS OF OPERATIONS—SEGMENT BASIS
(Amounts in thousands, except in per share data)
Three months ended
March 31
2007 2006
(unaudited)
Management operations
Management fee revenue $ 228,645 $ 232,935
Service agreement revenue 7,418 7,592
Total revenue from management operations 236,063 240,527
Cost of management operations 190,385 193,825
Income from management operations 45,678 46,702
Insurance underwriting operations
Premiums earned 51,974 54,026
Losses and loss adjustment expenses incurred 32,234 30,053
Policy acquisition and other underwriting expenses 14,121 16,663
Total losses and expenses 46,355 46,716
Underwriting gain 5,619 7,310
Investment operations
Investment income, net of expenses 13,978 15,000
Net realized gains on investments 1,890 784
Equity in earnings of limited partnerships 12,518 4,142
Equity in earnings of Erie Family Life Insurance Company 1,366 651
Net revenue from investment operations 29,752 20,577
Income before income taxes 81,049 74,589
Provision for income taxes 24,688 25,123
Net income $ 56,361 $ 49,466
Net income per share—Class A basic $ 0.97 $ 0.81
Net income per share—Class A diluted 0.88 0.73
Net income per share—Class B basic and diluted 149.01 121.08
Weighted average shares outstanding—Class A diluted 63,906 67,505
Amounts presented on a segment basis are gross of intercompany/intersegment items
6
7. RECONCILIATION OF OPERATING INCOME TO NET INCOME
We use operating income to evaluate the results of
Definition of non-GAAP and
operations. It reveals trends in our management services,
operating measures
insurance underwriting and investment operations that
We believe that investors’ understanding of our perfor- may be obscured by the net effects of realized capital
mance is enhanced by the disclosure of the following non- gains and losses. Realized capital gains and losses may
GAAP financial measure. Our method of calculating this vary significantly between periods and are generally
measure may differ from those used by other companies driven by business decisions and economic developments
and therefore comparability may be limited. such as capital market condition, the timing of which is
unrelated to our management services and insurance
Operating income is net income excluding realized
underwriting processes. We believe it is useful for
capital gains and losses and related federal income
investors to evaluate these components separately and in
taxes. Equity in earnings or losses of Erie Family Life
the aggregate when reviewing our performance. We are
Insurance Company and equity in earnings or losses of
aware that the price to earnings multiple commonly used
limited partnerships are not excluded from the calculation
by investors as a forward-looking valuation technique uses
of operating income. Both of these categories include
operating income as the denominator. Operating income
the respective investment’s realized capital gains and
should not be considered as a substitute for net income
losses, as well as unrealized gains and losses, as these
and does not reflect our overall profitability.
investments are accounted for under the equity method.
The following table reconciles operating income and net
Net income is the GAAP measure that is most directly
income for the periods ended March 31, 2007 and 2006:
comparable to operating income.
Three months ended
March 31
(unaudited)
(in thousands, except per share data)
2007 2006
Operating income $ 55,133 $ 48,956
Net realized gains on investments 1,890 784
Income tax expense on realized gains ( 662) ( 274)
Realized gains, net of income taxes 1,228 510
Net income $ 56,361 $ 49,466
Three months ended
March 31
(unaudited)
Per Class A Share—Diluted 2007 2006
Operating income $ 0.86 $ 0.72
Net realized gains on investments 0.03 0.01
Income tax expense on realized gains ( 0.01) 0.00
Realized gains, net of income tax expense 0.02 0.01
Net income $ 0.88 $ 0.73
7