1. ERIE INDEMNITY COMPANY
2007 SECOND QUARTER
SHAREHOLDERS’ REPORT
“Due to personal reasons, I have decided to leave Erie services as attorney-in-fact, the Company charges a
Indemnity,” said Mr. Ludrof. “I have enjoyed a long and management fee calculated as a percentage, not to
successful career at this company, but after considering exceed 25 percent, of the direct and affiliated assumed
the recent passing of Bill Hirt, as well as the excellent premiums written by the Exchange.
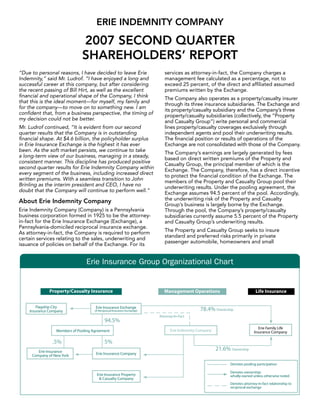
financial and operational shape of the Company, I think The Company also operates as a property/casualty insurer
that this is the ideal moment—for myself, my family and through its three insurance subsidiaries. The Exchange and
for the company—to move on to something new. I am its property/casualty subsidiary and the Company’s three
confident that, from a business perspective, the timing of property/casualty subsidiaries (collectively, the “Property
my decision could not be better. and Casualty Group”) write personal and commercial
Mr. Ludrof continued, “It is evident from our second lines property/casualty coverages exclusively through
quarter results that the Company is in outstanding independent agents and pool their underwriting results.
financial shape. At $4.6 billion, the policyholder surplus The financial position or results of operations of the
in Erie Insurance Exchange is the highest it has ever Exchange are not consolidated with those of the Company.
been. As the soft market persists, we continue to take The Company’s earnings are largely generated by fees
a long-term view of our business, managing in a steady, based on direct written premiums of the Property and
consistent manner. This discipline has produced positive Casualty Group, the principal member of which is the
second quarter results for Erie Indemnity Company within Exchange. The Company, therefore, has a direct incentive
every segment of the business, including increased direct to protect the financial condition of the Exchange. The
written premiums. With a seamless transition to John members of the Property and Casualty Group pool their
Brinling as the interim president and CEO, I have no underwriting results. Under the pooling agreement, the
doubt that the Company will continue to perform well.” Exchange assumes 94.5 percent of the pool. Accordingly,
the underwriting risk of the Property and Casualty
About Erie Indemnity Company Group’s business is largely borne by the Exchange.
Erie Indemnity Company (Company) is a Pennsylvania Through the pool, the Company’s property/casualty
business corporation formed in 1925 to be the attorney- subsidiaries currently assume 5.5 percent of the Property
in-fact for the Erie Insurance Exchange (Exchange), a and Casualty Group’s underwriting results.
Pennsylvania-domiciled reciprocal insurance exchange.
The Property and Casualty Group seeks to insure
As attorney-in-fact, the Company is required to perform
standard and preferred risks primarily in private
certain services relating to the sales, underwriting and
passenger automobile, homeowners and small
issuance of policies on behalf of the Exchange. For its
Erie Insurance Group Organizational Chart
2. Corporate Information
Stock transfer agent
commercial lines, including workers’ compensation. The
Property and Casualty Group’s sole distribution channel
American Stock Transfer & Trust Company
is its independent agency force, which consists of more
59 Maiden Lane
than 1,900 agencies comprised of over 8,100 licensed
Plaza Level
representatives in 11 midwestern, mid-Atlantic and
New York, NY 10038
southeastern states, and the District of Columbia.
(800) 937-5449
Financial information
Corporate headquarters
The Erie Indemnity Company submits a quarterly report
100 Erie Insurance Place
to the Securities and Exchange Commission on Form
Erie, PA 16530
10-Q. Shareholders may obtain a copy of the Form 10-Q
(814) 870-2000
report without charge by writing to: Chief Financial
Officer, Erie Indemnity Company, 100 Erie Insurance
Internet address
Place, Erie, PA, 16530 or by visiting the Company’s Web
Financial statement filings, shareholder information, press
site at www.erieinsurance.com.
releases and general news about the Company may also
Common stock information be accessed at: www.erieinsurance.com.
The Erie Indemnity Company’s Class A, non-voting
common stock is traded on the NASDAQ Stock Market
under the symbol “ERIE.” Quotations are available via
major financial news sources.
Erie Indemnity Company Second Quarter 2007 Results
Key points for the second quarter 2007: operations decreased to 21.4% in the second quarter
of 2007 from 22.0% in the second quarter of 2006.
• Net income was $70.5 million for the second quarter
• Direct written premiums increased in the second
of 2007, a 25.3 percent increase from $56.3 million for
quarter of 2007.
the same period in 2006. Net income per share-diluted
increased to $1.11 per share, compared to $0.86 per • Substantial improvement in the second quarter 2007
share in the comparable quarter in 2006. from insurance underwriting operations.
• Net operating income per share (excluding net realized • Net revenue from investment operations increased to
gains or losses on investments and related taxes) $37.8 million, or 28.3 percent, from $29.5 million for
increased by 25.6 percent to $1.09 per share in the the second quarters of 2007 and 2006, respectively.
second quarter of 2007, from $0.87 per share for the
• The 2007 annualized effective tax rate of 32.7 percent
same period one year ago.
was benefited by the settlement of IRS examinations
• Management fee revenue increased 2.1 percent on the years 2001 and 2002 totaling $1.0 million and
to $256.5 million, from $251.1 million for the same a reduction to the interest expense on uncertain tax
period one year ago. Gross margins from management positions of $0.5 million.
2
3. Key Drivers of Second Quarter 2007 Results
(Unaudited) (Unaudited)
Three months ended June 30, Six months ended June 30,
(dollars in thousands) 2007 2006 Change 2007 2006 Change
Management Operations:
Management fee revenues $ 256,462 $ 251,104 2.1% $ 485,106 $ 484,039 0.2%
P&C Group* direct written premium (DWP) $ 1,028,247 $ 1,019,005 0.9% $ 1,946,425 $ 1,961,773 (0.8)%
Drivers of P&C Group* DWP
Policies in force—year-over-year 3,848,180 3,781,558 66,622
Policy retention—year-over-year 89.9% 89.0% 0.9 pts
Avg. premium per policy—year-over-year $ 984 $ 1,026 $ (42)
Insurance Underwriting Operations:
GAAP combined ratio 84.8 99.4 (14.6) pts 87.0 92.9 (5.9) pts
Prior accident year reserve development—
(redundancy) deficiency** (4.3) 0.3 (4.6) pts (7.4) (3.9) (3.5) pts
Catastrophe loss ratio 2.2 9.2 (7.0) pts 1.3 4.9 (3.6) pts
Investment Operations:
Equity in earnings of limited partnerships $ 20,180 $ 14,058 43.5% $ 32,698 $ 18,200 79.7%
* P&C Group—Property and Casualty Group
** Excludes salvage and subrogation recoveries
Management operations and promotional incentives increased $2.2 million in the
second quarter of 2007.
Management fee revenue increased 2.1 percent for the
Second quarter costs of management operations,
quarter ended June 30, 2007, benefiting from 0.9%
excluding commissions, increased 4.5 percent to $58.5
growth in the direct written premiums of the Property and
million in 2007 from $56.0 million in 2006. Personnel costs
Casualty Group and the management fee rate being set
increased by 4.6 percent in the second quarter of 2007,
at its maximum level of 25% for 2007, up from 24.75% in
due to (1) an increase in salary expense from increases in
2006. This higher management fee rate in 2007 increased
the average pay rates offset by lower staffing levels and
management fee revenue by $4.9 million, or $0.05 per
(2) an increase of less than 1% in employee benefits costs,
share-diluted, for the six months ended June 30, 2007.
as the second quarter of 2007 was favorably impacted
Growth in policies in force is the result of the Company’s by a reduction in pension costs due to an increase in the
expansion of its independent agency force through discount rate, while the second quarter of 2006 included
appointments and other marketing initiatives as well as the recognition of a one-time full curtailment benefit
improved policyholder retention. Through the first half related to the termination of the retiree health benefit
of 2007, the Company appointed 129 new agencies, plan.
bringing our total agencies to 1,891 at June 30, 2007.
The Company expects to meet its goal of 200 new Insurance underwriting operations
agency appointments during 2007. In 2006, the Company
The Company’s insurance underwriting operations
appointed 139 new agencies.
generated gains of $7.9 million and $0.3 million in the
Due to continued soft market conditions, the Property second quarters of 2007 and 2006, respectively. The
and Casualty Group has been implementing rate GAAP combined ratio of the Company was 84.8 in the
reductions to be more price competitive, which resulted second quarter of 2007 compared to 99.4 in the second
in a $56 million decrease in written premiums in the first quarter of 2006, and Property and Casualty Group’s
half of 2007. An additional $31 million in rate reductions adjusted statutory combined ratio was 77.7 and 92.3 in
are forecast for the remainder of the year. The most the second quarter of 2007 and 2006, respectively.
significant rate reductions have been in the Group’s
• Earned premiums declined $1.7 million for the second
largest line of business, private passenger auto.
quarter of 2007 reflecting the trend of rate decreases.
The cost of management operations increased 3.2
• Development of prior accident year loss reserves,
percent to $207.4 million in the second quarter of
excluding salvage and subrogation recoveries,
2007, from $201.0 million for the same period in 2006.
continued to be favorable in the second quarter 2007.
Commission costs, the largest component of the cost
of management operations, increased 2.7 percent to • The second quarter of 2007 included tornados and
$148.9 million from $145.0 million in the second quarter flooding in Ohio, North Carolina and Virginia, while
2006. Normal commissions increased 0.9 percent, or 2006 included hail storms in Indiana. Catastrophe
$1.1 million, in line with the Property and Casualty losses incurred for the first half of 2007 and 2006 were
growth in premium, while estimates for agent bonuses $1.4 million and $5.3 million, respectively.
3
4. Liquidity and capital resources
The majority of this positive development in the second
quarter of 2007 resulted from favorable developments
As part of our capital management strategy, the Company
of reserves on prior accident quarters for automobile
repurchased 313,110 shares of our Class A common
bodily injury and uninsured/underinsured motorist bodily
stock at a cost of $16.7 million during the second quarter
injury. Improvements in accident quarter loss ratios in
of 2007, or $53.26 per share. In the first half of 2007,
these lines were a result of improved frequency and
595,649 shares were repurchased at a cost of $31.7
severity trends. In the second quarter of 2006, there was
million. The Company had approximately $98 million in
a strengthening of pre-1986 automobile catastrophic
outstanding repurchase authority under this program at
liability injury reserves based on a claim by claim review,
June 30, 2007, that expires in December 2009.
which increased our share of the reserves by $1.4 million.
The strengthening of certain other catastrophic injury
reserves was due to increasing pharmaceutical costs and
a deterioration in the health of the claimants.
Investment operations
Net revenue from investment operations increased 28.3 “Safe Harbor” Statement Under the Private Securities
percent in the second quarter of 2007 to $37.8 million Litigation Reform Act of 1995: Certain forward-looking
compared to $29.5 million in the second quarter of 2006. statements contained herein involve risks and uncertainties.
These statements include certain discussions relating to
Equity in earnings of limited partnerships contributed
management fee revenue, cost of management operations,
significantly to the improved investment performance,
underwriting, premium and investment income volume,
increasing by $6.1 million in the second quarter of 2007. business strategies, profitability and business relationships
Optimal market conditions resulted in a higher return on and the Company’s other business activities during 2007
capital on mezzanine debt and private equity partnership and beyond. In some cases, you can identify forward-looking
investments by some of our more seasoned limited statements by terms such as “may,” “will,” “should,” “could,”
partnerships and realized gains on sales of commercial “would,” “expect,” “plan,” “intend,” “anticipate,” “believe,”
properties owned by our real estate limited partnerships. “contemplate,” “estimate,” “project,” “predict,” “potential”
and similar expressions. These forward-looking statements
Net realized gains on investments were $2.2 million reflect the Company’s current views about future events, are
in the second quarter of 2007 compared to losses of based on assumptions and are subject to known and unknown
$0.6 million in 2006. Included in net realized gains on risks and uncertainties that may cause results to differ materially
investments are impairment charges of $2.0 million and from those anticipated in those statements. Many of the factors
$1.3 million during the second quarters of 2007 and that will determine future events or achievements are beyond
our ability to control or predict.
2006, respectively. Impairment charges recorded on fixed
maturity and equity securities during the first six months
of 2007 and 2006 were $2.6 million and $3.4 million,
respectively.
4
5. CONSOLIDATED STATEMENTS OF OPERATIONS
(Dollars in thousands, except in per share data)
Three months ended Six months ended
June 30 June 30
2007 2006 2007 2006
(unaudited) (unaudited)
Operating revenue
Management fee revenue—net $ 242,324 $ 237,233 $ 458,343 $ 457,334
Premiums earned 52,122 53,825 104,096 107,852
Service agreement revenue 7,299 6,506 14,717 14,098
Total operating revenue 301,745 297,564 577,156 579,284
Operating expenses
Cost of management operations 195,969 189,939 375,855 373,093
Losses and loss adjustment expenses incurred 29,789 38,635 62,023 68,688
Policy acquisition and other underwriting expenses 11,695 12,079 23,689 26,580
Total operating expenses 237,453 240,653 461,567 468,361
Investment income—unaffiliated
Investment income, net of expenses 14,138 14,603 28,116 29,603
Net realized gains (losses) on investments 2,222 ( 632) 4,112 152
Equity in earnings of limited partnerships 20,180 14,058 32,698 18,200
Total investment income—unaffiliated 36,540 28,029 64,926 47,955
Income before income taxes and equity in earnings
of Erie Family Life Insurance Company 100,832 84,940 180,515 158,878
Provision for income taxes 31,505 30,015 56,098 55,092
Equity in earnings of Erie Family Life Insurance
Company, net of tax 1,159 1,330 2,430 1,935
Net income $ 70,486 $ 56,255 $ 126,847 $ 105,721
Net income per share:
Class A common stock—basic $ 1.22 $ 0.95 $ 2.19 $ 1.76
Class A common stock—diluted 1.11 0.86 1.99 1.59
Class B common stock—basic and diluted 187.31 144.90 336.32 265.30
Weighted average shares outstanding:
Class A common stock—basic 57,337,436 59,063,615 57,513,372 59,842,796
Class A common stock—diluted 63,556,114 65,554,096 63,734,450 66,527,677
Class B common stock—basic and diluted 2,571 2,670 2,572 2,751
Dividends declared per share:
Class A common stock $ 0.40 $ 0.36 $ 0.80 $ 0.72
Class B common stock 60.00 54.00 120.00 108.00
5
6. CONSOLIDATED STATEMENTS OF OPERATIONS—SEGMENT BASIS
(Amounts in thousands, except in per share data)
Three months ended Six months ended
June 30 June 30
2007 2006 2007 2006
(unaudited) (unaudited)
Management operations
Management fee revenue $ 256,462 $ 251,104 $ 485,106 $ 484,039
Service agreement revenue 7,299 6,506 14,717 14,098
Total revenue from management operations 263,761 257,610 499,823 498,137
Cost of management operations 207,392 201,028 397,777 394,854
Income from management operations 56,369 56,582 102,046 103,283
Insurance underwriting operations
Premiums earned 52,122 53,825 104,096 107,852
Losses and loss adjustment expenses incurred 29,789 38,635 62,023 68,688
Policy acquisition and other underwriting expenses 14,410 14,861 28,530 31,524
Total losses and expenses 44,199 53,496 90,553 100,212
Underwriting gain 7,923 329 13,543 7,640
Investment operations
Investment income, net of expenses 14,138 14,603 28,116 29,603
Net realized gains (losses) on investments 2,222 ( 632) 4,112 152
Equity in earnings of limited partnerships 20,180 14,058 32,698 18,200
Equity in earnings of Erie Family Life Insurance Company 1,247 1,430 2,613 2,081
Net revenue from investment operations 37,787 29,459 67,539 50,036
Income before income taxes 102,079 86,370 183,128 160,959
Provision for income taxes 31,593 30,115 56,281 55,238
Net income $ 70,486 $ 56,255 $ 126,847 $ 105,721
Net income per share—Class A basic $ 1.22 $ 0.95 $ 2.19 $ 1.76
Net income per share—Class A diluted 1.11 0.86 1.99 1.59
Net income per share—Class B basic and diluted 187.31 144.90 336.32 265.30
Weighted average shares outstanding—
Class A diluted 63,556 65,554 63,734 66,528
Amounts presented on a segment basis are gross of intercompany/intersegment items
6
7. RECONCILIATION OF OPERATING INCOME TO NET INCOME
We use operating income to evaluate the results of
Definition of non-GAAP and
operations. It reveals trends in our management services,
operating measures
insurance underwriting and investment operations that
We believe that investors’ understanding of our perfor- may be obscured by the net effects of realized capital
mance is enhanced by the disclosure of the following non- gains and losses. Realized capital gains and losses may
GAAP financial measure. Our method of calculating this vary significantly between periods and are generally
measure may differ from those used by other companies driven by business decisions and economic developments
and therefore comparability may be limited. such as capital market condition, the timing of which is
unrelated to our management services and insurance
Operating income is net income excluding realized
underwriting processes. We believe it is useful for
capital gains and losses and related federal income
investors to evaluate these components separately and in
taxes. Equity in earnings or losses of Erie Family Life
the aggregate when reviewing our performance. We are
Insurance Company and equity in earnings or losses of
aware that the price to earnings multiple commonly used
limited partnerships are not excluded from the calculation
by investors as a forward-looking valuation technique uses
of operating income. Both of these categories include
operating income as the denominator. Operating income
the respective investment’s realized capital gains and
should not be considered as a substitute for net income
losses, as well as unrealized gains and losses, as these
and does not reflect our overall profitability.
investments are accounted for under the equity method.
The following table reconciles operating income and net
Net income is the GAAP measure that is most directly
income for the periods ended June 30, 2007 and 2006:
comparable to operating income.
Three months ended Six months ended
June 30 June 30
(unaudited) (unaudited)
(in thousands, except per share data)
2007 2006 2007 2006
Operating income $ 69,042 $ 56,666 $ 124,174 $ 105,622
Net realized gains (losses) on investments 2,222 (632) 4,112 152
Income tax (expense) benefit on realized
gains (losses) ( 778) 221 ( 1,439) ( 53)
Realized gains (losses), net of income taxes 1,444 ( 411) 2,673 99
Net income $ 70,486 $ 56,255 $ 126,847 $ 105,721
Three months ended Six months ended
June 30 June 30
(unaudited) (unaudited)
Per Class A Share—Diluted 2007 2006 2007 2006
Operating income $ 1.09 $ 0.87 $ 1.95 $ 1.59
Net realized gains (losses) on investments 0.03 ( 0.01) 0.06 0.00
Income tax (expense) benefit on realized gains (losses) ( 0.01) 0.00 ( 0.02) 0.00
Realized gains (losses), net of income tax expense 0.02 ( 0.01) 0.04 0.00
Net income $ 1.11 $ 0.86 $ 1.99 $ 1.59
7