Call Girls in New Ashok Nagar, (delhi) call me [9953056974] escort service 24X7
Q4 2006 Earnings Release Financial Tables
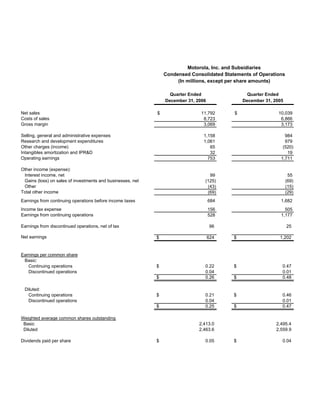
1. Motorola, Inc. and Subsidiaries
Condensed Consolidated Statements of Operations
(In millions, except per share amounts)
Quarter Ended Quarter Ended
December 31, 2006 December 31, 2005
Net sales $ 11,792 $ 10,039
Costs of sales 8,723 6,866
Gross margin 3,069 3,173
Selling, general and administrative expenses 1,158 984
Research and development expenditures 1,061 979
Other charges (income) 65 (520)
Intangibles amortization and IPR&D 32 19
Operating earnings 753 1,711
Other income (expense):
Interest income, net 99 55
Gains (loss) on sales of investments and businesses, net (125) (69)
Other (43) (15)
Total other income (69) (29)
Earnings from continuing operations before income taxes 684 1,682
Income tax expense 156 505
Earnings from continuing operations 528 1,177
Earnings from discontinued operations, net of tax 96 25
Net earnings $ 624 $ 1,202
Earnings per common share
Basic:
Continuing operations $ 0.22 $ 0.47
Discontinued operations 0.04 0.01
$ 0.26 $ 0.48
Diluted:
Continuing operations $ 0.21 $ 0.46
Discontinued operations 0.04 0.01
$ 0.25 $ 0.47
Weighted average common shares outstanding
Basic 2,413.0 2,495.4
Diluted 2,463.6 2,559.9
Dividends paid per share $ 0.05 $ 0.04
2. Motorola, Inc. and Subsidiaries
Condensed Consolidated Statements of Operations
(In millions, except per share amounts)
Year Ended Year Ended
December 31, 2006 December 31, 2005
Net sales $ 42,879 $ 35,262
Costs of sales 30,152 23,833
Gross margin 12,727 11,429
Selling, general and administrative expenses 4,504 3,628
Research and development expenditures 4,106 3,600
Other charges (income) (108) (473)
Intangibles amortization and IPR&D 133 69
Operating earnings 4,092 4,605
Other income (expense):
Interest income, net 326 71
Gains (loss) on sales of investments and businesses, net 41 1,845
Other 151 (109)
Total other income 518 1,807
Earnings from continuing operations before income taxes 4,610 6,412
Income tax expense 1,349 1,893
Earnings from continuing operations 3,261 4,519
Earnings from discontinued operations, net of tax 400 59
Net earnings $ 3,661 $ 4,578
Earnings per common share
Basic:
Continuing operations $ 1.33 $ 1.83
Discontinued operations 0.17 0.02
$ 1.50 $ 1.85
Diluted:
Continuing operations $ 1.30 $ 1.79
Discontinued operations 0.16 0.02
$ 1.46 $ 1.81
Weighted average common shares outstanding
Basic 2,446.3 2,471.3
Diluted 2,504.2 2,527.0
Dividends paid per share $ 0.18 $ 0.16
3. Motorola, Inc. and Subsidiaries
Condensed Consolidated Balance Sheets
(In millions)
ASSETS December 31, December 31,
2006 2005
Cash and cash equivalents $ 3,212 $ 3,774
Sigma funds 12,204 10,867
Short-term investments 224 144
Accounts receivable, net 7,509 5,652
Inventories, net 3,162 2,422
Deferred income taxes 1,731 2,355
Other current assets 2,933 2,496
Current assets held for sale - 312
Total current assets 30,975 28,022
Property, plant and equipment, net 2,267 2,020
Investments 895 1,644
Deferred income taxes 1,297 1,196
Other assets 3,131 2,597
Non-current assets held for sale - 323
Total assets $ 38,565 $ 35,802
LIABILITIES AND STOCKHOLDERS' EQUITY
Notes payable and current portion of
long-term debt $ 1,693 $ 448
Accounts payable 5,056 4,295
Accrued liabilities 8,676 7,529
Current liabilities held for sale - 320
Total current liabilities 15,425 12,592
Long-term debt 2,704 3,806
Other liabilities 3,322 2,727
Non-current liabilities held for sale - 4
Stockholders' equity 17,114 16,673
Total liabilities and stockholders' equity $ 38,565 $ 35,802
4. Motorola, Inc. and Subsidiaries
Segment Information
(In millions)
Summarized below are the Company's net sales by reportable segment for the quarters and years
ended December 31, 2006 and 2005.
Net Sales
Quarter Ended Quarter Ended % Change
December 31, 2006 December 31, 2005 from 2005
Mobile Devices $ 7,806 $ 6,538 19%
Networks and Enterprise 3,043 2,874 6%
Connected Home Solutions 980 703 39%
Segment Totals 11,829 10,115 17%
Other and Eliminations (37) (76) 51%
Company Totals $ 11,792 $ 10,039 17%
Net Sales
Year Ended Year Ended % Change
December 31, 2006 December 31, 2005 from 2005
Mobile Devices $ 28,383 $ 21,459 32%
Networks and Enterprise 11,245 11,202 0%
Connected Home Solutions 3,327 2,871 16%
Segment Totals 42,955 35,532 21%
Other and Eliminations (76) (270) 72%
Company Totals $ 42,879 $ 35,262 22%
5. Motorola, Inc. and Subsidiaries
Segment Information
(In millions)
Summarized below are the Company's operating earnings (loss) by reportable segment
for the quarters and years ended December 31, 2006 and 2005.
Operating Earnings (Loss)
Quarter Ended Quarter Ended
December 31, 2006 December 31, 2005
Mobile Devices $ 341 $ 663
Networks and Enterprise 428 542
Connected Home Solutions 118 52
Segment Totals 887 1,257
Other and Eliminations (134) 454
Company Totals $ 753 $ 1,711
Operating Earnings (Loss)
Year Ended Year Ended
December 31, 2006 December 31, 2005
Mobile Devices $ 2,690 $ 2,192
Networks and Enterprise 1,521 1,939
Connected Home Solutions 224 153
Segment Totals 4,435 4,284
Other and Eliminations (343) 321
Company Totals $ 4,092 $ 4,605