coca cola Reconciliation of Non-GAAP Financial Measures
1. The Company reports its financial results in accordance with generally accepted accounting principles (GAAP). However, management believes
that certain non-GAAP performance measures, ratios and trends used in managing the business, may provide users of this financial information
additional meaningful comparisons between current results and results in prior operating periods. Management believes that these non-GAAP
measures can provide meaningful reflection of underlying trends of the business. See the tables below for supplemental financial data and
corresponding reconciliations to GAAP financial measures for the year 1998 and 2003. Non-GAAP financial measures should be viewed in
addition to, and not as an alternative for, the Company's reported results prepared in accordance with GAAP.
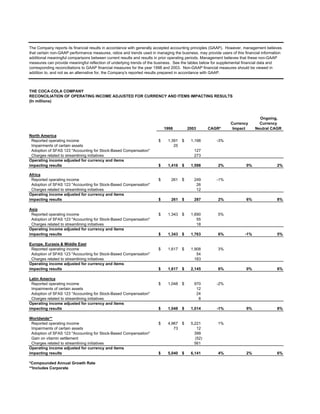
THE COCA-COLA COMPANY
RECONCILIATION OF OPERATING INCOME ADJUSTED FOR CURRENCY AND ITEMS IMPACTING RESULTS
(In millions)
Ongoing,
Currency Currency
1998 2003 CAGR* Impact Neutral CAGR
North America
Reported operating income $ 1,391 $ 1,198 -3%
Impairments of certain assets 25
Adoption of SFAS 123 quot;Accounting for Stock-Based Compensationquot; 127
Charges related to streamlining initiatives 273
Operating income adjusted for currency and items
impacting results $ 1,416 $ 1,598 2% 0% 2%
Africa
Reported operating income $ 261 $ 249 -1%
Adoption of SFAS 123 quot;Accounting for Stock-Based Compensationquot; 26
Charges related to streamlining initiatives 12
Operating income adjusted for currency and items
impacting results $ 261 $ 287 2% 6% 8%
Asia
Reported operating income $ 1,343 $ 1,690 5%
Adoption of SFAS 123 quot;Accounting for Stock-Based Compensationquot; 55
Charges related to streamlining initiatives 18
Operating income adjusted for currency and items
impacting results $ 1,343 $ 1,763 6% -1% 5%
Europe, Eurasia & Middle East
Reported operating income $ 1,617 $ 1,908 3%
Adoption of SFAS 123 quot;Accounting for Stock-Based Compensationquot; 54
Charges related to streamlining initiatives 183
Operating income adjusted for currency and items
impacting results $ 1,617 $ 2,145 6% 0% 6%
Latin America
Reported operating income $ 1,048 $ 970 -2%
Impairments of certain assets 12
Adoption of SFAS 123 quot;Accounting for Stock-Based Compensationquot; 24
Charges related to streamlining initiatives 8
Operating income adjusted for currency and items
impacting results $ 1,048 $ 1,014 -1% 9% 8%
Worldwide**
Reported operating income $ 4,967 $ 5,221 1%
Impairments of certain assets 73 12
Adoption of SFAS 123 quot;Accounting for Stock-Based Compensationquot; 399
Gain on vitamin settlement (52)
Charges related to streamlining initiatives 561
Operating income adjusted for currency and items
impacting results $ 5,040 $ 6,141 4% 2% 6%
*Compounded Annual Growth Rate
**Includes Corporate
2. The Company reports its financial results in accordance with generally accepted accounting principles (GAAP). However, management believes that certain non-GAAP performance measures, ratios and trends used in managing the
business, may provide users of this financial information additional meaningful comparisons between current results and results in prior operating periods. Management believes that these non-GAAP measures can provide more meaningful
reflection of underlying trends of the business because it provides a comparison of historical information that excludes certain items that impact the overall comparability due to the fact that these items do not represent results from the
fundamental operations of the Company. Further, the timeframe used is to provide historical perspective to investors. See the Table below for supplemental financial data and corresponding reconciliations to GAAP financial measures for
the fourteen year period from 1990 to 2003. Non-GAAP financial measures should be viewed in addition to, and not as an alternative for, the Company's reported results prepared in accordance with GAAP.
THE COCA-COLA COMPANY
RECONCILIATION OF ONGOING DILUTED EARNINGS PER SHARE
CAGR **
1990 1991 1992 1993 1994 1995 1996 1997 1998 1999 2000 2001 2002 2003 1990-1997 1997-2003
Reported Diluted Earnings Per Share $ 0.50 $ 0.60 $ 0.62 $ 0.83 $ 0.98 $ 1.17 $ 1.38 $ 1.64 $ 1.42 $ 0.98 $ 0.88 $ 1.60 $ 1.23 $ 1.77 18% 1%
Gains (0.01) (0.01) (0.04) (0.02) (0.20) (0.20) (0.04) (0.05) (0.02) (0.01) (0.01)
Charges 0.01 0.01 0.02 0.02 0.18 0.02 0.02 0.38 0.77 0.08 0.07 0.20
Accounting Changes 0.09 0.48 0.13
Ongoing Diluted Earnings Per Share* $ 0.50 $ 0.60 $ 0.71 $ 0.81 $ 0.98 $ 1.17 $ 1.36 $ 1.46 $ 1.40 $ 1.36 $ 1.60 $ 1.66 $ 1.77 $ 2.07 17% 6%
* Per share amounts may not add due to rounding.
** Compounded Annual Growth Rate
1990
Gain
Gain on our investment in BCI Securities L.P. - $0.01 per share.
Charge
Charges related to United States soft drink business - $0.01 per share.
1991
Gains
Gain on sale of property in Japan - $0.01 per share.
Charges
Share of restructuring charges recorded by Coca-Cola Enterprises (CCE) - $0.01 per share.
1992
Accounting Change
Transition charge related to the change in accounting for postemployment benefits - $0.09 per share.
1993
Gains
Change in US tax law which reduced full year income - $0.02 per share.
Gain from the sale of citrus groves in the United States - $0.01 per share.
Gain from the sale of real estate in Japan - $0.01 per share.
Charges
Provisions to increase efficiencies in the United States, Greater Europe, and Corporate - $0.01 per share.
Share of restructuring charges recorded by Coca-Cola Beverages Ltd. - $0.01 per share.
1995
Gain
Noncash gain on the issuance of stock by CCA - $0.02 per share.
Charge
Provisions related to increase efficiencies in the North America and Greater Europe - $0.02 per share.
1996
Gains
Noncash gain from a tax settlement with the IRS - $0.13 per share.
Noncash gain on the issuance of stock by Coca-Cola Erfrischungsgetraenke AG (CCEAG) - $0.04 per share.
Noncash gain on the issuance of stock by Coca-Cola Amatil (CCA) - $0.03 per share.
Charges
Curtailment of concentrate shipments - approximately $0.08 per share.
Provisions related to management's strategic plans to strengthen our worldwide system - $0.07 per share.
Charge for our decision to contribute to the corpus of The Coca-Cola Foundation, a not-for-profit charitable organization - $0.01 per share.
Impairment charge to recognize Project Infinity's impact on existing information systems - $0.02 per share.
3. continued
1997
Gains
Gain on sale of Coca-Cola Schweppes Beverages Ltd. to CCE - $0.08 per share.
Noncash gain on the issuance of stock by CCA - approximately $0.08 per share.
Gain on sale of Coca-Cola Beverages Ltd of Canada and The Coca-Cola Bottling Company of New York to CCE - $0.04 per share.
Charges
Provisions related to enhancing manufacturing efficiencies in North America - $0.02 per share.
1998
Gain
Gain on sale of our Italian bottling operations in northern and central Italy to Coca-Coca Beverages - $0.03 per share.
Noncash gain on the issuance of stock by CCEAG - $0.01 per share.
Charges
Provisions related to impairment of certain assets in North America and Corporate - $0.02 per share.
1999
Charges
Charges related to impairment of certain bottling, manufacturing and intangible assets - $0.31 per share.
Impact of European product withdrawal - approximately $0.06 per share.
Share of charges recorded by equity investees in countries such as Venezuela and the Philippines - $0.01 per share.
2000
Gains
Gain related to the merger of Coca-Cola Beverages and Hellenic Bottling Company S.A. - $0.05 per share.
Charges
Charges related to the costs associated with a major organizational realignment - $0.24 per share.
Share of charges recorded by equity investees - $0.19 per share.
Charges related to the impairment of certain bottling, manufacturing and intangible assets, primarily within our Indian bottling operations - $0.16 per share.
Planned concentrate inventory reduction by certain bottlers - approximately $0.12 per share.
Charges related to the settlement terms of a class action discrimination lawsuit - $0.05 per share.
Incremental marketing expense in Central Europe - $0.01 per share.
2001
Gain
Noncash gain on the issuance of stock by one of our equity investees, CCE - $0.02 per share.
Charge
Incremental marketing expense in the United States, Japan and Europe - $0.08 per share.
2002
Gain
Share of the gain related to the sale of Cervejarias Kaiser Brazil ,Ltda. - $0.01 per share.
Charges
Write-down of certain investments primarily related to Latin America - $0.06 per share.
Share of impairment and restructuring charges taken by certain investees in Latin America - $0.01 per share.
Accounting Changes
Adoption of SFAS No. 142 quot;Goodwill and Other Intangible Assetsquot; - $0.37 per share.
Adoption of SFAS No. 123 quot;Accounting for Stock-Based Compensationquot; using the modified prospective method as described in SFAS No. 148 quot;Accounting for Stock-Based Compensation - Transition and Disclosurequot;
- $0.11 per share.
2003
Gains
Gain related to the litigation settlement - $0.01 per share.
Charges
Charges related to the costs associated with the streamlining initiatives - $0.15 per share.
Write-down of certain investments primarily related to Latin America - $0.05 per share.
Accounting Changes
Adoption of SFAS No. 123 quot;Accounting for Stock-Based Compensationquot; using the modified prospective method as described in SFAS No. 148 quot;Accounting for Stock-Based Compensation - Transition and Disclosurequot;
- $0.13 per share.
4. The Company reports its financial results in accordance with generally accepted accounting principles (GAAP). However,
management believes that certain non-GAAP performance measures, ratios and trends used in managing the business,
may provide users of this financial information additional meaningful reflection of underlying trends of the business. See
the table below for supplemental financial data and corresponding reconciliations to GAAP financial measures for the five
year period from 2000 to 2004. Non-GAAP financial measures should be viewed in addition to, and not as an alternative
for, the Company's reported results prepared in accordance with GAAP.
THE COCA-COLA COMPANY
RECONCILIATION OF CASH FLOWS*
(In billions)
Total
2000-2004E**
Net cash used in investing activities $ 5.2
Less: Purchases of PPE 4.0
Net cash used in investing activities excluding purchases of
property, plant and equipment 1.2 (A)
Net cash used in financing activities 14.3
Less: Purchases of stock for treasury 4.5
Less: Dividends 10.0
Net cash used in financing activities excluding shares
repurchased and dividends paid (0.2) (A)
Effect of Exchange Rate Changes on Cash and Cash Equivalents (0.1) (A)
Increase in cash during the year 4.2 (A)
Sum of acquisitions, debt restructuring and other $ 5.1 Sum of (A)
* Relates to slides entitled quot;Strong Cash Flows are Expected to Continue.quot;
** 2004E based on full year 2004 estimates.