coca cola Reconciliation of Q3 and YTD 2005 Non-GAAP Financial Measures
1. The Company reports its financial results in accordance with generally accepted accounting principles (GAAP). However, management believes that certain non-GAAP performance measures and ratios used in managing the
business may provide users of this financial information additional meaningful comparisons between current results and results in prior operating periods. Management believes that these non-GAAP measures can provide
additional meaningful reflection of underlying trends of the business because they provide a comparison of historical information that excludes certain items that impact the overall comparability due to the fact that these items do
not represent results from the fundamental operations of the Company. See the Table below for supplemental financial data and corresponding reconciliations to GAAP financial measures for the three months ended September
30, 2005 and October 1, 2004. Non-GAAP financial measures should be viewed in addition to, and not as an alternative for, the Company’s reported results prepared in accordance with GAAP.
THE COCA-COLA COMPANY AND SUBSIDIARIES
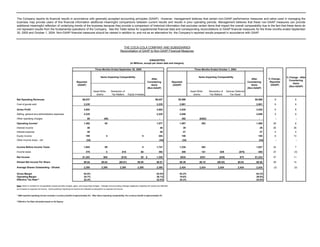
Reconciliation of GAAP to Non-GAAP Financial Measures
(UNAUDITED)
(In Millions, except per share data and margins)
Three Months Ended September 30, 2005 Three Months Ended October 1, 2004
Items Impacting Comparability Items Impacting Comparability % Change - After
% Change -
After After
Considering
Reported
Reported Considering Reported Considering
Items
(GAAP)
(GAAP) Items (GAAP) Items
(Non-GAAP)
(Non-GAAP) (Non-GAAP)
Asset Write- Resolution of Asset Write- Resolution of German Deferred
downs Tax Matters Equity Investee downs Tax Matters Tax Asset
Net Operating Revenues $6,037 $6,037 $5,596 $5,596 8 8
Cost of goods sold 2,235 2,235 2,061 2,061 8 8
Gross Profit 3,802 3,802 3,535 3,535 8 8
Selling, general and administrative expenses 2,225 2,225 2,046 2,046 9 9
Other operating charges 85 (85) - 392 ($392) - -- --
Operating Income* 1,492 85 1,577 1,097 392 1,489 36 6
Interest income 49 49 39 39 26 26
Interest expense 49 49 47 47 4 4
Equity income 195 4 5 204 180 180 8 13
Other income (loss) - net (34) (34) (34) (34) -- --
Income Before Income Taxes 1,653 89 5 1,747 1,235 392 1,627 34 7
Income taxes 370 4 $18 $0 392 300 141 $39 ($75) 405 23 (3)
Net Income $1,283 $85 ($18) $5 $ 1,355 $935 $251 ($39) $75 $1,222 37 11
Diluted Net Income Per Share $0.54 $0.04 ($0.01) $0.00 $0.57 $0.39 $0.10 ($0.02) $0.03 $0.50 38 14
Average Shares Outstanding - Diluted 2,385 2,385 2,385 2,385 2,385 2,424 2,424 2,424 2,424 2,424 (2) (2)
Gross Margin 63.0% 63.0% 63.2% 63.2%
Operating Margin 24.7% 26.1% 19.6% 26.6%
Effective Tax Rate** 22.4% 22.5% 24.3% 24.9%
Note: Items to consider for comparability include primarily charges, gains, and accounting changes. Charges and accounting changes negatively impacting net income are reflected
as increases to reported net income. Gains positively impacting net income are reflected as deductions to reported net income.
* 2005 reported operating income includes a currency benefit of approximately 6%. After items impacting comparability, the currency benefit is approximately 4%.
**Effective Tax Rate calculated based on full figures
2. The Company reports its financial results in accordance with generally accepted accounting principles (GAAP). However, management believes that certain non-GAAP performance measures and ratios used in managing the business may provide users of this financial information additional
meaningful comparisons between current results and results in prior operating periods. Management believes that these non-GAAP measures can provide additional meaningful reflection of underlying trends of the business because they provide a comparison of historical information that
excludes certain items that impact the overall comparability due to the fact that these items do not represent results from the fundamental operations of the Company. See the Table below for supplemental financial data and corresponding reconciliations to GAAP financial measures for the six
months ended September 30, 2005 and October 1, 2004. Non-GAAP financial measures should be viewed in addition to, and not as an alternative for, the Company’s reported results prepared in accordance with GAAP.
THE COCA-COLA COMPANY AND SUBSIDIARIES
Reconciliation of GAAP to Non-GAAP Financial Measures
(UNAUDITED)
(In Millions, except per share data and margins)
Nine Months Ended September 30, 2005 Nine Months Ended October 1, 2004
% Change -
Items Impacting Comparability Items Impacting Comparability
% Change - After
After After
Reported Considering
Reported Considering Reported Considering
(GAAP) Items
(GAAP) Items (GAAP) Items
Accelerated
(Non-GAAP)
(Non-GAAP) (Non-GAAP)
Repatriation of Issuances of Amortization of Gain on Issuance
HFCS Resolution of Foreign Stock by Equity Stock-Based Asset Write- Tax Settlement at of Stock by Equity Resolution of German Deferred
Settlement Tax Matters Earnings Investees Compensation Equity Investee downs Coca-Cola Femsa Investee Asset Write-down Tax Matters Tax Asset
Net Operating Revenues $17,553 $17,553 $16,538 $16,538 6 6
Cost of goods sold 6,199 $42 6,241 5,861 5,861 6 6
Gross Profit 11,354 (42) 11,312 10,677 10,677 6 6
Selling, general and administrative expenses 6,446 ($50) 6,396 5,846 5,846 10 9
Other operating charges 85 ($85) - 480 ($480) - -- --
Operating Income 4,823 (42) 50 85 4,916 4,351 480 4,831 11 2
Interest income 163 163 106 106 54 54
Interest expense 179 179 138 138 30 30
Equity income 553 ($16) 4 541 496 ($37) 459 11 18
Other income (loss) - net (66) (66) (64) (64) -- --
Gain on issuances of stock by equity investees 23 (23) - 49 ($49) - -- --
Income Before Income Taxes 5,317 (42) (23) 50 (16) 89 5,375 4,800 (37) (49) 480 5,194 11 3
Income taxes 1,309 (16) $91 ($127) ($8) 12 (2) 4 1,263 1,154 (13) (19) 171 $80 ($75) 1,298 13 (3)
Net Income $4,008 ($26) ($91) $127 ($15) $38 ($14) $85 $ 4,112 $3,646 ($24) ($30) $309 ($80) $75 $3,896 10 6
Diluted Net Income Per Share $1.67 ($0.01) ($0.04) $0.05 ($0.01) $0.02 ($0.01) $0.04 $1.71 $1.50 ($0.01) ($0.01) $0.13 ($0.03) $0.03 $1.60 * 11 7
Average Shares Outstanding - Diluted 2,399 2,399 2,399 2,399 2,399 2,399 2,399 2,399 2,399 2,434 2,434 2,434 2,434 2,434 2,434 2,434 (1) (1)
Gross Margin 64.7% 64.4% 64.6% 64.6%
Operating Margin 27.5% 28.0% 26.3% 29.2%
Effective Tax Rate 24.6% 23.5% 24.0% 25.0%
Note: Items to consider for comparability include primarily charges, gains, and accounting changes. Charges and accounting changes negatively impacting net income are reflected
as increases to reported net income. Gains positively impacting net income are reflected as deductions to reported net income.
*Per share amounts may not add due to rounding.
3. The Company reports its financial results in accordance with generally accepted accounting principles (GAAP). However, management believes that certain non-GAAP
performance measures and ratios used in managing the business may provide users of this financial information additional meaningful comparisons between current results and
results in prior operating periods. Management believes that these non-GAAP measures can provide additional meaningful reflection of underlying trends of the business because
they provide a comparison of historical information that excludes certain items that impact the overall comparability due to the fact that these items do not represent results from the
fundamental operations of the Company. See the Table below for supplemental financial data and corresponding reconciliations to GAAP financial measures for the three months
ended September 30, 2005 and October 1, 2004. Non-GAAP financial measures should be viewed in addition to, and not as an alternative for, the Company’s reported results
prepared in accordance with GAAP.
THE COCA-COLA COMPANY AND SUBSIDIARIES
Reconciliation of GAAP to Non-GAAP Financial Measures
Operating Income (Loss), by Segment
(UNAUDITED)
(In Millions)
% Change -
Three Months Ended September 30, 2005 Three Months Ended October 1, 2004
% Change - After
Items
Reported Considering
Items Impacting
After After
Impacting
(GAAP) Items
Comparability
Reported Considering Reported Considering
Comparability
(Non-GAAP)
(GAAP) Items (GAAP) Items
(Non-GAAP) (Non-GAAP)
Asset Asset
Write-downs Write-downs
North America $414 $414 $377 $377 10 10
Africa 106 106 83 83 28 28
East, South Asia and Pacific Rim (19) $85 66 76 $15 91 (125) (27)
European Union 586 586 146 368 514 301 14
Latin America 303 303 266 266 14 14
North Asia, Eurasia and Middle East 371 371 421 3 424 (12) (13)
Corporate (269) (269) (272) $6 (266) 1 (1)
Consolidated $1,492 $85 $1,577 $1,097 $392 $1,489 36 6
4. The Company reports its financial results in accordance with generally accepted accounting principles (GAAP). However, management believes that certain non-GAAP performance measures and
ratios used in managing the business may provide users of this financial information additional meaningful comparisons between current results and results in prior operating periods. Management
believes that these non-GAAP measures can provide additional meaningful reflection of underlying trends of the business because they provide a comparison of historical information that excludes
certain items that impact the overall comparability due to the fact that these items do not represent results from the fundamental operations of the Company. See the Table below for supplemental
financial data and corresponding reconciliations to GAAP financial measures for the nine months ended September 30, 2005 and October 1, 2004. Non-GAAP financial measures should be viewed
in addition to, and not as an alternative for, the Company’s reported results prepared in accordance with GAAP.
THE COCA-COLA COMPANY AND SUBSIDIARIES
Reconciliation of GAAP to Non-GAAP Financial Measures
Operating Income (Loss), by Segment
(UNAUDITED)
(In Millions)
Nine Months Ended September 30, 2005 Nine Months Ended October 1, 2004 % Change -
% Change - After
Reported Considering
Items Impacting
Items Impacting Comparability After After (GAAP) Items
Comparability
Reported Considering Reported Considering (Non-GAAP)
(GAAP) Items (GAAP) Items
(Non-GAAP) (Non-GAAP)
Asset
Accelerated
Amortization of Stock- HFCS Lawsuit Asset Write-downs
Based Compensation Settlement Write-downs
North America $1,188 $12 $1,200 $1,226 $18 $1,244 (3) (4)
Africa 280 3 283 238 238 18 19
East, South Asia and Pacific Rim 166 3 $85 254 299 15 314 (44) (19)
European Union 1,792 3 1,795 1,337 368 1,705 34 5
Latin America 886 4 890 781 6 787 13 13
North Asia, Eurasia and Middle East 1,302 3 1,305 1,283 9 1,292 1 1
Corporate (791) 22 ($42) (811) (813) 64 (749) 3 (8)
Consolidated $4,823 $50 ($42) $85 $4,916 $4,351 $480 $4,831 11 2