Contenu connexe
Similaire à Be Patient with the market report
Similaire à Be Patient with the market report (20)
Be Patient with the market report
- 1. RES-5357-U AUG 2009
U K S t r a t e g y r e p o r t
patIeNCe aND perSpeCtIVe
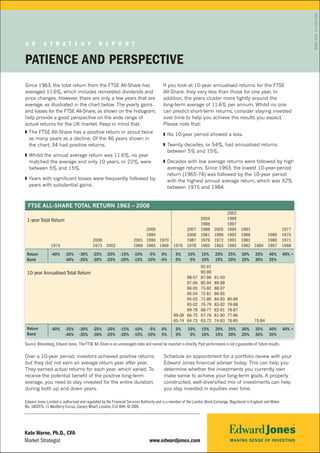
Since 1963, the total return from the FTSE All-Share has If you look at 10-year annualised returns for the FTSE
averaged 11.6%, which includes reinvested dividends and All-Share, they vary less than those for one year. In
price changes. However, there are only a few years that are addition, the years cluster more tightly around the
average, as illustrated in the chart below. The yearly gains long-term average of 11.6% per annum. Whilst no one
and losses for the FTSE All-Share, as shown on the histogram, can predict short-term returns, consider staying invested
help provide a good perspective on the wide range of over time to help you achieve the results you expect.
actual returns for the UK market. Keep in mind that: Please note that:
❚❚ The FTSE All-Share has a positive return in about twice
❚❚ No 10-year period showed a loss.
as many years as a decline. Of the 46 years shown in
the chart, 34 had positive returns. ❚❚ Twenty decades, or 54%, had annualised returns
between 5% and 15%.
❚❚ Whilst the annual average return was 11.6%, no year
matched the average and only 10 years, or 22%, were ❚❚ Decades with low average returns were followed by high
between 5% and 15%. average returns. Since 1963, the lowest 10-year-period
return (1965-74) was followed by the 10-year period
❚❚ Years with significant losses were frequently followed by
with the highest annual average return, which was 32%
years with substantial gains. between 1975 and 1984.
FTSE ALL-SHARE TOTAL RETURN % CHANGE 1963 - 2008
FTSE ALL-SHARE TOTAL RETURN % CHANGE–1963 - 2008
FTSE ALL-SHARE TOTAL RETURN 1963 2008 2003
1-year Total Return 2004 1999
2003
1998
2004 1997
1999
1-year Total Return 2000 2007 1988 2005
1998 1997 1993
1995 1977
1994
2000 2006
2007 1981
1988 1996
2005 1992 1986
1995 1993 1989 1975
1977
2008 2001 1994 1970
1990 1987
2006 1979
1981 1972
1996 1991 1983
1992 1986 1980
1989 1971
1975
1974 2008 2002
1973 1969 1964 1966
2001 1990 1970 1976 1987
1978 1965
1979 1963
1972 1991 1983 1984 1980
1985 1982 1967 1968
1971
Return 1974
-40% -35% -30% 1973 2002 -15% 1969 1964 1966
-25% -20% -10% -5% 0% 1976 1978
5% 10% 1965 1963
15% 20% 1985 1982 1984 1967
25% 30% 35% 40% 1968 +
40%
Band
Return -40% -40%
-35% -35%
-30% -25% -20% -15% -10% -10% -5%
-30% -25% -20% -15% -5% 0% 0% 5%
5% 10% 10% 15%
15% 20% 20%
25% 25%
30% 30%
35% 35%
40% 40% +
Band -40% -35% -30% -25% -20% -15% -10% -5% 0% 5% 10% 15% 20% 25% 30% 35%
92-01
10-year Annualised Total Return 90-99
92-01
98-07 87-96
91-00
90-99
10-year Annualised Total Return
97-06
98-07 85-94
89-98
87-96
91-00
96-05
97-06 73-82
88-97
85-94
89-98
95-04
96-05 72-81
86-95
73-82
88-97
94-03
95-04 71-80
84-93
72-81
86-95 80-89
93-02
94-03 70-79
83-92
71-80
84-93 79-88
80-89
69-78
93-02 68-77
82-91
70-79
83-92 78-87
79-88
99-08 69-78
66-75 67-76
81-90
68-77
82-91 77-86
78-87
65-74 64-73
99-08 66-75 63-72
74-83
67-76
81-90 76-85
77-86 75-84
Return -40% -35% -30% -25% -20% -15% -10% -5% 0% 65-74 64-73 63-72 74-83
5% 10% 15% 20% 76-85 30% 75-84 40% 40% +
25% 35%
Band
Return -40% -35% -30% -25% -20% -15% -10% -10% 0%
-40% -35% -30% -25% -20% -15% -5% 5% 0% 5% 10% 15%
5% 10% 15% 20% 20% 25% 30% 35%
25% 30% 35% 40% 40% +
Band -40% -35% -30% -25% -20% -15% -10% 5% 0% 5% 10% 15% 20% 25% 30% 35%
Source: Bloomberg, Edward Jones. The FTSE All-Share is an unmanaged index and cannot be invested in directly. Past performance is not a guarantee of future results.
Over a 10-year period, investors achieved positive returns Schedule an appointment for a portfolio review with your
but they did not earn an average return year after year. Edward Jones financial adviser today. This can help you
They earned actual returns for each year, which varied. To determine whether the investments you currently own
receive the potential benefit of the positive long-term make sense to achieve your long-term goals. A properly
average, you need to stay invested for the entire duration, constructed, well-diversified mix of investments can help
during both up and down years. you stay invested in equities over time.
Edward Jones Limited is authorised and regulated by the Financial Services Authority and is a member of the London Stock Exchange. Registered in England and Wales
No. 3403976. 11 Westferry Circus, Canary Wharf, London, E14 4HH. © 2009.
Kate Warne, ph.D., CFa
Market Strategist www.edwardjones.com