![Fig. 8-5: Model of Grand Strategy Clusters Rapid Market Growth Slow Market Growth ,[object Object],[object Object],[object Object],[object Object],[object Object],[object Object],[object Object],[object Object],[object Object],[object Object],[object Object],[object Object],[object Object],[object Object],[object Object],Strong Competitive Forces Weak Competitive Forces I II III IV](data:image/gif;base64,R0lGODlhAQABAIAAAAAAAP///yH5BAEAAAAALAAAAAABAAEAAAIBRAA7)
Recommandé
Contenu connexe
Tendances
Tendances (20)
En vedette
En vedette (14)
Similaire à Popular strategy diagrams
Similaire à Popular strategy diagrams (20)
Dernier
Dernier (20)
Popular strategy diagrams
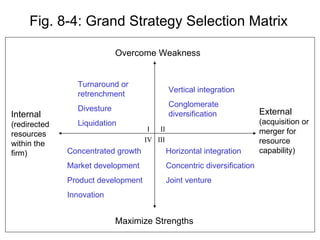
- 1. Fig. 8-4: Grand Strategy Selection Matrix Overcome Weakness Maximize Strengths Vertical integration Conglomerate diversification Horizontal integration Concentric diversification Joint venture Turnaround or retrenchment Divesture Liquidation Concentrated growth Market development Product development Innovation Internal (redirected resources within the firm) External (acquisition or merger for resource capability) I IV III II
- 3. Fig. 9-1: The BCG Growth-Share Matrix Cash Generation (market share) High Low High Low Cash Use (growth rate)
- 4. Fig. 8-5: BDC’s Growth/Share Matrix
- 6. Fig. 9-3: Industry Attractiveness-Business Strength Matrix Industry Attractiveness High Low Medium High Medium Low Business Strength
- 7. Fig. 9-3: Industry Attractiveness-Business Strength Matrix Industry Attractiveness Subjective assessment based on broadest possible range of external opportunities & threats beyond the strict control of management Business Strength Subjective assessment of how strong a competitive advantage is created by a broad range of the firm’s internal strengths & weaknesses Description of Dimensions
- 8. Fig. 9-4: The Market Life-Cycle Competitive Strength Matrix Stage of Market Life Cycle Introduction Growth Maturity Decline Low Moderate High Competitive Strength Push: Invest Aggressively Caution: Invest Selectively Danger: Harvest
- 9. Fig. 9-4: The Market Life Cycle - Competitive Strength Matrix Stage of Market Life Cycle See page 197 Competitive Strength Overall subjective rating, based on a wide range of factors regarding the likelihood of gaining & maintaining a competitive advantage Description of Dimensions
- 10. The business unit competitive position Strong Average Weak Fig. 8-10: The Life-Cycle Portfolio Matrix Development Growth Competitive shakeout Maturity Decline Saturation Th e Industry’s stage in the evolutionary life cycle
- 11. Fig. 8-7: The GE Nine-Cell Planning Grid