Savannas host the livelihoods of many thousands of people in Africa, while environmental policies addressing savanna preservation have been highly controversial (Homewood, 2004), especially in connection with bush encroachment, an important factor reducing available grazing areas for both domestic and wild animals. Contention is partly due to a very lively debate on tree-grass coexistence in savannas and on long-term ecosystem response to disturbance. The less studied rangelands of East Africa, where National Parks management is often in conflict with local communities and enclosures are difficult to apply, present a good opportunity to test some hypotheses about savanna dynamics, and thus to aid development of new guidelines for the preservation of this environment.
We previously studied the role of bush encroachment at centennial to millennial time-scales in the Dara range of the Mago National Park (MNP), south-western Ethiopia, an area inhabited by Mursi agro-pastoralists. We showed that bush encroachment is a transient state in savannas, fitting the control hypothesis for alternative stable states (Gil-Romera et al., 2010). Our aim in this paper is to explore the driving factors of bush encroachment at decennial time-scales; specifically the role of pastoralism -including fire and hervibory - and other auto-ecological processes such as fast species-specific seedling recruitment and self-thinning.
We surveyed 22 different areas in the Mursi region, within MNP, where fire and grazing had been applied at different times, >25 years (7 sites), over the last 10 years (7 sites) and over the last 5 years (8 sites). We recorded coordinates and biometric variables (height, canopy and dbh) for every woody taxon in 50x50m plots, and then analysed the spatial pattern of the different plots using point-pattern analyses.
Book Sex Workers Available Pune Call Girls Kondhwa 6297143586 Call Hot India...
Savanna encroachment in SW Ethiopia: spatial analyses at decadal time scales
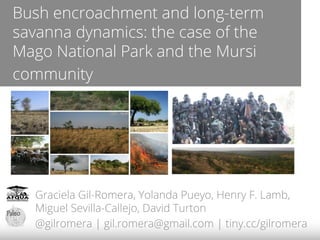
1. Bush encroachment and long-term
savanna dynamics: the case of the
Mago National Park and the Mursi
community
Graciela Gil-Romera, Yolanda Pueyo, Henry F. Lamb,
Miguel Sevilla-Callejo, David Turton
@gilromera | gil.romera@gmail.com | tiny.cc/gilromera
2. Why savannas?
•
Relevant ecosystem: 20%of Earth's cover
•
Tree-grass coexistence model,
non-equilibrium vs equilibrium systems
•
Bush encroachment threatens livelihoods
12. Lower Omo Valley: the place and
the Mursi people
12
•
Conservation narrative: grazing animals
remove the grass layer facilitating tree
expansion
•
African Parks uses this argument to
suggest restrictions on the use pastoralist
can make of the savanna
16. Research question
16
Is the Mursi landscape management leading to the
observed bush encroachment?
1. Does woody cover change with use?
2. Is there a tree/bush spatial pattern change based on
management?
→ Aggregation=Closed landscape
→ Repulsion/competition=Open landscape
17. Research question
17
Open ended interviews to knowledgeable people
on the use they make of their land, frequency of
burning, purpose and grazing practices
18. Assessing current Mursi
management: methods
18
•
Used/Burnt every year (T1)
•
Managed every 5-7 years (T2)
•
Not burnt/used over the last 20 years (T3)
22. Assessing current Mursi
management: methods
22
Q1.: Does woody cover change with use?
Estimating cover differences by
measuring total basal area
Q2.:Is there a tree/bush spatial pattern
change based on management?
Univariate point-pattern analyses
(Ripley's K function | Heterogeneus poisson process as
null model)
27. Assessing current Mursi
management: results
27
Cover estimation for each plot within each
management treatment
Management Plot
III P11 33 0.943
III P12 29 0.346
III P15 25 0.200
III P16 38 0.173
III P17 47 0.028
III P18 45 0.178
III P22 61 0.162
Mean 39.71 4.850
SD 12.338 0.860
No. woody
elements
Cover
(m2/ha)
Management Plot
I P01 32 3.181
I P04 14 0.090
I P05 24 0.134
I P06 22 0.246
I P08 254 0.238
I P20 201 0.016
I P21 33 0.006
Mean 82.86 0.558
SD 100.191 1.160
No. woody
elements
Cover
(m2/ha)
Management Plot
II P02 196 0.943
II P03 134 0.346
II P07 78 0.200
II P09 65 0.173
II P10 49 0.028
II P13 286 0.178
II P14 124 0.162
II P19 169.00 4.850
Mean 137.625 0.860
SD 78.640 1.636
No. woody
elements
Cover
(m2/ha)
Woody cover is actually larger
in areas that haven't been
used in the last 20 years
28. Assessing current Mursi
management: results
28
Cover estimation for each plot within each
management treatment
Management Plot
III P11 33 0.943
III P12 29 0.346
III P15 25 0.200
III P16 38 0.173
III P17 47 0.028
III P18 45 0.178
III P22 61 0.162
Mean 39.71 4.850
SD 12.338 0.860
No. woody
elements
Cover
(m2/ha)
Management Plot
I P01 32 3.181
I P04 14 0.090
I P05 24 0.134
I P06 22 0.246
I P08 254 0.238
I P20 201 0.016
I P21 33 0.006
Mean 82.86 0.558
SD 100.191 1.160
No. woody
elements
Cover
(m2/ha)
Management Plot
II P02 196 0.943
II P03 134 0.346
II P07 78 0.200
II P09 65 0.173
II P10 49 0.028
II P13 286 0.178
II P14 124 0.162
II P19 169.00 4.850
Mean 137.625 0.860
SD 78.640 1.636
No. woody
elements
Cover
(m2/ha)
Number of stems is larger in
T2 intermediate state on→
the savanna equilibrium
29. Assessing current Mursi
management: results
T1: used every year
1 2 3 4 5 6 7 8 9 10 11 12 13 14 15 16 17 18 19 20 21 22 23 24 25 26
0
0.02
0.04
0.06
0.08
0.1
0.12
0.14
0.16
Random pattern
Paircorrelation
function-Ripley'sK
30. Assessing current Mursi
management: results
T2: used every 5-7 years
1 2 3 4 5 6 7 8 9 10 11 12 13 14 15 16 17 18 19 20 21 22 23 24 25 26
0
0.02
0.04
0.06
0.08
0.1
0.12
0.14
0.16
Aggregated pattern over the
3-4 m around each stem
Paircorrelation
function-Ripley'sK
31. Assessing current Mursi
management: results
T3: not used in the last 20 years
1 2 3 4 5 6 7 8 9 10 11 12 13 14 15 16 17 18 19 20 21 22 23 24 25 26
0
0.02
0.04
0.06
0.08
0.1
0.12
0.14
0.16
Aggregated pattern on
the first 2 meter
Paircorrelation
function-Ripley'sK
32. Assessing current Mursi
management: discussion
Observed pattern: Trees show an aggregation
pattern some years after use-
Encroachment linked to a temporal scale?
33. Assessing current Mursi
management: discussion
Observed pattern: Trees show an aggregation pattern
some years after use- Encroachment linked to a
temporal scale?
Potential process
1- Abandonment leads to tree spreading as frequent fires are
absent (high number of trees,~cover)
2- Reached a certain level of encroachment, self-thinning
process or large natural fires open the landscape as reported
by locals.
(~ number of trees, high cover only the big ones survive)→
34. Assessing current Mursi
management: discussion
Hysteresis might be a process occurring at
multidecadal, centennial and millenial
time-scales.
Encroached savanna
Open savanna
35. Concluding remarks
Q1: Does woody cover change with use?
- Yes, it does, but not linearly with time
after use as there seems to be a threshold
response
36. Q2: Is there a tree/bush spatial pattern
change based on management?
- Yes and the change seems to be driven by
initial aggregation after abandonment
followed by inter/intra-specific interactions
or natural landscape opening
36
Concluding remarks
37. Still to do...
- Bivariate statistics: inter/intra-specific
interactions
- Analyses of finite size elements
37
Concluding remarks