The document discusses greening the built world through green buildings and renewable energy. It provides examples of green building certification programs and standards that assess efficiency and sustainability. It also examines the costs and benefits of green buildings, finding that they often have lower operating costs than conventional buildings due to energy and water savings, while having little to no increased construction costs. The document advocates increasing investment in clean energy technologies to reduce emissions and dependence on fossil fuels.
Pedro Martinez presents Sustainability at NH Hoteles
Greg Kats Presentation Ifc
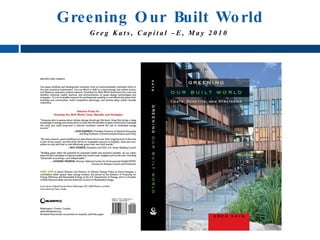
1. Greening O ur Built Wo rld
Greg Kats, Capital –E, May 2010
2. GEI Investment Po rtfo lio
JASPER WIND
Dummuies Windfarm Huntly Ltd. (UK)
Western Bio-Energy Ltd (UK)
Green
Wind Buildings &
Solar
Efficiency
Greg Kats, Capital –E, May 2010
3. Int ernat io nal Rat ing St andards – TO O LS
Greg Kats, Capital –E, May 2010
4. Scores are tallied for
different aspects of
efficiency and design
in appropriate
categories.
LEADERSHIP in
ENERGY and
For instance, LEED
ENVIRONMENTAL
assesses in detail:
DESIGN
1. Site Planning
A leading-edge
2. Water Management
system for certifying
3. Energy
DESIGN,
Management
CONSTRUCTION, &
4. Material Use
OPERATIONS
5. Indoor
of green buildings
Environmental
Air Quality
6. Innovation &
Design Process
Greg Kats, Capital –E, May 2010
6. Carbon Dioxide Intensity and Per Capita CO2 Emissions -- 20 0 1
(Fossil Fuel Combustion O nly)
25.00
United States
20.00
Netherlands Canada Australia
Tons of CO2 per person
15.00
Belgium
California Denmark
10.00
Germany
Japan Austria
New
S. Korea
Italy Zealand
Switzerland
France
5.00
Mexico
0.00
0.00 0.10 0.20 0.30 0.40 0.50 0.60 0.70 0.80 0.90 1.00
intensity (tons of CO2 per 2000 US Dollar)
Greg Kats, Capital –E, May 2010
7. Scope 1 2, & 3 GHG Emissions
,
Scope 1: Direct
Scope 2: Electricity Indirect
Scope 3: Other Indirect
Source: World Resources Institute
Greg Kats, Capital –E, May 2010
8. GHG Emission Reduction Potential by Sector
IPCC assessment of emission reduction potential in different sectors depending on
the carbon market price
Greg Kats, Capital –E, May 2010
9. Efficiency O ppo rtunities Increase
Greg Kats, Capital –E, May 2010
10. Study/ Bo o k Spo nso rs
American Council On Renewable Energy
American Institute of Architects
American Public Health Association
BOMA International
Enterprise Community Partners
Federation of American Scientists
National Association of State Energy Officials
National Association of Realtors
Real Estate Roundtable
US Green Building Council
World Green Building Council
Greg Kats, Capital –E, May 2010
11. Co st o f Building Green
Additional cost to build green:
Evidence from 146 green buildings
60
# of buildings in data set
50 Median in the
Public
data set: <2%
misperception:
added cost
40 17% added cost*
30
20
10
0
1%
2%
3%
4%
5%
6%
7%
8%
9%
10 %
11 %
12 %
13 %
15 %
16 %
17 %
18 %
9%
10
1
2
3
4
6
7
8
0-
1-
2-
3-
4-
5-
6-
7-
8-
-1
-1
-1
-1
-1
-1
-1
-1
9-
*2007 opinion survey by World Business C ouncil for
Sustainable Development Range of reported premiums
Greg Kats, Capital –E, May 2010
12. Green Building Co st Premium
Green premium frequency by LEED level
number of buildings in data
90
80
70
60 certified
50
set
silver
40 gold
30 platinum
20
10
0
2%
4%
6%
8%
2%
4%
6%
8%
%
10
0-
2-
4-
6-
-1
-1
-1
-1
8-
10
12
14
16
range of reported premiums
Greg Kats, Capital –E, May 2010
13. G reen Building Benefit s:
Increased Rent , Sales & O ccupancy
LEED Certified
1st Quarter 2008 Non-LEED Offices Difference % Change
Occupancy rates 88% 92% 4% 5%
Rent ($/SF) $31 $42 $11 35%
Property value ($/SF) $267 $438 $171 64%
1st Quarter 2008 Non-Energy star Energy Star Offices Difference % Change
Occupancy Rates 88% 92% 4% 5%
Rent ($/SF) $28 $31 $3 11%
Sale Price ($/SF) $227 $288 $61 27%
Source: CoStar analysis, 2008
Greg Kats, Capital –E, May 2010
14. Co sts and Benefits
Costs and Benefits of Green Buildings:
Present value of 20 years of estimated impacts based on study data
set collected from recent green buildings
Green School Green Office
$12
increased building cost
$10
water savings
$8 direct energy savings
$/Sf
$6
$4
Additional benefits
$2 not estimated:
+Productivity and student
$0 performance
+Property Value impacts
t
t
nt
nt
+Indirect water systems
os
os
a
a
lc
lc
up
up impacts
a
a
cc
cc
on
on
+Brand
/o
/o
ti
ti
r
r
di
di
ne
ne
+Operations and
ad
ad
ow
ow
Maintenance savings
o
o
t
t
+Embodied energy savings
it
it
f
f
ne
ne
be
be
Greg Kats, Capital –E, May 2010
15. Costs and Benefits of Green Buildings: Present value of 20
years of estimated impacts based on study data set and
synthesis of relevant research*
Green School Green Office
$18 increased building cost
$16 health
water savings
$14
energy savings
$12
indirect energy savings
$10
$/Sf
employment
$8 emissions
$6
$4 Additional benefits not
estimated:
$2 +Productivity and student
$0 performance
+Property value impacts
t
t
y
y
an
an
t
t
os
os
+Indirect water systems
et
et
p
p
ci
ci
lc
lc
cu
cu
so
so
impacts
na
na
c
c
/o
/o
to
to
tio
tio
+Brand improvements
r
r
fit
fit
ne
ne
di
di
ne
ne
+Operations and
ad
ad
ow
ow
be
be
maintenance savings
to
to
fit
fit
+Embodied energy savings
ne
ne
be
be
*There is significantly greater uncertainty, and less consensus around
methodologies for estimating health and societal benefits.
Greg Kats, Capital –E, May 2010
17. Brand Impact o f Greening
Gr eening Impacts: Thr ee Sources of
Br and Equity
• Increased brand awareness (e.g., free media
exposure)
• Greater preference due to specific attributes
(e.g., better IEQ)
• General non-attribute preference (e.g.,
association with quality, lower risk)
Greg Kats, Capital –E, May 2010
18. Advanced energy savings and green premium:
18 buildings from the study data set
140% 14%
120% 12%
% energy use reduction
energy
% green premium
100% 10% savings
(yellow bars
80% 8% indicate the
use of
60% 6% onsite
renewables)
40% 4%
green
premium
20% 2%
0% 0%
1 2 3 4 5 6 7 8 9 10 11 12 13 14 15 16 17 18
Building ID #
Greg Kats, Capital –E, May 2010
19. Po t e nt ial Value O f 2 0 Ye ars O f CO 2 Re duc t io ns
in G re e n v. Co nve nt io nal Building s
Potential value of CO2 reduction in green offices
25
NPV of 20 yrs of reduction ($/sf)
20
15
Value of CO2 reduction
Indirect Energy price impact
Direct energy savings
10
5
0
$5 $30 $100
CO2 price pe r ton
Greg Kats, Capital –E, May 2010
20. Califo rnia Energ y Co st Driven By
St andard A / C
Standard Air Conditioner KW vs. TDV "total cost"
8 45
7 40
35
6
30
24 Hour Total TDV "Cost" = 72
5
KW Demand
TDV "Cost"
25
4
20
3
15
2
10
1 5
0 0
12:00 AM 6:00 AM 12:00 PM 6:00 PM
Time of Day
Standard KW TDV Weight
Greg Kats, Capital –E, May 2010
21. The Co st o f Meeting the Peak
Greg Kats, Capital –E, May 2010
25. Rapid Cle ae nt e c h Inve st me nt Inc re ase Re quire d
180 Total Global New Clean Energy Investment Estimated Clean Energy Annual Investment to 2030,
160 US$ Billions
600
140 5% 542
Growth 515
Amounts ($ Billions)
500
120
4oc
Amounts ($ Billions)
59%
100 Growth 400 379 2.5oc
2oc
80
300
58%
60 Growth 229
200
40
68%
20 Growth 100
0
0
2004 2005 2006 2007 2008
WEO 2008 - Reference WEO 2008 - 550ppm NEF Global Futures WEO 2008 - 450ppm
2008
~x c Equivalent increase in global temperature per scenario
Shortfall is potentially in excess of $350 billion per year
Source: IEA WEO 2008, New Energy Finance
Greg Kats, Capital –E, May 2010 25
26. G lo bal Cleant ech Invest ment Landscape
Greg Kats, Capital –E, May 2010
27. G lo bal Cleant ech St imulus Co mpo nent s
Greg Kats, Capital –E, May 2010
28. What is yo ur invest ment t hesis?
Common view is: Big problem, one grid, national issues (security,
trade deficit, employment, global warming)
So assumption is: centralized answer eg nuclear, coal CCS
But slow, uncertain and v costly
Real solution is opposite. Its decentralized, ie telephony and IT
We have the technologies.. We need to scale and deploy them
No silver bullet.. lots of technologies and niches
Greg Kats, Capital –E, May 2010
29. So me Dubio us Invest ment Theses
Five 9s/ reliability.. microturbines, flywheels
Benefits must be real and cheaper than alternatives
Hydrogen/fuel cells..
Infrastructure threshold
Environmental math must work
Ethanol.. Do the math on energy, politics of food to fuel
Nanotechnology? Ca. $1 billion in 1000 firms. Over-
investment, exits?
Greg Kats, Capital –E, May 2010
30. Perfo rmance Co mpariso n
0.60 Tinted
0.50
Low-e2
0.40
Solar Heat Gain Coefficient
0.30 Tinted Low-e2
0.20 Reflective
0.10
0.00
10% 20% 30% 40% 50% 60% 70% 80%
Visible Light Transmission
Greg Kats, Capital –E, May 2010
31. FERC REPO RT: Demand Respo nse Po t ent ial
source: FERC Assessment of Demand
Response & Advanced Metering 2009
assumptions: smart meters, dynamic pricing
default, enabling technologies
Greg Kats, Capital –E, May 2010
32. Ice Bear® Distributed Energy Storage
6 hour on peak resource
Insulates Utility Assets From Hot Weather Related Events
Low Capacity Factor High Capacity Factor
Greg Kats, Capital –E, May 2010
33. Lo w Co st & Po we r De nsit y : Bro adSt ar Wind
The AeroCam Type I turbine is a low-noise, low vibration 12kW cycloidial turbine that can be deployed on a
rooftop or ground mounted at point of use
• Unlike many small wind systems, self-starting The AeroCam’s technological advantage is that it maximizes
aerodynamic lift forces that provide driving torque and power production
Superior power density in relation to other distributed generation turbines and solar PV
Power Density = Amount of Power Produced X Length of Turbine’s Frontal Cross Section
• Footprint of AeroCam turbine is 1/4 that of a same-sized solar array
Greg Kats, Capital –E, May 2010
34. CO 2 Impact
1990 Building CO2
Green Scenario Emissions Emissions
With Additional Policy Actions
BAU CO2 Emissions
3500
3000
Green - Efficiency
2500 and All Renewables
(50% offsite
MMT CO2
2000 reduction)
Green - Efficiency and
1500 Renewables (Full)
1000
Green - Greener
500 Conventional Energy
Supply
0
Obama Administration
2010 2015 2020 2025 2030 2035 2040 2045 2050 Goal
Greg Kats, Capital –E, May 2010
35. G reening = Wealt h and Jo bs Creat io n
NPV of Net Benefits of BAU and Green
$1,200
$1,000
$800
BAU
$600 Green
Billions
$400
$200
$0
Green NPV only Plus Plus Plus Plus
($200) Premium direct w ater health societal societal
energy energy CO2
($400)
Greg Kats, Capital –E, May 2010
36. Fo r mo re Info rmat io n:
• www.islandpress.org/Kats
• Greening Our Built World is on
Amazon (please write a 5 star
review!!!)
• www.goodenergies.com
Thank you
Greg Kats, Capital –E, May 2010