MRKS&P
- 1. Stock Report | February 18, 2012 | NYS Symbol: MRK | MRK is in the S&P 500
Merck & Co Inc.
S&P Recommendation BUY
55555 Price
$38.56 (as of Feb 17, 2012)
12-Mo. Target Price
$42.00
Investment Style
Large-Cap Blend
UPDATE: PLEASE SEE THE ANALYST'S LATEST RESEARCH NOTE IN THE COMPANY NEWS SECTION
GICS Sector Health Care Summary This company, one of the world's largest drugmakers, acquired Schering-Plough
Sub-Industry Pharmaceuticals in November 2009 for about $41 billion in cash and stock.
Key Stock Statistics (Source S&P, Vickers, company reports)
52-Wk Range $39.43– 29.47 S&P Oper. EPS 2012E 3.85 Market Capitalization(B) $117.528 Beta 0.67
Trailing 12-Month EPS $2.02 S&P Oper. EPS 2013E 3.75 Yield (%) 4.36 S&P 3-Yr. Proj. EPS CAGR(%) 5
Trailing 12-Month P/E 19.1 P/E on S&P Oper. EPS 2012E 10.0 Dividend Rate/Share $1.68 S&P Credit Rating AA
$10K Invested 5 Yrs Ago $10,796 Common Shares Outstg. (M) 3,047.9 Institutional Ownership (%) 73
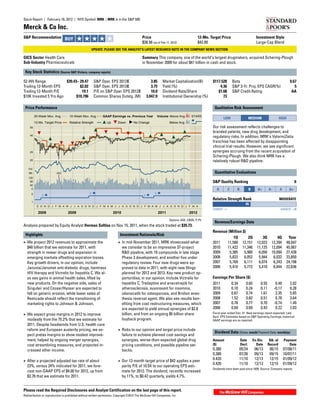
Price Performance Qualitative Risk Assessment
30-Week Mov. Avg. 10-Week Mov. Avg. GAAP Earnings vs. Previous Year Volume Above Avg. STARS
LOW MEDIUM HIGH
12-Mo. Target Price Relative Strength Up Down No Change Below Avg.
50 Our risk assessment reflects challenges to
branded patents, new drug development, and
40
regulatory risks. In addition, MRK's Vytorin/Zetia
franchise has been affected by disappointing
clinical trial results. However, we see significant
25 synergies accruing from the recent acquisition of
Schering-Plough. We also think MRK has a
20 relatively robust R&D pipeline.
Vol.
Mil. 243 Quantitative Evaluations
120
80 S&P Quality Ranking B
40
0 D C B- B B+ A- A A+
5 4 4
3 3
Relative Strength Rank MODERATE
1
45
S O N D J F M A M J J A S O N D J F M A M J J A S O N D J F M A M J J A S O N D J F M A
LOWEST = 1 HIGHEST = 99
2008 2009 2010 2011 2012
Options: ASE, CBOE, P, Ph
Revenue/Earnings Data
Analysis prepared by Equity Analyst Herman Saftlas on Nov 15, 2011, when the stock traded at $35.73.
Revenue (Million $)
Highlights Investment Rationale/Risk
1Q 2Q 3Q 4Q Year
® We project 2012 revenues to approximate the ® In mid-November 2011, MRK showcased what 2011 11,580 12,151 12,022 12,294 48,047
$48 billion that we estimate for 2011, with we consider to be an impressive 37-project 2010 11,422 11,346 11,125 12,094 45,987
strength in newer drugs and expansion in R&D pipeline, with 19 compounds in late stage 2009 5,385 5,900 6,050 10,094 27,428
emerging markets offsetting expiration losses. Phase 3 development, and another five under 2008 5,822 6,052 5,944 6,032 23,850
Key growth drivers, in our opinion, include regulatory review. Four new drugs were ap- 2007 5,769 6,111 6,074 6,243 24,198
Januvia/Janumet anti-diabetic drugs, Isentress proved to date in 2011, with eight new filings 2006 5,410 5,772 5,410 6,044 22,636
HIV therapy and Victrelis for hepatitis C. We al- planned for 2012 and 2013. Key new product op-
so see gains in animal health sales, lifted by portunities, in our opinion, include Victrelis for Earnings Per Share ($)
new products. On the negative side, sales of hepatitis C, Tredaptive and anacetrapib for 2011 0.34 0.65 0.55 0.49 2.02
Singulair and Cozaar/Hyzaar are expected to atherosclerosis, suvorexant for insomnia, 2010 0.10 0.24 0.11 -0.17 0.28
fall on generic erosion, while lower sales of odanacatib for osteoporosis, and Bridion anes- 2009 0.67 0.74 1.61 2.35 5.65
Remicade should reflect the transitioning of thesia reversal agent. We also see results ben- 2008 1.52 0.82 0.51 0.78 3.64
marketing rights to Johnson & Johnson. efiting from cost restructuring measures, which 2007 0.78 0.77 0.70 -0.74 1.49
are expected to yield annual synergies of $2.8 2006 0.69 0.69 0.43 0.22 2.03
® We expect gross margins in 2012 to improve billion, and from an ongoing $5 billion share Fiscal year ended Dec. 31. Next earnings report expected: Late
April. EPS Estimates based on S&P Operating Earnings; historical
modestly from the 75.2% that we estimate for buyback program. GAAP earnings are as reported.
2011. Despite headwinds from U.S. health care
reform and European austerity pricing, we ex- ® Risks to our opinion and target price include
Dividend Data (Dates: mm/dd Payment Date: mm/dd/yy)
pect pretax margins to show modest improve- failure to achieve planned cost savings and
ment, helped by ongoing merger synergies, synergies, worse-than-expected global drug Amount Date Ex-Div. Stk. of Payment
cost streamlining measures, and projected in- pricing conditions, and possible pipeline set- ($) Decl. Date Record Date
creased other income. backs. 0.380 05/24 06/13 06/15 07/08/11
0.380 07/26 09/13 09/15 10/07/11
0.420 11/10 12/13 12/15 01/09/12
® After a projected adjusted tax rate of about ® Our 12-month target price of $42 applies a peer
0.420 11/10 12/13 12/15 01/09/12
23%, versus 24% indicated for 2011, we fore- parity P/E of 10.5X to our operating EPS esti-
Dividends have been paid since 1935. Source: Company reports.
cast non-GAAP EPS of $4.00 for 2012, up from mate for 2012. The dividend, recently increased
$3.76 that we estimate for 2011. by 11%, to $0.42 quarterly, yields 4.7%.
Please read the Required Disclosures and Analyst Certification on the last page of this report.
Redistribution or reproduction is prohibited without written permission. Copyright ©2012 The McGraw-Hill Companies, Inc.
- 2. Stock Report | February 18, 2012 | NYS Symbol: MRK
Merck & Co Inc.
Business Summary November 15, 2011 Corporate Information
CORPORATE OVERVIEW. Merck & Co. is a leading global drugmaker, producing a wide range of prescrip- Investor Contact
tion drugs in many therapeutic classes in the U.S. and abroad. Foreign operations accounted for 55% of to- G. Bell (908-423-5185)
tal sales in 2010. In early November 2009, MRK acquired rival drugmaker Schering-Plough for about $41 bil-
lion in cash and stock.
Office
MRK's largest-selling products include Singulair (sales of $5.0 billion in 2010), a treatment for asthma and One Merck Drive, PO Box 100, Whitehouse
seasonal allergic rhinitis; Januvia/Janumet ($3.3 billion), treatments for type 2 diabetes; Cozaar/Hyzaar Station, NJ 08889-0100.
($2.1 billion), treatments for high blood pressure and congestive heart failure; Fosamax ($926 million), a
drug for osteoporosis (a bone-thinning disease that affects postmenopausal women); and Isentress ($1.1 Telephone
billion) treatment for HIV/AIDS. 908-423-1000.
Merck is also a leading maker of vaccines, which accounted for 8.9% of human health sales in 2010. Key Fax
vaccines include ProQuad ($1.4 billion) for measles, mumps, rubella and chicken pox; Gardasil ($988 mil- 908-298-7082.
lion) for human papillomavirus, the main cause of cervical cancer; and RotaTeq for rotavirus.
Website
With the purchase of Schering-Plough, Merck gained total rights to Zetia -- a cholesterol therapy that http://www.merck.com
works by blocking cholesterol absorption in the intestines -- as well as Vytorin, a combination pill contain-
ing both Zocor and Zetia. In 2010, Vytorin had sales of $2.0 billion, and Zetia had sales of $2.2 billion. Animal
health products (sales of $2.9 billion) comprise anti-infective and antiparasitic drugs and related items; and Officers
consumer care products ($1.7 billion) include OTC brands such as Claritin for allergies, Dr. Scholl's foot
Chrmn, Pres & CEO EVP & CIO
care products, and Coppertone suntan lotion. Through a venture with AstraZeneca, Merck books sales of
K.C. Frazier J.C. Scalet
Nexium and other drugs.
MARKET PROFILE. The dollar value of the global drug market is projected to grow 5%-7% in 2011, to $880 EVP & CFO SVP, Chief Acctg
billion, versus the indicated gain of 4%-5% in 2010, according to IMS Health. The key driver should be P.N. Kellogg Officer & Cntlr
emerging markets, whose aggregate sales (17 countries) should advance 15%-17% in 2011. Growth in de- J. Canan
veloping markets is being spurred by rising standards of living and rising government spending on health EVP & General
care. However, IMS forecasts much slower growth for developed nations, with combined growth for five Counsel
major European markets projected at 1%-3% for 2011, while pharmaceutical sales in the U.S. are estimated B.N. Kuhlik
to increase 3%-5%.
IMPACT OF MAJOR DEVELOPMENTS. Adjusted R&D expenses totaled $8.1 billion in 2010 (equal to 17.7% Board Members
of sales). MRK's R&D pipeline as of November 2011 included 24 products in late stage clinical trials or un- L. A. Brun
der regulatory review. Key pipeline opportunities, in our opinion, include Tredaptive and anacetrapib for T. R. Cech
atherosclerosis, suvorexant for insomnia, odanacatib for osteoporosis, and Bridion for neuromuscular K. C. Frazier
blockade reversal. The merger with Schering-Plough is expected to yield annual cost synergies of close to T. H. Glocer
$3.5 billion by the end of 2012, with over $2.8 billion to be realized in 2011. S. F. Goldstone
W. B. Harrison, Jr.
LEGAL/REGULATORY ISSUES. In September 2004, Merck voluntarily removed its widely used Vioxx treat-
H. R. Jacobson
ment for pain and arthritis from the market after studies showed increased cardiovascular risks with the
W. N. Kelley
drug. During 2009, MRK completed the payment of $4.85 billion into settlement funds, covering the majority
C. R. Kidder
of Vioxx cases. In April 2011, Merck and Johnson & Johnson agreed to settle arbitration litigation over
R. B. Lazarus
rights to Remicade and Simponi treatments for inflammatory diseases. The settlement provided for Merck
to pay Johnson & Johnson $500 million, and for the firms to divide foreign distribution rights on Remicade C. E. Represas
and Simponi. P. F. Russo
A. M. Tatlock
FINANCIAL TRENDS. The $41.1 billion acquisition of Schering-Plough was funded through cash of about C. B. Thompson
$9.8 billion, debt of $8.5 billion, and Merck stock of some $22.8 billion. In early February 2011, MRK with- W. P. Weeks
drew its previous long-term non-GAAP EPS guidance for a compound annual growth rate (CAGR) in the P. C. Wendell
high single digits over the 2009-2013 period. We believe a clinical setback on vorapaxar R&D heart drug
was a factor in the guidance removal. In late October 2011, MRK forecast non-GAAP EPS for 2011 in the
$3.72-$3.76 range. In April 2011, MRK announced a new board authorization to repurchase up to $5 billion Domicile
of its common stock, bringing its total buyback program to $6.4 billion. New Jersey
Founded
1891
Employees
94,000
Stockholders
170,300
Redistribution or reproduction is prohibited without written permission. Copyright ©2012 The McGraw-Hill Companies, Inc.
- 3. Stock Report | February 18, 2012 | NYS Symbol: MRK
Merck & Co Inc.
Quantitative Evaluations Expanded Ratio Analysis
S&P Fair Value 4+ 1 2 3 4 5 2011 2010 2009 2008
Rank LOWEST HIGHEST Price/Sales NA 2.45 3.03 2.73
Based on S&P's proprietary quantitative model, stocks are ranked Price/EBITDA NA 9.30 11.73 8.30
from most overvalued (1) to most undervalued (5). Price/Pretax Income NA 68.02 5.43 6.65
P/E Ratio NA NM 6.44 8.35
Fair Value $40.00 Analysis of the stock's current worth, based on S&P's proprietary Avg. Diluted Shares Outstg (M) NA 3,120.0 2,273.2 2,145.3
quantitative model suggests that MRK is slightly undervalued by
Calculation $1.44 or 3.7%. Figures based on calendar year-end price
Investability 97 Key Growth Rates and Averages
Quotient LOWEST = 1 HIGHEST = 100
Percentile MRK scored higher than 97% of all companies for which an S&P Past Growth Rate (%) 1 Year 3 Years 5 Years 9 Years
Report is available.
Sales 4.48 29.93 18.12 3.41
Net Income NM -28.16 -4.68 -5.88
Volatility LOW AVERAGE HIGH
Ratio Analysis (Annual Avg.)
Technical BULLISH Since October, 2011, the technical indicators for MRK have been Net Margin (%) 13.30 20.74 21.70 22.64
BULLISH. % LT Debt to Capitalization NA NA 18.07 19.27
Evaluation
Insider Activity UNFAVORABLE NEUTRAL FAVORABLE
Company Financials Fiscal Year Ended Dec. 31
Per Share Data ($) 2011 2010 2009 2008 2007 2006 2005 2004 2003 2002
Tangible Book Value NA 2.09 1.97 7.97 11.76 7.00 7.48 7.03 6.13 4.88
Cash Flow NA 2.41 6.65 4.30 2.19 3.06 2.88 3.29 3.51 3.79
Earnings 2.02 0.28 5.65 3.64 1.49 2.03 2.10 2.61 2.92 3.14
S&P Core Earnings NA 0.36 2.61 2.78 2.85 2.28 2.09 2.56 2.71 2.81
Dividends 1.98 1.52 1.52 1.52 1.52 1.52 1.52 1.49 1.45 1.41
Payout Ratio 98% NM 27% 42% 102% 75% 72% 57% 50% 45%
Prices:High 37.90 41.56 38.42 61.18 61.62 46.37 35.36 49.33 63.50 64.50
Prices:Low 29.47 30.70 20.05 22.82 42.35 31.81 25.50 25.60 40.57 38.50
P/E Ratio:High 19 NM 7 17 41 23 17 19 22 21
P/E Ratio:Low 15 NM 4 6 28 16 12 10 14 12
Income Statement Analysis (Million $)
Revenue 48,047 45,987 27,428 23,850 24,198 22,636 22,012 22,939 22,486 51,790
Operating Income 17,398 12,088 7,081 7,854 7,779 5,955 7,567 8,074 9,912 11,361
Depreciation NA 6,532 2,227 1,415 1,528 2,268 1,708 1,451 1,314 1,488
Interest Expense 749 715 458 251 384 375 386 294 351 391
Pretax Income 7,334 1,653 15,292 9,808 3,492 6,342 7,486 8,129 9,220 10,428
Effective Tax Rate 12.8% 40.6% 14.8% 20.4% 2.73% 28.2% 36.5% 26.6% 26.7% 29.3%
Net Income 6,392 861 12,901 7,808 3,275 4,434 4,631 5,813 6,590 7,150
S&P Core Earnings NA 1,093 5,936 5,958 6,255 4,973 4,582 5,699 6,089 6,395
Balance Sheet & Other Financial Data (Million $)
Cash NA 12,201 9,605 5,486 8,231 5,915 9,585 2,879 1,201 2,243
Current Assets NA 29,064 28,429 19,305 15,045 15,230 21,049 13,475 11,527 14,834
Total Assets NA 105,781 112,090 47,196 48,351 44,570 44,846 42,573 40,588 47,561
Current Liabilities NA 15,641 15,751 14,319 12,258 12,723 13,304 11,744 9,570 12,375
Long Term Debt NA 15,489 16,075 3,943 3,916 5,551 5,126 4,692 5,096 4,879
Common Equity NA 54,376 59,058 18,758 18,185 17,560 17,917 17,288 15,576 18,200
Total Capital NA 76,223 78,316 25,118 24,903 25,517 25,449 24,387 24,588 28,008
Capital Expenditures NA 1,678 1,461 1,298 1,011 980 1,403 1,726 1,916 2,370
Cash Flow NA 7,514 15,127 9,223 4,803 6,702 6,339 7,264 7,904 8,638
Current Ratio NA 1.9 1.8 1.4 1.2 1.2 1.6 1.1 1.2 1.2
% Long Term Debt of Capitalization Nil 20.3 Nil 15.5 15.7 21.8 20.1 19.2 20.7 17.4
% Net Income of Revenue 13.3 1.9 47.0 32.7 13.5 19.6 21.0 25.3 29.3 13.8
% Return on Assets NA NA NA 16.3 7.1 9.9 10.6 14.0 15.0 15.6
% Return on Equity NA NA NA 42.3 18.3 25.0 26.3 35.4 39.0 41.7
Data as orig reptd.; bef. results of disc opers/spec. items. Per share data adj. for stk. divs.; EPS diluted. E-Estimated. NA-Not Available. NM-Not Meaningful. NR-Not Ranked. UR-Under Review.
Redistribution or reproduction is prohibited without written permission. Copyright ©2012 The McGraw-Hill Companies, Inc.
- 4. Stock Report | February 18, 2012 | NYS Symbol: MRK
Merck & Co Inc.
Sub-Industry Outlook Stock Performance
Our fundamental outlook for the pharmaceuticals We see a large number of major drugs losing patent GICS Sector: Health Care
sub-industry for the next 12 months is neutral. protection over the next few years, providing Sub-Industry: Pharmaceuticals
Although the sector faces significant top-line significant opportunities for this group. We also look
pressure this year from patent expirations on many for generics to benefit from the new health care Based on S&P 1500 Indexes
top-selling drugs, we believe overall industry profits reform legislation. We favor companies with rich Month-end Price Performance as of 01/31/12
should hold up relatively well, helped by expanding generic pipelines, especially those with first-to-file
sales of new innovative drug therapies and margin generics with the potential for 180 days of marketing
improvements accruing from cost restructurings exclusivity, and competence in litigating complex 120
and merger synergies. EPS comparisons should also patent issues.
benefit from common share buybacks.
100
--Herman B. Saftlas
While we think recent health care reform legislation
will negatively affect industry profitability over the
next two years, we see eventual benefits accruing 80
from significant expansion of the market, with new
coverage potentially being provided to 32 million
currently uninsured Americans. We favor the shares 60
of firms with well defined growth prospects and
generous dividend yields, as we believe they should
perform relatively well over the coming quarters. 40
Despite near-term patent expirations and regulatory
20
pressures on drug pricing, we still think long-term
prospects for the sector remain favorable.
Pharmaceuticals remains one of the widest-margin
0
U.S. industries, with prospects enhanced by
demographic growth in the elderly (which account 2008 2009 2010 2011 2012
for about 33% of industry sales) and new drugs
stemming from discoveries in genomics and Sub-Industry Sector S&P 1500
biotechnology. We expect FDA approvals of new
molecular entities in 2012 to approximate the 30
approved in 2011, which was well above the 21 NOTE: All Sector & Sub-Industry information is based on the
Global Industry Classification Standard (GICS)
cleared in 2010.
Year to date through January 20, the S&P
Pharmaceuticals Index was flat, versus a 4.7%
advance in the S&P 1500 Composite Index. In 2011,
the sub-industry index was up 13.9%, while the 1500
fell 0.3%. We expect prospects for the
generic/specialty drug sector to remain favorable.
Sub-Industry : Pharmaceuticals Peer Group*: Ethical Pharmaceuticals - Major
Stk.Mkt. Recent 52 Fair S&P Return on LTD to
Stock Cap. Stock Week Yield P/E Value Quality IQ Revenue Cap
Peer Group Symbol (Mil. $) Price($) High/Low($) Beta (%) Ratio Calc.($) Ranking %ile (%) (%)
Merck & Co MRK 117,528 38.56 39.43/29.47 0.67 4.4 19 40.00 B 97 13.3 NA
AstraZeneca ADS AZN 60,089 45.18 52.54/40.89 0.62 6.2 6 49.20 NR 95 24.2 28.0
Forest Labs FRX 8,505 32.03 40.52/28.47 0.68 Nil 8 NA B 94 23.8 NA
GlaxoSmithKline plc ADS GSK 111,549 44.88 46.50/36.39 0.61 5.0 22 43.20 NR 89 6.5 58.3
Lilly (Eli) LLY 45,454 39.26 42.03/33.46 0.71 5.0 10 NA B 99 17.9 NA
Novartis AG ADS NVS 136,874 56.59 64.82/51.60 0.54 3.7 13 60.80 NR 92 19.0 15.5
Novo-Nordisk A/S ADS NVO 77,808 138.08 139.83/94.58 0.53 1.3 26 116.20 NR 96 23.7 1.4
Pfizer, Inc PFE 162,887 21.19 22.17/16.63 0.72 4.2 17 23.70 B+ 62 13.0 NA
Sanofi ADS SNY 99,804 37.18 40.75/30.98 0.89 4.0 15 41.60 NR 92 17.9 11.1
NA-Not Available NM-Not Meaningful NR-Not Rated. *For Peer Groups with more than 15 companies or stocks, selection of issues is based on market capitalization.
Source: S&P.
Redistribution or reproduction is prohibited without written permission. Copyright ©2012 The McGraw-Hill Companies,Inc.
- 5. Stock Report | February 18, 2012 | NYS Symbol: MRK
Merck & Co Inc.
S&P Analyst Research Notes and other Company News
February 10, 2012 October 7, 2011
Merck & Co. Inc. announced that Thomas E. Shenk, Ph.D., has decided to retire Merck & Co. Inc. announced that Chairman and former CEO Richard Clark will
from its board of directors, effective February 8, 2012. Dr.#Shenk is leaving the retire from the company December 1, 2011 after nearly 40 years at the company.
board to focus on the new company he is forming to commercialize discoveries Kenneth Frazier, who replaced Clark as CEO in January, will become chairman of
made in his Princeton University laboratory in the area of antiviral therapeutics. Merck & Co. Inc. after Clark retires. Clark was president and CEO of Merck from
Dr.#Shenk has been Elkins Professor in the Department of Molecular Biology at 2005 to 2010, and he has been chairman of the board since 2007. The company
Princeton University since 1984. He served as the department's chairman from said Clark is retiring following Frazier's successful transition.
1996 to 2004. Dr.#Shenk joined Merck's board in 2001.
September 28, 2011
February 2, 2012 Merck & Co. Inc. announced the appointment of Cuong Viet Do as chief strategy
09:54 am ET ... S&P REITERATES BUY OPINION ON SHARES OF MERCK (MRK officer, effective October 3, 2011. As chief strategy officer, Do, 45, will be
38.14****): Q4 EPS climbed 10% to $0.97 (matching our estimate), largely on gross responsible for both developing and executing enterprise-wide strategy and
margin expansion and reduced R&D. Sales rose 1.7%, with robust growth in the further building connections between the current and future business plans of
Januvia/Janumet diabetes franchise more than offsetting declines in other lines. Merck's franchises, divisions, and functions. He will report to Kenneth C. Frazier,
Despite expected headwinds from negative forex, patent expiration on Singulair Merck's president and chief executive officer, and will serve on the company's
and lower equity income, we still project modest EPS growth this year, helped by Executive Committee. He succeeds Mervyn Turner, who retired from the
cost efficiencies and stock buybacks. We continue to see much promise in company this summer. Since 2009, Do served as senior vice president of
MRK's pipeline, with 19 compounds in late stage clinical trials. We keep our corporate strategy and business development at TE Connectivity, formerly Tyco
target price of $42. The dividend yields 4.4%. /H. Saftlas Electronics. Do currently sits on the board of WuXi AppTec, a pharmaceutical
R&D outsourcing company.
January 31, 2012
06:03 am ET ... S&P REITERATES BUY OPINION ON SHARES OF MERCK (MRK September 6, 2011
38.89****): Ahead of results expected Feb. 2, we maintain our Q4 EPS estimate of Merck has named Udit Batra as head of the consumer health care division. He
$0.97, which is $0.02 above the Capital IQ consensus, vs. the year-ago $0.88. Our succeeds Peter Shotter. Batra will report to Stefan Oschmann, executive board
estimate assumes stronger top line trends in several product lines, especially for member of Merck and responsible for the pharmaceutical business.
sales of its recently launched Victrelis hepatitis C drug, which should benefit from
a large VA contract. We continue to see much promise in MRK's pipeline, which
August 24, 2011
consists of 19 compounds in advanced Phase 3 clinical trials. We reiterate our
Merck & Co. Inc. announced the appointment of Richard R. DeLuca Jr. as
$42 target price, factoring a peer parity P/E of 10.8X our '12 EPS estimate. The
executive vice president and president, Merck Animal Health, effective
dividend yields 4.4%. /H. Saftlas
September 15, 2011. DeLuca, will report to Kenneth C. Frazier, Merck's president
and chief executive officer, and will serve on the company's Executive
November 10, 2011 Committee. He will succeed Raul Kohan, who has decided to retire from the
12:05 pm ET ... S&P REITERATES BUY OPINION ON SHARES OF MERCK (MRK company. Kohan will remain with the company until the end of 2011, reporting to
34.81****): MRK showcases R&D pipeline and raises its dividend by 11% to $0.42, Frazier, to ensure a smooth transition. As leader of Merck Animal Health, DeLuca
at today's business briefing. We believe MRK has an impressive R&D pipeline, will leverage the division's strong product portfolio and customer focus to
with 19 compounds in Phase 3 trials. Eight new filings are planned in '12 and '13. capitalize on new growth opportunities, including expanding the business in
Key new projects, in our opinion, are Tredaptive for atherosclerosis, suvorexant emerging markets. DeLuca served as chief financial officer of BD Biosciences
for insomnia, odanacatib for osteoporosis, and Bridion anesthetic. We think new since 2010.
drugs, cost restructurings and share buybacks should drive 7% EPS growth in '12,
despite the loss of patent protection on Singulair. We keep our $42 target price.
July 29, 2011
The dividend now yields 4.8%. /H. Saftlas
MRK posts $0.95 vs. $0.86 Q2 EPS on 7.1% sales rise. Capital IQ consensus
forecast $0.95. Raises lower end of its '11 non-GAAP EPS range to $3.68-$3.76,
October 28, 2011 revenue to grow in the low- to mid-single digit percent range from a base of $46B
MRK posts $0.94 vs. $0.85 Q3 non-GAAP EPS on 8.1% higher sales. S&P Capital IQ in '10. Also says it remains on track to achieve its goal of $3.5B in annual cost
consensus forecast was $0.91 EPS. For 2011, MRK ups the lower end of its synergies by the end of '12.
non-GAAP EPS guidance range and is now targeting a range of $3.72-$3.76. Now
expects 2011 revenue to grow in the mid-single digit percent range from a base of
$46.0B in 2010.
October 28, 2011
10:35 am ET ... S&P REITERATES BUY OPINION ON SHARES OF MERCK (MRK
34.75****): Q3 non-GAAP EPS increased 11% to $0.94, matching our estimate.
Sales grew 8% (5% from forex), with Januvia/Janumet diabetes drugs (sales up
41%), and Gardasil HPV vaccine (up 41%) notable outperformers. Although sales
of recently launched Victrelis hepatitis C drug were only $31M, we see a stronger
uptake evolving from a new VA contract and expansion overseas. Gardasil should
also benefit from entry into the male market. We see much promise in the R&D
pipeline, which MRK plans to showcase at an analyst meeting on Nov. 10. We
keep our target price of $42. Dividend yields 4.3%. /H. Saftlas
October 7, 2011
03:48 pm ET ... S&P REITERATES BUY OPINION ON SHARES OF MERCK (MRK
31.84****): FDA approves Juvisync, a combination of Merck's Januvia treatment
for type 2 diabetes and simvastatin statin cholesterol agent. While the American
Diabetes Assn. recommends statin therapy for all diabetics with cardiovascular
risk factors, MRK estimates that some 40% of that population is not being treated
with statins. Reflecting a boost from Juvisync, we project sales of MRK's
diabetes franchise to rise from $3.3B in '10 to over $7B in '16. We continue to see
new drugs, coupled with ongoing cost savings, driving EPS growth in the years
ahead. We keep our target price of $42. /H. Saftlas
Source: S&P.
Redistribution or reproduction is prohibited without written permission. Copyright ©2012 The McGraw-Hill Companies,Inc.
- 6. Stock Report | February 18, 2012 | NYS Symbol: MRK
Merck & Co Inc.
Analysts' Recommendations Wall Steet Consensus Opinion
Monthly Average Trend Buy Buy/Hold Hold Weak Hold Sell No Opinion MRK Trend BUY/HOLD
B BH H WH S
Wall Street Average Companies Offering Coverage
B
Over 30 firms follow this stock; not all firms are
BH
displayed.
H
Argus Research Company
WH
Atlantic Equities LLP
S
Axia Financial research
Number of Analysts Following Stock BMO Capital Markets, U.S. Equity Research
Barclays Capital
28 BofA Merrill Lynch
Citigroup Inc
24
Cowen and Company, LLC
20 Credit Agricole Securities (USA) Inc.
Credit Suisse
Daewoo Securities Co. Ltd.
Stock Price ($)
Daiwa Securities Capital Markets Co. Ltd.
40
Daiwa Securities America Inc.
Davenport & Company
36
Deutsche Bank
First Global Stockbroking (P) Ltd.
32
Goldman Sachs
Hilliard Lyons
28
M A M J J A S O N D J F M A M J J A S O N D J F
ISI Group Inc.
JP Morgan
2010 2011 2012
Jefferies & Company, Inc.
Leerink Swann LLC
Of the total 36 companies following MRK, 23 analysts currently publish recommendations.
MKM Partners LLC
Moody?s
No. of Ratings % of Total 1 Mo. Prior 3 Mos. Prior Morgan Stanley
Buy 10 43 11 11 Morningstar Inc.
Buy/Hold 6 26 8 9 Piper Jaffray Companies
Hold 7 30 6 5 S&P Equity Research
Weak Hold 0 0 0 0 Sanford C. Bernstein & Co., Inc.
Sell 0 0 0 0 Silvia Quandt Research GmbH
No Opinion 0 0 0 0
Total 23 100 25 25
Wall Street Consensus Estimates Wall Street Consensus vs. Performance
For fiscal year 2012, analysts estimate that MRK
Estimates 2011 2012 2013 2011 Actual $2.02 will earn $3.80. For fiscal year 2013, analysts
5 estimate that MRK's earnings per share will
decline by 2% to $3.73.
4
3
2 O N D J F M A M J J A S O N D J F
2010 2011 2012
Fiscal Years Avg Est. High Est. Low Est. # of Est. Est. P/E
2013 3.73 3.97 3.40 18 10.3
2012 3.80 3.89 3.61 20 10.1
2013 vs. 2012 -2% 2% -6% -10% 2%
Q1'13 0.89 0.89 0.89 2 43.3
Q1'12 1.02 1.12 0.95 14 37.8
Q1'13 vs. Q1'12 -13% -21% -6% -86% 15%
A company's earnings outlook plays a major part in any investment decision. Standard & Poor's organizes the earnings estimates of over 2,300
Wall Street analysts, and provides their consensus of earnings over the next two years. This graph shows the trend in analyst estimates over
the past 15 months.
Source: S&P, Capital IQ Estimates, Inc.
Redistribution or reproduction is prohibited without written permission. Copyright ©2012 The McGraw-Hill Companies,Inc.
- 7. Stock Report | February 18, 2012 | NYS Symbol: MRK
Merck & Co Inc.
Glossary is a relative ranking to the S&P U.S. STARS universe, and as an indicator of potential medium-to-long term return
should be reflective of risk factors related to a and as a caution against downside risk. The measure
company’s operations, as opposed to risk and volatility takes into account variables such as technical
S&P STARS
measures associated with share prices. indicators, earnings estimates, liquidity, financial ratios
Since January 1, 1987, Standard and Poor’s Equity
and selected S&P proprietary measures.
Research Services has ranked a universe of common
stocks based on a given stock’s potential for future Quantitative Evaluations
In contrast to our qualitative STARS recommendations, S&P's IQ Rationale:
performance. Under proprietary STARS (STock
which are assigned by S&P analysts, the quantitative Merck & Co
Appreciation Ranking System), S&P equity analysts rank
stocks according to their individual forecast of a stock’s evaluations described below are derived from Raw Score Max Value
future total return potential versus the expected total proprietary arithmetic models. These computer-driven Proprietary S&P Measures 36 115
return of a relevant benchmark (e.g., a regional index evaluations may at times contradict an analyst’s Technical Indicators 27 40
(S&P Asia 50 Index, S&P Europe 350 Index or S&P 500 qualitative assessment of a stock. One primary reason Liquidity/Volatility Measures 15 20
Index)), based on a 12-month time horizon. STARS was for this is that different measures are used to determine Quantitative Measures 57 75
designed to meet the needs of investors looking to put each. For instance, when designating STARS, S&P IQ Total 135 250
their investment decisions in perspective. Data used to analysts assess many factors that cannot be reflected in
assist in determining the STARS ranking may be the a model, such as risks and opportunities, management Volatility
result of the analyst’s own models as well as internal changes, recent competitive shifts, patent expiration, Rates the volatility of the stock’s price over the past year.
proprietary models resulting from dynamic data inputs. litigation risk, etc.
Technical Evaluation
S&P Quality Ranking In researching the past market history of prices and
S&P 12-Month Target Price Growth and stability of earnings and dividends are trading volume for each company, S&P’s computer
The S&P equity analyst’s projection of the market price a deemed key elements in establishing S&P’s Quality models apply special technical methods and formulas to
given security will command 12 months hence, based on Rankings for common stocks, which are designed to identify and project price trends for the stock.
a combination of intrinsic, relative, and private market capsulize the nature of this record in a single symbol. It
valuation metrics, including S&P Fair Value. Relative Strength Rank
should be noted, however, that the process also takes
Shows, on a scale of 1 to 99, how the stock has
into consideration certain adjustments and modifications
performed versus all other companies in S&P’s universe
Investment Style Classification deemed desirable in establishing such rankings. The
on a rolling 13-week basis.
Characterizes the stock as Growth or Value, and final score for each stock is measured against a scoring
indicates its capitalization level. Growth is evaluated matrix determined by analysis of the scores of a large
along three dimensions (earnings, sales and internal and representative sample of stocks. The range of Global Industry Classification Standard (GICS)
growth), while Value is evaluated along four dimensions scores in the array of this sample has been aligned with An industry classification standard, developed by
(book-to-price, cash flow-to-price, dividend yield and the following ladder of rankings: Standard & Poor's in collaboration with Morgan Stanley
sale-to-price). Growth stocks score higher than the Capital International (MSCI). GICS is currently comprised
market average on growth dimensions and lower on A+ Highest B Below Average of 10 Sectors, 24 Industry Groups, 68 Industries, and 154
value dimensions. The reverse is true for Value stocks. A High B- Lower Sub-Industries.
Certain stocks are classified as Blend, indicating a A- Above Average C Lowest
mixture of growth and value characteristics and cannot B+ Average D In Reorganization
be classified as purely growth or value. NR Not Ranked S&P Issuer Credit Rating
A Standard & Poor’s Issuer Credit Rating is a current
S&P Fair Value Rank opinion of an obligor’s overall financial capacity (its
S&P EPS Estimates
Using S&P's exclusive proprietary quantitative model, creditworthiness) to pay its financial obligations. This
Standard & Poor's earnings per share (EPS) estimates
stocks are ranked in one of five groups, ranging from opinion focuses on the obligor’s capacity and willingness
reflect analyst projections of future EPS from continuing
Group 5, listing the most undervalued stocks, to Group 1, to meet its financial commitments as they come due. It
operations, and generally exclude various items that are
the most overvalued issues. Group 5 stocks are expected does not apply to any specific financial obligation, as it
viewed as special, non-recurring, or extraordinary. Also,
to generally outperform all others. A positive (+) or does not take into account the nature of and provisions
S&P EPS estimates reflect either forecasts of S&P equity
negative (-) Timing Index is placed next to the Fair Value of the obligation, its standing in bankruptcy or liquidation,
analysts; or, the consensus (average) EPS estimate,
ranking to further aid the selection process. A stock with statutory preferences, or the legality and enforceability
which are independently compiled by Capital IQ, a data
a (+) added to the Fair Value Rank simply means that this of the obligation. In addition, it does not take into
provider to Standard & Poor's Equity Research. Among
stock has a somewhat better chance to outperform other account the creditworthiness of the guarantors, insurers,
the items typically excluded from EPS estimates are
stocks with the same Fair Value Rank. A stock with a (-) or other forms of credit enhancement on the obligation.
asset sale gains; impairment, restructuring or
has a somewhat lesser chance to outperform other The Issuer Credit Rating is not a recommendation to
merger-related charges; legal and insurance
stocks with the same Fair Value Rank. The Fair Value purchase, sell, or hold a financial obligation issued by an
settlements; in process research and development
rankings imply the following: 5-Stock is significantly obligor, as it does not comment on market price or
expenses; gains or losses on the extinguishment of debt;
undervalued; 4-Stock is moderately undervalued; 3-Stock suitability for a particular investor. Issuer Credit Ratings
the cumulative effect of accounting changes; and
is fairly valued; 2-Stock is modestly overvalued; 1-Stock are based on current information furnished by obligors or
earnings related to operations that have been classified
is significantly overvalued. obtained by Standard & Poor’s from other sources it
by the company as discontinued. The inclusion of some
considers reliable. Standard & Poor’s does not perform
items, such as stock option expense and recurring types
S&P Fair Value Calculation an audit in connection with any Issuer Credit Rating and
of other charges, may vary, and depend on such factors
The price at which a stock should trade at, according to may, on occasion, rely on unaudited financial
as industry practice, analyst judgment, and the extent to
S&P's proprietary quantitative model that incorporates information. Issuer Credit Ratings may be changed,
which some types of data is disclosed by companies.
both actual and estimated variables (as opposed to only suspended, or withdrawn as a result of changes in, or
actual variables in the case of S&P Quality Ranking). unavailability of, such information, or based on other
S&P Core Earnings Relying heavily on a company's actual return on equity, circumstances.
Standard & Poor's Core Earnings is a uniform the S&P Fair Value model places a value on a security
methodology for adjusting operating earnings by Exchange Type
based on placing a formula-derived price-to-book
focusing on a company's after-tax earnings generated ASE - American Stock Exchange; AU - Australia Stock
multiple on a company's consensus earnings per share
from its principal businesses. Included in the Standard & Exchange; BB - Bulletin Board; NGM - Nasdaq Global
estimate.
Poor's definition are employee stock option grant Market; NNM - Nasdaq Global Select Market; NSC -
expenses, pension costs, restructuring charges from Nasdaq Capital Markets; NYS - New York Stock
Insider Activity
ongoing operations, write-downs of depreciable or Exchange; OTN - Other OTC (Over the Counter); OTC -
Gives an insight as to insider sentiment by showing
amortizable operating assets, purchased research and Over the Counter; QB - OTCQB; QX - OTCQX; TS - Toronto
whether directors, officers and key employees who have
development, M&A related expenses and unrealized Stock Exchange; TXV - TSX Venture Exchange; NEX -
proprietary information not available to the general
gains/losses from hedging activities. Excluded from the NEX Exchange.
public, are buying or selling the company’s stock during
definition are pension gains, impairment of goodwill the most recent six months.
charges, gains or losses from asset sales, reversal of S&P Equity Research Services
prior-year charges and provision from litigation or Standard & Poor’s Equity Research Services U.S.
Funds From Operations FFO includes Standard & Poor’s Investment Advisory
insurance settlements. FFO is Funds from Operations and equal to a REIT's net Services LLC; Standard & Poor’s Equity Research
income, excluding gains or losses from sales of property, Services Europe includes McGraw-Hill Financial
Qualitative Risk Assessment plus real estate depreciation. Research Europe Limited trading as Standard & Poor’s;
The S&P equity analyst’s view of a given company’s Standard & Poor’s Equity Research Services Asia
operational risk, or the risk of a firm’s ability to continue Investability Quotient (IQ) includes Standard & Poor’s LLC’s offices in Singapore,
as an ongoing concern. The Qualitative Risk Assessment The IQ is a measure of investment desirability. It serves
Redistribution or reproduction is prohibited without written permission. Copyright © 2012 Standard & Poor's Financial Services LLC.
STANDARD & POOR’S, S&P, S&P 500, S&P Europe 350 and STARS are registered trademarks of Standard & Poor’s Financial Services LLC.
- 8. Stock Report | February 18, 2012 | NYS Symbol: MRK
Merck & Co Inc.
Standard & Poor’s Investment Advisory Services (HK) underperform the total return of a relevant benchmark
Limited in Hong Kong, Standard & Poor’s Malaysia Sdn over the coming 12 months, and the share price not the subscription fees or other compensation for services
Bhd, and Standard & Poor’s Information Services anticipated to show a gain. rendered by Standard & Poor's. A reference to a
(Australia) Pty Ltd. particular investment or security by Standard & Poor's
555551-STARS (Strong Sell): Total return is and one of its affiliates is not a recommendation to buy,
Abbreviations Used in S&P Equity Research Reports expected to underperform the total return of a relevant sell, or hold such investment or security, nor is it
CAGR- Compound Annual Growth Rate; CAPEX- Capital benchmark by a wide margin over the coming 12 months, considered to be investment advice.
Expenditures; CY- Calendar Year; DCF- Discounted Cash with shares falling in price on an absolute basis.
Flow; EBIT- Earnings Before Interest and Taxes; EBITDA- Indexes are unmanaged, statistical composites and their
Earnings Before Interest, Taxes, Depreciation and Relevant benchmarks: In North America the relevant returns do not include payment of any sales charges or
Amortization; EPS- Earnings Per Share; EV- Enterprise benchmark is the S&P 500 Index, in Europe and in Asia, fees an investor would pay to purchase the securities
Value; FCF- Free Cash Flow; FFO- Funds From Operations; the relevant benchmarks are generally the S&P Europe they represent. Such costs would lower performance. It
FY- Fiscal Year; P/E- Price/Earnings ; PEG Ratio- 350 Index and the S&P Asia 50 Index. is not possible to invest directly in an index.
P/E-to-Growth Ratio; PV- Present Value; R&D- Research
& Development; ROE- Return on Equity; ROI- Return on For All Regions: All of the views expressed in this Standard & Poor's and its affiliates provide a wide range
Investment; ROIC- Return on Invested Capital; ROA- research report accurately reflect the research analyst's of services to, or relating to, many organizations,
Return on Assets; SG&A- Selling, General & personal views regarding any and all of the subject including issuers of securities, investment advisers,
Administrative Expenses; WACC- Weighted Average securities or issuers. No part of analyst compensation broker-dealers, investment banks, other financial
Cost of Capital was, is, or will be directly or indirectly, related to the institutions and financial intermediaries, and accordingly
specific recommendations or views expressed in this may receive fees or other economic benefits from those
Dividends on American Depository Receipts (ADRs) and research report. organizations, including organizations whose securities
American Depository Shares (ADSs) are net of taxes or services they may recommend, rate, include in model
(paid in the country of origin). S&P Global Quantitative Recommendations Distribution portfolios, evaluate or otherwise address.
Required Disclosures In Europe: As of December 31, 2011, Standard & Poor's S&P Capital IQ and/or one of its affiliates has performed
Quantitative Services Europe recommended 49.0% of services for and received compensation from this
In contrast to the qualitative STARS recommendations issuers with buy recommendations, 19.0% with hold company during the past twelve months.
covered in this report, which are determined and recommendations and 30.0% with sell recommendations.
assigned by S&P equity analysts, S&P’s quantitative Disclaimers
evaluations are derived from S&P’s proprietary Fair In Asia: As of December 31, 2011, Standard & Poor's
Value quantitative model. In particular, the Fair Value Quantitative Services Asia recommended 43.8% of With respect to reports issued to clients in Japan and in
Ranking methodology is a relative ranking methodology, issuers with buy recommendations, 20.0% with hold the case of inconsistencies between the English and
whereas the STARS methodology is not. Because the recommendations and 33.0% with sell recommendations. Japanese version of a report, the English version
Fair Value model and the STARS methodology reflect prevails. With respect to reports issued to clients in
different criteria, assumptions and analytical methods, Globally: As of December 31, 2011, Standard & Poor's German and in the case of inconsistencies between the
quantitative evaluations may at times differ from (or even Quantitative Services globally recommended 44.0% of English and German version of a report, the English
contradict) an equity analyst’s STARS recommendations. issuers with buy recommendations, 20.0% with hold version prevails. Neither S&P nor its affiliates guarantee
As a quantitative model, Fair Value relies on history and recommendations and 34.0% with sell recommendations. the accuracy of the translation. Assumptions, opinions
consensus estimates and does not introduce an element Additional information is available upon request. and estimates constitute our judgment as of the date of
of subjectivity as can be the case with equity analysts in this material and are subject to change without notice.
assigning STARS recommendations. Past performance is not necessarily indicative of future
results.
S&P Global STARS Distribution Other Disclosures
In North America: As of December 31, 2011, research This report has been prepared and issued by Standard & Standard & Poor’s, its affiliates, and any third-party
analysts at Standard & Poor's Equity Research Services Poor's and/or one of its affiliates. In the United States, providers, as well as their directors, officers,
North America recommended 39.1% of issuers with buy research reports are prepared by Standard & Poor's shareholders, employees, or agents (collectively S&P
recommendations, 57.4% with hold recommendations Investment Advisory Services LLC ("SPIAS"). In the Parties) do not guarantee the accuracy, completeness or
and 3.5% with sell recommendations. United States, research reports are issued by Standard adequacy of this material, and S&P Parties shall have no
& Poor's ("S&P"); in the United Kingdom by McGraw-Hill liability for any errors, omissions, or interruptions therein,
In Europe: As of December 31, 2011, research analysts at Financial Research Europe Limited, which is authorized
Standard & Poor's Equity Research Services Europe regardless of the cause, or for the results obtained from
and regulated by the Financial Services Authority and the use of the information provided by the S&P Parties.
recommended 31.5% of issuers with buy trades as Standard & Poor's; in Hong Kong by Standard
recommendations, 50.6% with hold recommendations S&P PARTIES DISCLAIM ANY AND ALL EXPRESS OR
& Poor's Investment Advisory Services (HK) Limited, IMPLIED WARRANTIES, INCLUDING, BUT NOT LIMITED
and 17.9% with sell recommendations. which is regulated by the Hong Kong Securities Futures TO, ANY WARRANTIES OF MERCHANTABILITY,
Commission; in Singapore by Standard & Poor's LLC, SUITABILITY OR FITNESS FOR A PARTICULAR PURPOSE
In Asia: As of December 31, 2011, research analysts at
which is regulated by the Monetary Authority of OR USE. In no event shall S&P Parties be liable to any
Standard & Poor's Equity Research Services Asia
Singapore; in Malaysia by Standard & Poor's Malaysia party for any direct, indirect, incidental, exemplary,
recommended 43.8% of issuers with buy
Sdn Bhd ("S&PM"), which is regulated by the Securities compensatory, punitive, special or consequential
recommendations, 51.0% with hold recommendations
Commission; in Australia by Standard & Poor's damages, costs, expenses, legal fees, or losses
and 5.2% with sell recommendations.
Information Services (Australia) Pty Ltd ("SPIS"), which is (including, without limitation, lost income or lost profits
Globally: As of December 31, 2011, research analysts at regulated by the Australian Securities & Investments and opportunity costs) in connection with any use of the
Standard & Poor's Equity Research Services globally Commission; and in Korea by SPIAS, which is also information contained in this document even if advised of
recommended 38.3% of issuers with buy registered in Korea as a cross-border investment the possibility of such damages. Capital IQ is a business
recommendations, 55.7% with hold recommendations advisory company. of Standard & Poor's.
and 6.0% with sell recommendations.
The research and analytical services performed by
55555 5-STARS (Strong Buy): Total return is SPIAS, McGraw-Hill Financial Research Europe Limited,
S&PM, and SPIS are each conducted separately from Ratings from Standard & Poor’s Ratings Services are
expected to outperform the total return of a relevant statements of opinion as of the date they are expressed
benchmark, by a wide margin over the coming 12 any other analytical activity of Standard & Poor's.
and not statements of fact or recommendations to
months, with shares rising in price on an absolute basis. purchase, hold, or sell any securities or to make any
Standard & Poor's or an affiliate may license certain
intellectual property or provide pricing or other services investment decisions. Standard & Poor’s assumes no
55555 4-STARS (Buy): Total return is expected to obligation to update its opinions following publication in
outperform the total return of a relevant benchmark over to, or otherwise have a financial interest in, certain
issuers of securities, including exchange-traded any form or format. Standard & Poor’s ratings should not
the coming 12 months, with shares rising in price on an be relied on and are not substitutes for the skill,
absolute basis. investments whose investment objective is to
substantially replicate the returns of a proprietary judgment and experience of the user, its management,
employees, advisors and/or clients when making
55555 3-STARS (Hold): Total return is expected to Standard & Poor's index, such as the S&P 500. In cases
investment and other business decisions. Standard &
closely approximate the total return of a relevant where Standard & Poor's or an affiliate is paid fees that
are tied to the amount of assets that are invested in the Poor’s rating opinions do not address the suitability of
benchmark over the coming 12 months, with shares
fund or the volume of trading activity in the fund, any security. Standard & Poor’s does not act as a
generally rising in price on an absolute basis.
investment in the fund will generally result in Standard & fiduciary. While Standard & Poor’s has obtained
55555 2-STARS (Sell): Total return is expected to Poor's or an affiliate earning compensation in addition to information from sources it believes to be reliable,
Standard & Poor’s does not perform an audit and
Redistribution or reproduction is prohibited without written permission. Copyright © 2012 Standard & Poor's Financial Services LLC.
STANDARD & POOR’S, S&P, S&P 500, S&P Europe 350 and STARS are registered trademarks of Standard & Poor’s Financial Services LLC.