SlideShare une entreprise Scribd logo
1  sur  62
Télécharger pour lire hors ligne
Executive Summary
Project Wins
• Improved Bent/Scratched/Damaged Scrap $$$ from average
of $5850/month to $1362/month in Material Handling
Department from August 2015 to December 2015 – over
76% Scrap Reduction – goal was 50%.
• Designed more efficient racks, improved employee cross-
training, established Control Charts/Monitoring Plan to
sustain improvements
• Improved outdated Standard Work Instructions with Visual
Management and identified/implemented simple changes
(spacer/arm covers/shavings/tiedowns) to the process.
• Created new storage area that eliminated 1,527 feet of
wasted Motion/Transportation due to Process Bottleneck.
DMAIC Approach
• Gathered Internal Customer Feedback using Affinity
Analysis
• Identified Root Causes with a Fishbone Diagram
(Ishikawa)
• Used a Process Walk to identify the 8 Wastes
• Used LCS for Rack Design Change/Pilot
• Put Controls in place for sustainment of improvements
Context
• The flawed process was on pace for a 300% increase in
BSD Scrap. Identifying these root causes not only
allowed us to improve the process – but also identify Best
Practices to implement throughout our other facilities
across the U.S. and Canada.
Project Start: 9/7/2015 Project End: 1/27/2016
$4,622.06
$8,114.10
$4,877.85
$4,942.94
$5,653.64
$3,854.11
$6,412.27
$8,327.46
$6,177.00
$4,541.79
$2,252.09
$1,362.02
$0.00
$1,000.00
$2,000.00
$3,000.00
$4,000.00
$5,000.00
$6,000.00
$7,000.00
$8,000.00
$9,000.00
Jan-15 Feb-15 Mar-15 Apr-15 May-15 Jun-15 Jul-15 Aug-15 Sep-15 Oct-15 Nov-15 Dec-15
2015	- B/S/D	- MATERIAL	HANDLING
SCRAP	$$
Operational Definitions
• Anodizing (ANO) – chemical coating process that converts metal stock
lengths into a decorative, durable, corrosion-resistant finish
• B/S/D = Bent/Scratched/Damaged Material
• Bent Material – Material bowed in excess of 1/32” for every 4.5” in width
(Max width is 9”)
• Damaged Material – Any combination of Bent/Scratched metal in addition
to any damage that occurs during transit
• Extrusion (EXT) – process where metal logs are pushed through a die to
create objects/shapes of a fixed profile
• Paint (PNT) – process of pre-treating and adding full coats of primer and
desired paint color along conveyor
• Scratched Material – Any length scratch appearing in an exposed area of
metal and/or scratch in excess of 3” in unexposed area of metal
• Exposed Area – Any area of the metal that is on the exterior of the building
or visible through a lite of glass
• Unexposed Area – Any area of the metal that is not visible upon installation
Define
• Weighted Criteria Matrix
• Project Charter
• Collect VOC/Internal Customer Feedback (Affinity Analysis)
• VOC Translation Matrix
• High Level Map (SIPOC)
• Process Walk Planning Checklist
• Detailed Process Map (Swimlane)
• Stakeholder Analysis
• Relationship Map
• Communication Plan
• Pose and Answer
Weighted Criteria Matrix
Project CharterSubtitle
Scrap $$$ for the Material Handling Dept. has risen to
$5850/month in 2015 (January-August) for material
marked as Bent/Scratched/Damaged. The Scrap $$$ in
2014 for the same category was just $2141/month.
While the costs obviously hurt the bottom line, the
inability to push a good quality product in a timely
manner impacts delivery to our Assembly/Glazing
Plants and eventually; runs the risk of missing Customer
Due Dates.
My organization's Strategy for 2015 was
to create a culture of (1) Problem Solving
and (2) Continuous Improvement. With
B/S/D Scrap $$$ projected to jump
almost 300% from 2014 to 2015, this
cross-departmental project is our best
opportunity to reduce scrap costs across
the board while aligning our efforts with
the Organizational Strategy. This project
Problem Statement
Goal Statement
Business Case & Benefits
The goal is to reduce Bent/Scratched/Damaged Scrap
$$$ by 50% from $5850/month to $2925/month by the
end of 4Q/2015.
Timeline
Preliminary Plan:
Timeline Planned
Actual Define
9/28/15 9/27/15
Measure 10/26/15
10/27/15 Analyze
11/16/15 11/19/15
Improve 12/14/15
12/24/15 Control
Scope In/Out
Process : Material Handling Department handles the flow
of all Metal traveling from (1) Extrusion Presses, (2)
Anodizing Lines, (3) Paint Department, (4)
Packing/Shipping. They are the only department that
touches all four areas of our Metal Processing Plant.
Team Members
Team Lead: Jeff (Quality Engineer/Green
Belt) - 25% Team Member 1: Michael
(Process Owner) - 20% Team
Member 2: Dexter M. (Mat.
Handler/Driver) - 15% Team Member
3: Vincent L. (Maintenance) - 15%
Team Member 4: Jaxson P. (Material
Handler) - 15% Team Member 5:
Kevin Y. (Fabrication) - 5%
VOC – AFFINITY ANALYSIS
Customers of this Process-driven project are all internal departments
(Extrusion, Anodizing, Paint). The feedback focused on three important factors:
VOC Translation Matrix
Customer Comment Gathering More Understanding Customer Requirement
Skipping Visual Checks - bad material being
ignored
Customers want material reviewed at each process
step
Each Dept. (EXT/ANO/PAINT) along with Material
Handling to initial traveler showing QC check
performed
Poorly conditioned (decaying/nails) racks
scratching parts
Customers want better racks to protect parts
(consider re-design)
Remove all decaying/defective racks from
circulation - replace with new
Material arriving out of order, items left waiting, not
rushing jobs that should be
Customers want to receive parts as needed and
have a more organized scheduling system
Daily schedule for flow of Material/Orders - sync
across EXT/ANO/PNT
Parts being stacked on exposed surfaces Customers want parts properly stacked to avoid
scratches and double-handling
All employees to receive training - signoff on
process of stacking parts
Metal spacers in circulation with no (or torn) sleeve
covers
Customers want spacers properly covered to
prevent scratches to material
Metal spacers to have kevlar sleeves
replaced/stapled prior to loading parts
Employees not aware if material can be reworked -
assumed scrap
Customer can prevent serious scrap $$$ by
reworking material
Relocate potential rework to MRB area so Dept
Managers can sign-off/scrap
Voice Of the Customer Translation Matrix
SIPOC
S I P O C
Supplier Input Process Output Customer
Extrusion Logs Extrusion Press Metal Stock Lengths Anodizing (Internal)
Anodizing Anoding Tanks
Metal Stock Lengths
anodized (chemical
coating)
Anodized Coating Paint (Internal)
Paint Paintline
Primers - Full Coats of
Paint Applied
Painted Metal Shipping (Internal)
Packing/Shipping Load Trucks
Match Material to
Orders
Finished Goods
General Contractors -
Construction Firms
(6) Relocate potential Rework to MRB area so Dept Managers can sign-off/scrap
Training: (5) All employees to receive training - signoff on process of stacking parts
SIPOC
Extruded thru Dies
(shapes)
Customer Requirements:
Quality: (1) Each Dept (EXT/ANO/PNT) and MH to initial traveler showing QC check
(2) Remove all decaying/defective racks from circulation - replace with new
(3) Metal Spacers have kevlar sleeves replaced/stapled prior to use
OTIF: (4) Daily Schedule for flow of Material/Orders - sync across EXT/ANO/PAINT
Process Walk Planning
Activity
Completed
(Yes or No)
Develop a high level map of the process to be “walked” (SIPOC, Spaghetti) Yes
Create a list of all Process Walkers/Interviewers (Jeff, Michael) Yes
Create a list of all Interviewees (Dexter M., Jaxson P., Steven R.) Yes
Create a list of Stakeholders to be invited to the Stakeholder Presentation (Tim J., Paul K., Klay
M., Wes B.)
Yes
Develop a Communication Plan for the event Yes
Create a high level agenda for the Process Walk Yes
Set a tentative date/time for Process Walk Orientation Yes
List tentative dates/times and location for the Process Walk and the Stakeholder Update Yes
List tentative dates/times and location for the Stakeholder Update (last day) Yes
Process Walk Planning Checklist
Notes: *Orientation/Walk/Interviews scheduled for 9/22-9/23/15
Swimlane Map
Stakeholder Analysis
Stakeholder/
Stakeholder
Group
Impact Level Level of Support
Reason for
Resistance or Support
Action(s) to Address
This Stakeholder
Group
Contact
VP-
MANUFACTURING
DECISION AUTHORITY SUPPORTIVE
FINANCIAL BACKING - WILL
HELP CLEAR BARRIERS
UPDATE/NOTIFYIF ANY
PURCHASES OR MATERIAL
NEEDED
TIMJ.
METAL PROC.
MANAGER
IMPACTS NEUTRAL
AWARE OF PROBLEMBUT
UNSURE EMPLOYEES CAN
HANDLE CHANGES
CREATE WORK
INSTRUCTIONS/TRAINING
OPPORTUNITIES EARLYIN THE
PROCESS
KLAYM.
PLANT MGR AFFECTED RESISTANT
AFRAID CHANGES COULD
LEAD TO NON-VALUE ADDED
TIME TO CURRENT PROCESS
USE DATATO SHOW
EXPECTED COST SAVINGS
AND POTENTIAL LOSSES IF
NOT ADDRESSED
WES B.
QUALITYTEAM DECISION AUTHORITY SUPPORTIVE
ANXIOUS TO SHOW PROCESS
IMPROVEMENT TEAMS CAN
ADD VALUE TO THE
ORGANIZATION
CREATE USEFUL
TEMPLATES/DOCUMENT
STRATEGIES - IDENTIFY
GOOD/BAD LESSONS
LEARNED
PAUL K.
Stakeholder Analysis (Advanced) - DEFINE
Relationship Map
Project:
Relationship Map
BSD Scrap Reduction Project
Decision Authority
- Tim J. (VP-
Manufacturing)
Impacts Outcome -
Klay M. (Metal
Processing Mgr)
Will Be Affected -
Wes B. (Plant Mgr)
Project
Paul K. (Quality
Dir)
Communication Plan
Stakeholder Group Objectives/Actions Desired Message
Delivery
Method/Venue
Timing
Communication Plan
VP - Manufacturing
Metal Processing Mgr
Plant Manager
Quality Team
Communicate any financial
limitations or restrictions -
Support the Project
Have leads/supervisors give
full access to employees and
help with training needs
Enforce countermeasures and
action plans put in place once
root causes identified
Support team members and
encourage other departments
to research future projects
Potential changes to the racks/sleeves
need to be explored for $$$
Email Bi-Weekly
Allow time for Process
Walks/Interviews to allow team to build
knowledge of the current state
1-on-1/Email Weekly (Tues/Thurs)
Assist Process Improvement Activities
in focused areas and review data ($$)
that backs up need for project
Weekly Dept. Meetings Weekly (Tues/Thurs)
Document Activities/Progression
showing value of a culture change
1-on-1 Weekly
Pose and Answer
Pose & Answer - Influence Strategy
Questions Answers
What is important about this project? It is a broken/flawed process that impacts all departments of our plant.
Why is this project important to do right now? The Scrap $$$ for BSD is in a freefall and on pace to triple our scrap from 2014 (thru 8 months).
Why is this project more important than other
pressing projects?
Other projects can be handled in a 3-5 day Kaizen blitz - more of a quick fix. This project hits the bottom line more
than others and has cross-functional impacts and best practices that can be gained.
What problems will this project solve? It will identify the root causes for a plant-wide issue - for which currently there are none.
How will this project help your colleagues? It will help specify process improvement activities in focused areas.
How will the project help your manager?
It gives my manager the ammunition (proof) that our Process Improvement Teams can work hand-in-hand with all
departments and add value to the organization.
In what ways does the business gain from this
project?
We will gather the lessons learned to fix the problem and put metrics together to prevent it from getting out of control.
Draft Business Case
What are some positive side effects of doing
this project?
The ultimate value will be the Best Practices created that can be crossed over and implemented throughout our other
facilities across the United States and Canada.
Other?
My goal is to communicate (with proven results) to the shop employees, department managers, and upper level
management that the Lean-Based Culture is something we need to completely adopt.
Measure
• Data Collection Planning
• Bent Material (Visual Management)
• Scratched Material (Visual Management)
• Damaged Material (Visual Management)
• Checksheets
• Calculate Sampling Plan
• Measurement Systems Analysis (MSA)
• Baseline Measure Chart
• Process Capability
Data Collection Planning
Measure Data Type Operational Definition Stratification Factors Sampling Notes Who and How
BENT MATERIAL DISCRETE
MATERIAL BOWED IN
EXCESS OF 1/32" FOR
EVERY 4.5" IN WIDTH
(MAX WIDTH IS 9")
(1) LOCATION
(EXT/ANO/PAINT)
(2) SHIFT (1st/2nd)
SAMPLE EVERY 10TH
RACK OF FG1101M (25
PIECES PER RACK/3
RACKS MAX) PER SHIFT
EACH DAY FOR 5 DAYS
(10/19-10/23) - 750 TOTAL
PIECES SIMULTANEOUS
FOR BENT, SCRATCHED,
AND DAMAGED
MATERIAL HANDLING
TEAM - 1 RACK EACH AT
EXT/ANO/PAINT - VISUAL
INSPECTION - USE
CHECKSHEET - FOLLOW
MARKED RACKS FROM
EXT TO ANO TO PAINT
SCRATCHED MATERIAL DISCRETE
ANY LENGTH SCRATCH
APPEARING IN AN
EXPOSED AREA OF
METAL AND/OR
SCRATCH IN EXCESS OF
3" IN UNEXPOSED AREA
OF METAL
(1) LOCATION
(EXT/ANO/PAINT)
(2) SHIFT (1st/2nd)
SAMPLE EVERY 10TH
RACK OF FG1101M (25
PIECES PER RACK/3
RACKS MAX) PER SHIFT
EACH DAY FOR 5 DAYS
(10/19-10/23) - 750 TOTAL
PIECES SIMULTANEOUS
FOR BENT, SCRATCHED,
AND DAMAGED
MATERIAL HANDLING
TEAM - 1 RACK EACH AT
EXT/ANO/PAINT - VISUAL
INSPECTION - USE
CHECKSHEET - FOLLOW
MARKED RACKS FROM
EXT TO ANO TO PAINT
DAMAGED MATERIAL DISCRETE
ANY COMBINATION OF
BENT AND SCRATCHED
METAL IN ADDITION TO
ANY DAMAGE THAT
OCCURS DURING
TRANSIT OF MATERIAL
(1) LOCATION
(EXT/ANO/PAINT)
(2) SHIFT (1st/2nd)
SAMPLE EVERY 10TH
RACK OF FG1101M (25
PIECES PER RACK/3
RACKS MAX) PER SHIFT
EACH DAY FOR 5 DAYS
(10/19-10/23) - 750 TOTAL
PIECES SIMULTANEOUS
FOR BENT, SCRATCHED,
AND DAMAGED
MATERIAL HANDLING
TEAM - 1 RACK EACH AT
EXT/ANO/PAINT - VISUAL
INSPECTION - USE
CHECKSHEET - FOLLOW
MARKED RACKS FROM
EXT TO ANO TO PAINT
Data Collection Planning
Bent Material
MATERIAL	BOWED	IN	EXCESS	OF	1/32"	FOR	EVERY	4.5"	IN	WIDTH	(MAX	WIDTH	IS	9")
Scratched Material
Exposed	Area	– 2”	scratch
ANY	LENGTH	SCRATCH	APPEARING	IN	AN	EXPOSED	AREA	OF	METAL	AND/OR	
SCRATCH	IN	EXCESS	OF	3"	IN	UNEXPOSED	AREA	OF	METAL
Unexposed	Area	– 6”	scratch
Damaged Material
ANY	COMBINATION	OF	BENT	AND	SCRATCHED	METAL	IN	ADDITION	TO	ANY	
DAMAGE	THAT	OCCURS	DURING	TRANSIT	OF	MATERIAL	
Strap/Tie-down	Damage Forklift	Transit	Damage
Checksheets
B/S/D	METAL	CHECK DATE: B/S/D	METAL	CHECK DATE:
TEAM: PART# TEAM: PART#
SHIFT: LENGTH SHIFT: LENGTH
LOCATION: PIECES: LOCATION: PIECES:
TYPE COUNT QTY/RW COUNT	TOTAL TYPE COUNT QTY/RW COUNT	TOTAL
Bent Bent
Scratched Scratched
Damage/Transit Damage/Transit
B/S/D	METAL	CHECK DATE: B/S/D	METAL	CHECK DATE:
TEAM: PART# TEAM: PART#
SHIFT: LENGTH SHIFT: LENGTH
LOCATION: PIECES: LOCATION: PIECES:
TYPE COUNT QTY/RW COUNT	TOTAL TYPE COUNT QTY/RW COUNT	TOTAL
Bent Bent
Scratched Scratched
Damage/Transit Damage/Transit
B/S/D	METAL	CHECK DATE: B/S/D	METAL	CHECK DATE:
TEAM: PART# TEAM: PART#
SHIFT: LENGTH SHIFT: LENGTH
LOCATION: PIECES: LOCATION: PIECES:
TYPE COUNT QTY/RW COUNT	TOTAL TYPE COUNT QTY/RW COUNT	TOTAL
Bent Bent
Scratched Scratched
Damage/Transit Damage/Transit
B/S/D	METAL	CHECK DATE: B/S/D	METAL	CHECK DATE:
TEAM: PART# TEAM: PART#
SHIFT: LENGTH SHIFT: LENGTH
LOCATION: PIECES: LOCATION: PIECES:
TYPE COUNT QTY/RW COUNT	TOTAL TYPE COUNT QTY/RW COUNT	TOTAL
Bent Bent
Scratched Scratched
Damage/Transit Damage/Transit
*Mark	any	impacted	piece	with	a	(B)	Bent,	(S)	Scratch,	or	(D)	Damaged	in	unexposed	area	of	metal
Calculate Sampling Plan
• Process Sampling (Live)
• Stratified/Systematic
• Ongoing – every 10th rack
• 50% Estimate of Prop (worst case)
• Stratification Factors
1. Location
2. Shift
Sampling	Calculation	(Discrete)	for	Racks	of	BSD	Material	-	MINITAB	
Parameter Proportion
Distribution Binomial
Proportion 0.5
Confidence level 95%
Confidence interval Two-sided
Results
Margin Sample
of Error Size
0.04 623
	
	
With a Metal Processing Plant and an unlimited amount of samples at my disposal – I
chose to use the 50% Estimate of Proportion for a Worst-Case Scenario. This gives me
a minimum sampling size of 623 pieces.
MSA – Gage R&R (Discrete)
1. Standard/Reference – BSD Material referenced in Data Collection Planning
Operational Definitions (Pg 16)
2. Appraisers/Operators – Dexter M. (1st Shift)/Jaxson P. (2nd shift)
3. Parts – WW400 – 20 total (14 good/6bad) – blind and unbiased (highlights)
4. Trials – Twice for each operator
5. Measurement/Response – 0=Defect, 1=Good
GOOD
DEFECT
MSA - ContinuedAttribute Agreement Analysis for ASSESSED RESULT
Date of study: 10/12/2015
Reported by: Jeff Owens
Name of product: WW400
Misc: BB Project - Discrete MSA Analysis
Within Appraisers
Assessment Agreement
Fleiss’ Kappa Statistics
Appraiser Response Kappa SE Kappa Z P(vs > 0)
A 0 0.856631 0.223607 3.83097 0.0001
1 0.856631 0.223607 3.83097 0.0001
B 0 0.687500 0.223607 3.07459 0.0011
1 0.687500 0.223607 3.07459 0.0011
Each Appraiser vs Standard
Assessment Agreement
Fleiss’ Kappa Statistics
Appraiser Response Kappa SE Kappa Z P(vs > 0)
A 0 0.803971 0.158114 5.08476 0.0000
1 0.803971 0.158114 5.08476 0.0000
B 0 0.722250 0.158114 4.56791 0.0000
1 0.722250 0.158114 4.56791 0.0000
Between Appraisers
Assessment Agreement
Fleiss’ Kappa Statistics
Response Kappa SE Kappa Z P(vs > 0)
0 0.825708 0.0912871 9.04518 0.0000
1 0.825708 0.0912871 9.04518 0.0000
All Appraisers vs Standard
Assessment Agreement
Fleiss’ Kappa Statistics
Response Kappa SE Kappa Z P(vs > 0)
0 0.763111 0.111803 6.82547 0.0000
1 0.763111 0.111803 6.82547 0.0000
In	regards	to	the	Appraisers	vs.	Standard	– Fleiss’	 Kappa	
readings	remained	marginal	(between	0.70-0.90)
BA
100
95
90
85
80
75
70
65
Appraiser
Percent
95.0% CI
Percent
BA
100
95
90
85
80
75
70
65
Appraiser
Percent
95.0% CI
Percent
Date of study: 10/12/2015
Reported by: Jeff Owens
Name of product: WW400
Misc: BB Project - Discrete MSA Analysis
Assessment Agreement
Within Appraisers Appraiser vs Standard
Baseline Measure Chart
After running the baseline data – projections showed we had
still made no progress towards our goal of reducing scrap to
$2925/month
$2,141.04	
$5886.83
$5427.23
$0.00	
$1,000.00	
$2,000.00	
$3,000.00	
$4,000.00	
$5,000.00	
$6,000.00	
$7,000.00	
2014 Jan-Sept	2015 10/15	Baseline
BSD	Monthly	Scrap	- Material	Handling
Process Capability
• DPU = # Defects/# Units = 422/750 = 0.56
• DPMO = 422/3000 x 1,000,000 = 140,667 (4 Opportunities)
• Sigma Level = 2.5 (rounded down), 84.1% Yield (158,655)
• Final Yield (Y Final) = # Good Units/# Total Units = 639/750 = 85.2%
• First Pass Yield (YFP) = 750-422 = 328, 328/750 = 44%
• Rolled Throughput Yield (YRTP) – EXT (61%), ANO (88%), PNT (93%)
– .61 x .88 x .93 = 50%
Analyze
• 8 Wastes Checksheet
• Fishbone Diagram
• Data for Statistical Testing
• Hypothesis Statement – One Proportion
• Hypothesis Statement – Two Proportion
• Hypothesis Statement – Chi-Square
• Hypothesis Testing Plan Results
8 Wastes Checksheet
Date: 9/23/2015
Waste Definition Examples
Type "High",
"Medium", "Low"
Description of Issues
- Inaccurate applications
- Broken parts
- Missed deadlines
- Extra copies of reports
- Redundant storage (hard & soft)
- "Reply All" on emails
- Waiting for approvals
- Waiting for equipment
- Waiting for large batches
- Employees unable to make decisions
- Employees not fully trained
- Skilled employees doing unskilled tasks
- Hand-offs between functions
- Multiple reviews
- Sending, resending emails
- Stockpiling supplies
- Information piling up for data entry
- Keeping data longer than necessary
- Repetitive key strokes
- Walking between equipment
- Switching applications
- Extra formatting, extra fields
- Extra features, excess detail
- Extra report information
The 8 Wastes Checksheet
M Motion
Any movement by people
that is not of value to the
customer
Material between Extrusion and Anodizing is kept
across street as in Transportation - badly need
storage in these areas
Poor Layout makes Inventory seem worse than it
actually is
Transportation
Unnecessary movement of
materials, information or
equipment
I Inventory
Accumulation of parts,
information, applications,
etc. beyond what is required
by the customer
Only source of storage is across the street and
the racks transporting material are in terrible
shape - too much double-handling
Material Handling throughout EXT/ANO/PNTProcess Area:
D Defects
Information, products and
services that are incomplete
or innacurate
O Overproduction
Making more of something -
making it earlier or faster-
than it's needed
W Waiting
Waiting for information,
equipment, materials, parts
or people
There are a few Value-Enabling steps but overall
not a significant issue
E
Extra-
Processing
Any steps that do not add
value in the eyes of the
customer
Low
High
Low
High
N
Non-Utilized
Talent
Not properly utilizing
people's experience, skills,
knowledge or creativity
T
Defects occurring at every stop (EXT/ANO/PNT)
due to inability to follow work instructions,
inspections, and safely/securely handle material
transfer
Not currently a problem - waiting seems to be as
a result of the bottleneck in the Extrusion Ovens
Mentioned above, cycle time for Extrusion is
higher than Anodize and Paint combined. Work
schedules would be better off altered.
Lack of standard work and cross-training stands
out - changing this could perhaps build more
ownership among the employees
High
Low
High
Medium
Fishbone Diagram
Data for Statistical Testing
Hypothesis Statement – One
Proportion Test
According to past performance (2014), BSD Defect Rates were at 7%
for Extrusion/Anodizing/Paint. The team suspects it’s getting worse
due to the conditions of the wooden racks, which typically rot out within
3 years. Recent data has been collected and we want to know if BSD
Defect Rates have risen. Note that current racks in circulation were
built in early 2013. (X) = Time Period.
NULL: Ho P = .07 (7%)
ALTERNATE: Ha P ≠ .07 (7%) or P › .07 (7%)
Test: One Proportion (Proportion compared to standard). In this case,
we are determining if there is a difference between a historical level of
defects and current defect levels.
One Proportion Test Analysis
Conclusion: BSD Defect Rates have truly gotten worse, jumping from
7% in 2014 to 11% in 2015. The P Value (0.000) is low (less than 0.05)
so the Null must be rejected. The result of this test is True.
Test	and	CI	for	One	Proportion	(MINITAB)
Test of p = 0.07 vs p ≠ 0.07
Sample X N Sample p 95% CI Z-Value P-Value
1 69 630 0.109524 (0.085138, 0.133910) 3.89 0.000
Using the normal approximation.
0%
2%
4%
6%
8%
10%
12%
2014 2015
BSD	DEFECT	RATES	– EXT/ANO/PNT
BSD	DEFECT	RATES
Hypothesis Statement – Two
Proportion Test
The team suspects that inadequate training to 2nd shift employees has
resulted in more defects being allowed to pass on 2nd shift than 1st
shift. This test will help us determine if there is a difference between
the two. (X) = Work Shifts. P1 = 2nd shift, P2 = 1st shift.
NULL: Ho P1 - P2 = 0
ALTERNATE: Ha P1 - P2 ≠ 0
Test: Two Proportion (Proportion of a data set against another) to see if
one area is underperforming. Each shift will review the same sample
size lot of 630 pieces in the Extrusion Area.
Two Proportion Test Analysis
Conclusion:BSD Defect Rates are significantly differentbetween the two shifts with 2nd shift
allowing 14% ofdefects compared to 9% for 1st shift while reviewing the same lot of material.The
P Value (0.006) is low (less than 0.05) so the Null must be rejected. The resultof this test is True.
Test	and	CI	for	Two	Proportions:	2nd	Shift,	1st	Shift	(MINITAB)
Event = Good
Variable X N Sample p
2nd Shift 542 630 0.860317
1st Shift 573 630 0.909524
Difference = p (2nd Shift) - p (1st Shift)
Estimate for difference: -0.0492063
95% CI for difference: (-0.0843421, -0.0140706)
Test for difference = 0 (vs ≠ 0): Z = -2.74 P-Value = 0.006
Fisher’s exact test: P-Value = 0.008
0% 2% 4% 6% 8% 10% 12% 14%
2nd	Shift
1st	Shift
BSD	DEFECT	RATES
BSD	DEFECT	RATES
Hypothesis Statement – Chi-
Square
The team suspects that better inspection is being done in the Paint
Department compared to the Extrusion and Anodizing Departments.
We will test Defect Rates in each department to see if there is truly a
difference in the three. (X) = Departments. P1 = Paint, P2 = Extrusion,
P3 = Anodizing.
NULL: Ho P1 = P2 = P3
ALTERNATE: Ha P1 ≠ P2 ≠ P3
Test: Chi-Square (2 or more Proportions against each other). In this
case, we are determining if there is a difference between defect rates in
different departments (EXT/ANO/PNT) in order to find Best Practices
for Inspection.
Chi-Square Test Analysis
Chi-Square	Test	– MINITAB
Rows: Worksheet rows Columns: Worksheet columns
EXTRUSION ANODIZE
PAINT SUMM SUMM SUMM All
1 566 555 558 1679
559.67 559.67 559.67
0.07167 0.03891 0.00496
2 64 75 72 211
70.33 70.33 70.33
0.57030 0.30964 0.03949
All 630 630 630 1890
Cell Contents: Count
Expected count
Contribution to Chi-square
Pearson Chi-Square = 1.035, DF = 2, P-Value = 0.596
Likelihood Ratio Chi-Square = 1.046, DF = 2, P-Value = 0.593
Conclusion: BSD Defect Rates showed variation but are not statistically different
between the three departments. The P Value (0.596) is high (more than 0.05) so
we fail to reject the Null. The result of this test is False.
7%
8%
9%
10%
11%
12%
13%
14%
15%
16%
PAINT EXTRUSION ANODIZING
BSD	DEFECT	RATES
BSD	DEFECT	RATES
Hypothesis Testing Plan Results
Possible X Root Cause Hypothesis Hypothesis Test Results
Time Period
BSD Defect rates were lower in the past when newer racks
were being used to transport material
One Proportion TRUE
Work Shifts
2nd Shift Material Handlers are responsible for allowing more
defects than the 1st Shift
Two Proportion TRUE
Departments
Material Handlers in the Paint Department are doing a better
job of inspecting material than the Extrusion and Anodizing
Departments
Chi-Square FALSE
Hypothesis Testing Plan
Improve
• Root Causes to Address (Fishbone)
• Rack Design Change
• Poor Lighting
• Poor Layout
• New Storage Area
• Spacers
• Dolly/Rack Covers
• Shavings
• Tie-Down Material
• Cross-Training Matrix
• Updated Communication Plan
• Updated Stakeholder Analysis
• Implementation Plan
Root Causes to Address
The Team referenced our Fishbone Diagram to brainstorm solutions that address our root
causes. The highlighted root causes (aside from the Racks) above allowed for the most impact
with the least amount of effort. Anew Rack Design is our featured change.
Rack Design Change
Based on our Hypothesis for a One Proportion Test in the Analyze Phase, we were able to
show an increase in Defect Rates from 7% in 2014 to 11% in 2015 due to the poor
conditions of wooden racks used to transport material. The pictures below give you an idea
of the battle our Material Handling Department has of not damaging material in transit.
Within 2-3 years, the wooden racks begin to rot and expose nails that results in Scratched
Material. In addition, the wood eventually loses its structure and will bottom out on other
material, making it susceptible to scratches and bowed metal (Bent Material).
Rack Design Change
With a game-changing issue such as Rack Design, we decided to add a few team members and used another
DMAIC tool (LCS) to get ideas from other departments upstream and downstream that also have to deal with
the racks. This allowed us to overhaul the Racks using metal that was originally scrapped with the help of our
Brake Metal and Welding Shop. Our newest team members helped suggest a preset lifting length that could be
setup for all forklifts and therefore be used throughout the entire campus. The new design would also carry
enough strength/stability for our longest material lengths (28 feet) while maintaining features mandated by our
Safety Department (weighing under 75 lbs so two team members can move).
Rack Design Change Pilot
Armed with a new design and taking advantage of material that had been left for scrap – we had 15 racks
built and deployed five each to Extrusion, Anodizing, and Paint to gain feedback of potential improvements
to the Material Handling Process. After carefully assessing the risk of process changes, we would heavily
use them in circulation for the next two weeksbefore making any large scale plans. The supportive
feedback was unanimouson both shiftsand we made it known to our Stakeholders that we wanted to fully
replace our 800+ wooden racks already in circulation. Since the previous process involved purchasing the
wood and building from within, the changed process of using already scrapped metal and welding on-site
was an actual push in termsof Return on Investment ($$$).
Poor Lighting
One root cause that was easily identified as a “Quick Fix” or simply just needing
implementation was the poor lighting in the Inspection Areas near the Anodizing
Lines. We found this to be a routine problem throughout the plant and added
Maintenance to our list of Stakeholders to help ensure this doesn’t re-occur.
Poor Layout
The layout of our plant remains the biggest challenge we cross every day. With our final
step of the Metal Processing lifecycle (Paint) and our Warehouse being located across
the street, it leaves our Material Handling Department open to multiple risks in transit –
not to mention a horrible violation of the 8 Wastes (Motion/Transportation).
Poor Layout
After	reviewing	the	wasted	motion	going	back	and	forth	to	the	Warehouse	area,	our	team	was	
able	to	negotiate	some	unused	space	between	the	Extrusion	and	Anodizing	areas	for	extruded	
material	awaiting	Anodizing.	This	knocked	down	the	1,527	feet	due	to	a	bottleneck	to	less	than	
50	feet	and	frees	up	the	Warehouse	for	more	pressing	needs.
New	Storage
New Storage Area
Spacers
Our process walk during the Define Phase shed the light on a problem that we’ve been familiar with but
simply was not being implemented in the Extrusion area. All metal spacers should have stapled kevlar
covers on them. Uncovered spacers lead to Scratched Material. It’s already in the Work Instructions but
was not being followed. After being told they were not getting much life out of the old style kevlar – we
got the Purchasing Dept. involved to make sure we could get a better product with a longer life
expectancy.
Scratched	
Material
Dolly/Rack Covers
Along the lines of the Spacer Covers was an issue with the arms of the dollies/racks
rubbing up against material and causing scratches. Our Purchasing Dept. was able to
use the same company from the Spacer Covers for these kevlar-coated Rack Covers.
Shavings
Shavings left on extruded metal can only result in one thing – Scratched Material. This is
another implementation item that is called out in all Work Instructions but not being
followed by all employees despite air guns at the Extrusion Presses. We had all
department supervisors reiterate in their pre-shift meetings the importance of this and will
also make it more visual in the Work Instructions.
Tie-Down Material
As you’ve seen with the Spaghetti Map, material travels quite a distance from our Anodizing
Department and across the street to Paint and the warehouse for storage. If a batch of material is
not properly tied down, it will shift while in transit and lead to Damaged Material. This has also led
to the need to upgrade the road conditions for the material transfer. This will be an added Training
feature and part of the updated Work Instructions.
Properly	Tied
Cross-Training Matrix
In our Two Proportion Hypothesis Test, we were able to show a statistically significant
difference in the defect rates between 1st and 2nd shift due to inadequate training. We
created a Cross-Training Skills Matrix to ensure both shifts would be equally trained.
NAME
NOT TRAINED
IN TRAINING - OPERATES UNDER SUPERVISION
CAPABLE WITH MINIMAL SUPERVISION
OPERATES INDEPENDENTLY TO STANDARDS
FULLY COMPETENT - CAN TRAIN OTHERS
TEAM LEADER OR CAN FILL IN FOR TEAM LEADER
MATERIAL	HANDLING	CROSS-TRAINING	SKILLS	MATRIX
R
E
A
D
P
R
I
N
T
S
S
T
A
C
K
I
N
G
P
R
O
C
E
D
U
R
E
S
D
E
T
E
C
T
R
E
W
O
R
K
L
O
A
D
I
N
G
A
N
D
U
N
L
O
A
D
I
N
G
E
P
I
C
S
K
N
O
W
L
E
D
G
E
D
E
F
E
C
T
C
O
D
E
K
N
O
W
L
E
D
G
E
F
O
R
K
L
I
F
T
C
E
R
T
I
F
I
C
A
T
I
O
N
P
A
L
L
E
T
J
A
C
K
T
R
A
I
N
I
N
G
C
R
A
N
E
/
H
O
I
S
T
T
R
A
I
N
I
N
G
S
K
I
L
L
S
U
N
D
E
R
S
T
A
N
D
W
O
R
K
I
N
S
T
R
U
C
T
I
O
N
S
M
A
T
E
R
I
A
L
I
N
S
P
E
C
T
I
O
N
I
N
T
E
R
P
R
E
T
B
/
S
/
D
M
A
T
E
R
I
A
L
Updated Communication Plan
Stakeholder Group Objectives/Actions Desired Message
Delivery
Method/Venue
Timing
Communication Plan
VP - Manufacturing
Metal Processing Mgr
Plant Manager
Quality Team
Inform of project findings and
report back potential
costs/expected savings
Inform of project findings,
foster buy-in and ownership,
participate in roll-out
Inform of project findings,
foster buy-in and ownership,
participate in roll-out
Document Project Timeline for
Best Practices
Translate ROI for racks and costs of
sleeves after discussions with
Purchasing - inform of pilot results
Email Within 1 week
Inform of pilot results, work instruction
overhaul, training and implementation
plan
Schedule meeting
along with Plant
Manager
Within 2 weeks
Inform of pilot results and
implementation plan
Maintenance
Purchasing
Safety
(1) lighting at inspection areas (2)
road conditions for material transit
(3) preventive maintenance as
identified
Purchase sleeves (covers) for
spacers and dolly/rack arms
Review new Rack design
Schedule meeting
along with MP Manager
Within 2 weeks
Use project results to help
identify/teach other departments about
the importance of a Lean Culture
Email
After Project Storyboard
is Complete
Need areas of the plant setup
immediately - order safety stock
Email Today
Research/compare suppliers Email Today
Inform of any challenges due to added
weight of new rack design - apply in
next month's safety training topics
1-on-1 This week - prior to pilot
Updated Stakeholder Analysis
Stakeholder/
Stakeholder
Group
Impact Level Level of Support
Reason for
Resistance or Support
Action(s) to Address
This Stakeholder
Group
Contact
VP-
MANUFACTURING
DECISION AUTHORITY SUPPORTIVE
FINANCIAL BACKING - WILL
HELP CLEAR BARRIERS
UPDATE/NOTIFY IF ANY
PURCHASES OR MATERIAL
NEEDED
TIM J.
METAL PROC.
MANAGER
IMPACTS NEUTRAL
AWARE OF PROBLEM BUT
UNSURE EMPLOYEES CAN
HANDLE CHANGES
CREATE WORK
INSTRUCTIONS/TRAINING
OPPORTUNITIES EARLY IN THE
PROCESS
KLAY M.
PLANT MGR AFFECTED RESISTANT
AFRAID CHANGES COULD
LEAD TO NON-VALUE ADDED
TIME TO CURRENT PROCESS
USE DATA TO SHOW
EXPECTED COST SAVINGS
AND POTENTIAL LOSSES IF
NOT ADDRESSED
WES B.
QUALITY TEAM DECISION AUTHORITY SUPPORTIVE
ANXIOUS TO SHOW PROCESS
IMPROVEMENT TEAMS CAN
ADD VALUE TO THE
ORGANIZATION
CREATE USEFUL
TEMPLATES/DOCUMENT
STRATEGIES - IDENTIFY
GOOD/BAD LESSONS
LEARNED
PAUL K.
MAINTENANCE IMPACTS SUPPORTIVE
WANT TO PREVENT ANY TYPE
OF DOWNTIME AND LOST
PRODUCTIVITY
PROVIDE LINE ITEMS OF
NECESSARY IMPROVEMENTS
AND KEEP SAFETY STOCK
VINCENT L.
PURCHASING IMPACTS SUPPORTIVE
POTENTIAL NEW SUPPLIERS
COULD BENEFIT OTHER
AREAS OF OUR ORGANIZATION
RESEARCH/STOCK COVERS
USED FOR SPACERS AND
DOLLY/RACK ARMS
DEREK J.
Stakeholder Analysis (Advanced) - IMPROVE
Implementation Plan
Action Item
(List steps required to implement solutions)
Responsible
(List person(s) responsible
for action steps)
Due Date
(Indicate when action items
must be completed)
Outline Pilot Strategy (Timeframe/Dept/Adjustments) Jeff/Daniel/Kevin 12/8/2015
Order supply of spacer/arm covers with enough safety stock - apply immediately Michael/Purchasing 12/11/2015
Update Work Instructions with Process Changes Jeff/Dexter 12/23/2015
Adjust/Replace Lighting in Inspection Areas Vincent 12/11/2015
Create cross-training matrix and setup training for 2nd shift Jeff/Michael 12/22/2015
Create P-Chart to show Improvement over Baseline Jeff 1/6/2016
Set-up Safety Topic to discuss changes and potential lifting hazards (heavier/wider racks) Jake 12/3/2015
Implementation Plan
Control
• Improvements from Baseline (P-Charts)
• Data compared to Goal
• Monitoring Plan
• Response Plan
• Visual Management
• Innovation Transfer
• Lessons Learned
P-Chart (Measure Phase)
Process Capability
P-Chart for Process Capability during Measure Phase in October 2015
P-Chart Revisited
28252219161310741
0.4
0.3
0.2
0.1
0.0
Sample
Proportion
_
P= 0.1347
UCL= 0.3395
LCL= 0
P Chart of DEFECTS
Tests	are	performed	with	unequal	sample	sizes.
The improvement from our baseline back in October was dramatic, dropping our Proportion Defective
for Bent, Scratched, and Damaged Material from 0.5627 to 0.1347, shown in the Minitab P-Chart
below. This translated to only 101 defects over a lot of 750 pieces, compared to 422 defects during
our baseline measure of 750 pieces. I chose the P-Chart due to our racks of material having unequal
sample sizes, ranging from 20-30 pieces per rack.
Shattering the Goal
Our goal was to reduce Bent/Scratched/Damaged Scrap $$ by 50% from an average of
$5850/month (thru August) to $2925/month by the end of the year. We blew that away
with savings of over 76% by reducing it to just $1362.02 by the end of 2015. The graph
below shows the dramatic decline.
$4,622.06
$8,114.10
$4,877.85
$4,942.94
$5,653.64
$3,854.11
$6,412.27
$8,327.46
$6,177.00
$4,541.79
$2,252.09
$1,362.02
$0.00
$1,000.00
$2,000.00
$3,000.00
$4,000.00
$5,000.00
$6,000.00
$7,000.00
$8,000.00
$9,000.00
Jan-15 Feb-15 Mar-15 Apr-15 May-15 Jun-15 Jul-15 Aug-15 Sep-15 Oct-15 Nov-15 Dec-15
2015	- B/S/D	- MATERIAL	HANDLING
SCRAP	$$
Monitoring Plan
Measure Control Limits/Specs Checking Item Checking Frequency Who
Bent, Scratched,
and Damaged
Material
(Defects)
No greater than
0.3395 Proportion
Defective - Upper
Control Limit
Checksheets created
in Data Collection
Plan
Each rack of material
(ranges from 20-30
pieces) in Extrusion,
Anodizing, and Paint
Material Handling
Team
Monitoring Plan
We want the communication to be open so this Monitoring Plan will be a standard slide used in the MDI (Managing
Daily Improvement) walks performed each week for all levels of Plantleadership along with Pre-ShiftMeeting
documentation for all operators. The expectations are that with the attention this has received and the pride of the
employees taking ownership – sustainmentofthese improvements will come easy.
Response Plan
Damage Control Process Adjustment Effectiveness Assessment Continuous Improvement
Confirm all Employees Trained on
Operational Definitions (and Visuals)
of Bent, Scratched, Damaged
Material
Process Owner to Audit Material on
Each shift with employees
No greater than 0.3395 Proportion
Defective per rack - UCL setup in the
Monitoring Plan
Offset employee turnover with
continued Cross-Training and pair
new employees with seasoned
veterans to ensure proper training
habits
Check to see if Racks need repairs or
if spacers/arms are properly covered
Gather a safety stock for all
maintenance items used for racks
Replace rack if defective and store
two months of safety stock (kevlar
covers) at point-of-use
Create weekly Preventive
Maintenance schedule for Material
Handling Teams to sign-off on
Response Plan (If Proportion Defective dips above 0.3395)
Visual Management
Pictures identifying definitions like Bent,
Scratched, Damaged Material along with
Checksheets to use for Data Collection
(Pages 17-20 of this PowerPoint) have been
added to the Standard Work Instructions.
We’ve also included pictures of the
spacer/arm covers, shavings, tiedowns for a
visual explanation within the Work
Instructions. The next step is to have the
Control Charts/Monitoring Plans posted in
each department for everyone to see.
Innovation Transfer
Process Innovation/Addition/Change/Removal
(Describe the implemented solution)
Process Benefits
(Describe the both measurable and intangible benefits
of the change)
Area/Department/Business Unit
(Indicate the process area that could
benefit from innovation transfer)
New Rack Design/Spacer Covers/Arm
Covers
Eliminates B/S/D Opportunities
All Metal Processing Facilities in
U.S. and Canada
Cross-Training Matrix
Creates Employee Ownership and Strengthens
workforce depth
All Departments
Control Charts/Monitoring Plans
Identifies Trigger Measures (UCL/LCL) that lead
to variation
All Departments
Visual Aids added to Work Instructions
Quicker training method and immediate
understanding of Operational Definitions like
Bent, Scratched, and Damaged Material
All Metal Processing Facilities in
U.S. and Canada
New Checksheets for Data Collection
An easy-to-use sheet that tracks each rack of
material against our goal of Proportion Defective
All Metal Processing Facilities in
U.S. and Canada
Innovation Transfer Opportunities
Lessons Learned
• Important to drive inspection earlier in the process where Rework is
an Option. The more VA to the Metal – the harder it is to Rework –
and the less $$ you get for defective material in a scrapyard
• Too many blind handoffs – wanted to create opportunities where
items (Checksheets) had to be initialed to create more ownership
• Newspaper Items
– Dig deeper into Scrap Reporting Efficiency
– Use Project to show value of adding a 2nd Age Oven in
Extrusion to serve as Workload Balancing and eliminate the
obvious bottleneck.
– Sell Lean Culture benefits at the Management Level for ultimate
buy-in on Process Improvements
– Identify more KPIs/Metrics for Tracking (Rework/FPY)

Contenu connexe

Tendances

Value Stream Mapping
Value Stream MappingValue Stream Mapping
Value Stream MappingTKMG, Inc.
 
Green Belt Project Storyboard Template Example
Green Belt Project Storyboard Template Example Green Belt Project Storyboard Template Example
Green Belt Project Storyboard Template Example GoLeanSixSigma.com
 
Value Stream Mapping: From Tool to Management Practice
Value Stream Mapping: From Tool to Management PracticeValue Stream Mapping: From Tool to Management Practice
Value Stream Mapping: From Tool to Management PracticeTKMG, Inc.
 
Lean, Six Sigma, ToC using DMAIC project management
Lean, Six Sigma, ToC  using DMAIC project managementLean, Six Sigma, ToC  using DMAIC project management
Lean, Six Sigma, ToC using DMAIC project managementSimon Misiewicz
 
PROJECT STORYBOARD: Reducing Purchase Order Lead Time by 33% Using Lean Six S...
PROJECT STORYBOARD: Reducing Purchase Order Lead Time by 33% Using Lean Six S...PROJECT STORYBOARD: Reducing Purchase Order Lead Time by 33% Using Lean Six S...
PROJECT STORYBOARD: Reducing Purchase Order Lead Time by 33% Using Lean Six S...GoLeanSixSigma.com
 
Six-Sigma-Black-Belt-Project-sample
Six-Sigma-Black-Belt-Project-sampleSix-Sigma-Black-Belt-Project-sample
Six-Sigma-Black-Belt-Project-sampleDheerendra S Negi
 
Measure phase lean six sigma tollgate template
Measure phase   lean six sigma tollgate templateMeasure phase   lean six sigma tollgate template
Measure phase lean six sigma tollgate templateSteven Bonacorsi
 
six sigma DMAIC approach for reducing quality defects of camshaft binding pro...
six sigma DMAIC approach for reducing quality defects of camshaft binding pro...six sigma DMAIC approach for reducing quality defects of camshaft binding pro...
six sigma DMAIC approach for reducing quality defects of camshaft binding pro...Niranjana B
 
Control phase lean six sigma tollgate template
Control phase   lean six sigma tollgate templateControl phase   lean six sigma tollgate template
Control phase lean six sigma tollgate templateSteven Bonacorsi
 
Six sigma case study-a good approach with example
Six sigma case study-a good approach with exampleSix sigma case study-a good approach with example
Six sigma case study-a good approach with examplebhanutomar
 
D05 Define VOC, VOB and CTQ
D05 Define VOC, VOB and CTQD05 Define VOC, VOB and CTQ
D05 Define VOC, VOB and CTQLeanleaders.org
 
Improve On-time deliveries_ Lean Six Sigma Green Belt Project
Improve On-time deliveries_ Lean Six Sigma Green Belt ProjectImprove On-time deliveries_ Lean Six Sigma Green Belt Project
Improve On-time deliveries_ Lean Six Sigma Green Belt ProjectMahit Ohri
 
DMAIC Methodolgy
DMAIC MethodolgyDMAIC Methodolgy
DMAIC MethodolgyBharath M
 
PROJECT STORYBOARD: Reducing Cycle Time for Natural Disaster Response by 50%
PROJECT STORYBOARD: Reducing Cycle Time for Natural Disaster Response by 50%PROJECT STORYBOARD: Reducing Cycle Time for Natural Disaster Response by 50%
PROJECT STORYBOARD: Reducing Cycle Time for Natural Disaster Response by 50%GoLeanSixSigma.com
 
Lean, Six Sigma, ToC using DMAIC - Measure phase
Lean, Six Sigma, ToC using DMAIC - Measure phase Lean, Six Sigma, ToC using DMAIC - Measure phase
Lean, Six Sigma, ToC using DMAIC - Measure phase Simon Misiewicz
 

Tendances (20)

Value Stream Mapping
Value Stream MappingValue Stream Mapping
Value Stream Mapping
 
Green Belt Project Storyboard Template Example
Green Belt Project Storyboard Template Example Green Belt Project Storyboard Template Example
Green Belt Project Storyboard Template Example
 
Lean Six Sigma Projects
Lean Six Sigma ProjectsLean Six Sigma Projects
Lean Six Sigma Projects
 
Value Stream Mapping: From Tool to Management Practice
Value Stream Mapping: From Tool to Management PracticeValue Stream Mapping: From Tool to Management Practice
Value Stream Mapping: From Tool to Management Practice
 
Lean, Six Sigma, ToC using DMAIC project management
Lean, Six Sigma, ToC  using DMAIC project managementLean, Six Sigma, ToC  using DMAIC project management
Lean, Six Sigma, ToC using DMAIC project management
 
PROJECT STORYBOARD: Reducing Purchase Order Lead Time by 33% Using Lean Six S...
PROJECT STORYBOARD: Reducing Purchase Order Lead Time by 33% Using Lean Six S...PROJECT STORYBOARD: Reducing Purchase Order Lead Time by 33% Using Lean Six S...
PROJECT STORYBOARD: Reducing Purchase Order Lead Time by 33% Using Lean Six S...
 
Dmaic
DmaicDmaic
Dmaic
 
Six-Sigma-Black-Belt-Project-sample
Six-Sigma-Black-Belt-Project-sampleSix-Sigma-Black-Belt-Project-sample
Six-Sigma-Black-Belt-Project-sample
 
Measure phase lean six sigma tollgate template
Measure phase   lean six sigma tollgate templateMeasure phase   lean six sigma tollgate template
Measure phase lean six sigma tollgate template
 
six sigma DMAIC approach for reducing quality defects of camshaft binding pro...
six sigma DMAIC approach for reducing quality defects of camshaft binding pro...six sigma DMAIC approach for reducing quality defects of camshaft binding pro...
six sigma DMAIC approach for reducing quality defects of camshaft binding pro...
 
Control phase lean six sigma tollgate template
Control phase   lean six sigma tollgate templateControl phase   lean six sigma tollgate template
Control phase lean six sigma tollgate template
 
Six sigma case study-a good approach with example
Six sigma case study-a good approach with exampleSix sigma case study-a good approach with example
Six sigma case study-a good approach with example
 
D05 Define VOC, VOB and CTQ
D05 Define VOC, VOB and CTQD05 Define VOC, VOB and CTQ
D05 Define VOC, VOB and CTQ
 
13. value stream mapping
13. value stream mapping13. value stream mapping
13. value stream mapping
 
Improve On-time deliveries_ Lean Six Sigma Green Belt Project
Improve On-time deliveries_ Lean Six Sigma Green Belt ProjectImprove On-time deliveries_ Lean Six Sigma Green Belt Project
Improve On-time deliveries_ Lean Six Sigma Green Belt Project
 
DMAIC Methodolgy
DMAIC MethodolgyDMAIC Methodolgy
DMAIC Methodolgy
 
PROJECT STORYBOARD: Reducing Cycle Time for Natural Disaster Response by 50%
PROJECT STORYBOARD: Reducing Cycle Time for Natural Disaster Response by 50%PROJECT STORYBOARD: Reducing Cycle Time for Natural Disaster Response by 50%
PROJECT STORYBOARD: Reducing Cycle Time for Natural Disaster Response by 50%
 
Process mapping
Process mappingProcess mapping
Process mapping
 
Value Stream Mapping
Value Stream MappingValue Stream Mapping
Value Stream Mapping
 
Lean, Six Sigma, ToC using DMAIC - Measure phase
Lean, Six Sigma, ToC using DMAIC - Measure phase Lean, Six Sigma, ToC using DMAIC - Measure phase
Lean, Six Sigma, ToC using DMAIC - Measure phase
 

En vedette

How Lean Six Sigma Helps You Get A Job - GoLeanSixSigma.com
How Lean Six Sigma Helps You Get A Job - GoLeanSixSigma.comHow Lean Six Sigma Helps You Get A Job - GoLeanSixSigma.com
How Lean Six Sigma Helps You Get A Job - GoLeanSixSigma.comGoLeanSixSigma.com
 
How The City of San Antonio Increased Payments For Street Maintenance Using L...
How The City of San Antonio Increased Payments For Street Maintenance Using L...How The City of San Antonio Increased Payments For Street Maintenance Using L...
How The City of San Antonio Increased Payments For Street Maintenance Using L...GoLeanSixSigma.com
 
SUCCESS STORY: Streamlining the Architectural, Engineering and Professional (...
SUCCESS STORY: Streamlining the Architectural, Engineering and Professional (...SUCCESS STORY: Streamlining the Architectural, Engineering and Professional (...
SUCCESS STORY: Streamlining the Architectural, Engineering and Professional (...GoLeanSixSigma.com
 
Six Sigma the best ppt
Six Sigma the best pptSix Sigma the best ppt
Six Sigma the best pptRabia Sgh S
 
How To Control Your Blood Sugar Using Lean Six Sigma - GoLeanSixSigma.com
How To Control Your Blood Sugar Using Lean Six Sigma - GoLeanSixSigma.comHow To Control Your Blood Sugar Using Lean Six Sigma - GoLeanSixSigma.com
How To Control Your Blood Sugar Using Lean Six Sigma - GoLeanSixSigma.comGoLeanSixSigma.com
 
SUCCESS STORY: King County Walks The Talk With Chris Franco
SUCCESS STORY: King County Walks The Talk With Chris FrancoSUCCESS STORY: King County Walks The Talk With Chris Franco
SUCCESS STORY: King County Walks The Talk With Chris FrancoGoLeanSixSigma.com
 
How To Select The Right Improvement Project
How To Select The Right Improvement ProjectHow To Select The Right Improvement Project
How To Select The Right Improvement ProjectGoLeanSixSigma.com
 
WEBINAR: Introduction to Lean (ENCORE!)
WEBINAR: Introduction to Lean (ENCORE!)WEBINAR: Introduction to Lean (ENCORE!)
WEBINAR: Introduction to Lean (ENCORE!)GoLeanSixSigma.com
 
Harnessing The Power of 5S and Visual Management with GoLeanSixSigma.com
Harnessing The Power of 5S and Visual Management with GoLeanSixSigma.comHarnessing The Power of 5S and Visual Management with GoLeanSixSigma.com
Harnessing The Power of 5S and Visual Management with GoLeanSixSigma.comGoLeanSixSigma.com
 
How to Set Up and Run Hypothesis Tests
How to Set Up and Run Hypothesis TestsHow to Set Up and Run Hypothesis Tests
How to Set Up and Run Hypothesis TestsGoLeanSixSigma.com
 
How To Facilitate a Process Improvement Team to Success with GoLeanSixSigma.com
How To Facilitate a Process Improvement Team to Success with GoLeanSixSigma.comHow To Facilitate a Process Improvement Team to Success with GoLeanSixSigma.com
How To Facilitate a Process Improvement Team to Success with GoLeanSixSigma.comGoLeanSixSigma.com
 
How to Rollout Lean Six Sigma Training
How to Rollout Lean Six Sigma TrainingHow to Rollout Lean Six Sigma Training
How to Rollout Lean Six Sigma TrainingGoLeanSixSigma.com
 
How to Create a Strategic Plan for a Lean Six Sigma Program Office
How to Create a Strategic Plan for a Lean Six Sigma Program OfficeHow to Create a Strategic Plan for a Lean Six Sigma Program Office
How to Create a Strategic Plan for a Lean Six Sigma Program OfficeGoLeanSixSigma.com
 
Introduction to Lean Six Sigma
Introduction to Lean Six SigmaIntroduction to Lean Six Sigma
Introduction to Lean Six SigmaGoLeanSixSigma.com
 
SUCCESS STORY: Improving Position Eligibility by Identifying & Eliminating Wa...
SUCCESS STORY: Improving Position Eligibility by Identifying & Eliminating Wa...SUCCESS STORY: Improving Position Eligibility by Identifying & Eliminating Wa...
SUCCESS STORY: Improving Position Eligibility by Identifying & Eliminating Wa...GoLeanSixSigma.com
 
Example Communication & Training Plan
Example Communication & Training PlanExample Communication & Training Plan
Example Communication & Training PlanKristin Scott
 
Bahama Bistro Swimlane Map - Full Length As Is
Bahama Bistro Swimlane Map - Full Length As IsBahama Bistro Swimlane Map - Full Length As Is
Bahama Bistro Swimlane Map - Full Length As IsGoLeanSixSigma.com
 

En vedette (20)

How Lean Six Sigma Helps You Get A Job - GoLeanSixSigma.com
How Lean Six Sigma Helps You Get A Job - GoLeanSixSigma.comHow Lean Six Sigma Helps You Get A Job - GoLeanSixSigma.com
How Lean Six Sigma Helps You Get A Job - GoLeanSixSigma.com
 
Six Sigma Sample Project
Six Sigma Sample ProjectSix Sigma Sample Project
Six Sigma Sample Project
 
How The City of San Antonio Increased Payments For Street Maintenance Using L...
How The City of San Antonio Increased Payments For Street Maintenance Using L...How The City of San Antonio Increased Payments For Street Maintenance Using L...
How The City of San Antonio Increased Payments For Street Maintenance Using L...
 
Six sigma green belt project roadmap in 10 deliverables 2013 07
Six sigma green belt project roadmap in 10 deliverables 2013 07Six sigma green belt project roadmap in 10 deliverables 2013 07
Six sigma green belt project roadmap in 10 deliverables 2013 07
 
SUCCESS STORY: Streamlining the Architectural, Engineering and Professional (...
SUCCESS STORY: Streamlining the Architectural, Engineering and Professional (...SUCCESS STORY: Streamlining the Architectural, Engineering and Professional (...
SUCCESS STORY: Streamlining the Architectural, Engineering and Professional (...
 
Six Sigma the best ppt
Six Sigma the best pptSix Sigma the best ppt
Six Sigma the best ppt
 
How To Control Your Blood Sugar Using Lean Six Sigma - GoLeanSixSigma.com
How To Control Your Blood Sugar Using Lean Six Sigma - GoLeanSixSigma.comHow To Control Your Blood Sugar Using Lean Six Sigma - GoLeanSixSigma.com
How To Control Your Blood Sugar Using Lean Six Sigma - GoLeanSixSigma.com
 
SUCCESS STORY: King County Walks The Talk With Chris Franco
SUCCESS STORY: King County Walks The Talk With Chris FrancoSUCCESS STORY: King County Walks The Talk With Chris Franco
SUCCESS STORY: King County Walks The Talk With Chris Franco
 
How To Select The Right Improvement Project
How To Select The Right Improvement ProjectHow To Select The Right Improvement Project
How To Select The Right Improvement Project
 
WEBINAR: Introduction to Lean (ENCORE!)
WEBINAR: Introduction to Lean (ENCORE!)WEBINAR: Introduction to Lean (ENCORE!)
WEBINAR: Introduction to Lean (ENCORE!)
 
Harnessing The Power of 5S and Visual Management with GoLeanSixSigma.com
Harnessing The Power of 5S and Visual Management with GoLeanSixSigma.comHarnessing The Power of 5S and Visual Management with GoLeanSixSigma.com
Harnessing The Power of 5S and Visual Management with GoLeanSixSigma.com
 
How to Set Up and Run Hypothesis Tests
How to Set Up and Run Hypothesis TestsHow to Set Up and Run Hypothesis Tests
How to Set Up and Run Hypothesis Tests
 
How To Facilitate a Process Improvement Team to Success with GoLeanSixSigma.com
How To Facilitate a Process Improvement Team to Success with GoLeanSixSigma.comHow To Facilitate a Process Improvement Team to Success with GoLeanSixSigma.com
How To Facilitate a Process Improvement Team to Success with GoLeanSixSigma.com
 
How to Rollout Lean Six Sigma Training
How to Rollout Lean Six Sigma TrainingHow to Rollout Lean Six Sigma Training
How to Rollout Lean Six Sigma Training
 
How to Create a Strategic Plan for a Lean Six Sigma Program Office
How to Create a Strategic Plan for a Lean Six Sigma Program OfficeHow to Create a Strategic Plan for a Lean Six Sigma Program Office
How to Create a Strategic Plan for a Lean Six Sigma Program Office
 
Introduction to Lean Six Sigma
Introduction to Lean Six SigmaIntroduction to Lean Six Sigma
Introduction to Lean Six Sigma
 
Lean Six Sigma: 5S In-Depth
Lean Six Sigma: 5S In-DepthLean Six Sigma: 5S In-Depth
Lean Six Sigma: 5S In-Depth
 
SUCCESS STORY: Improving Position Eligibility by Identifying & Eliminating Wa...
SUCCESS STORY: Improving Position Eligibility by Identifying & Eliminating Wa...SUCCESS STORY: Improving Position Eligibility by Identifying & Eliminating Wa...
SUCCESS STORY: Improving Position Eligibility by Identifying & Eliminating Wa...
 
Example Communication & Training Plan
Example Communication & Training PlanExample Communication & Training Plan
Example Communication & Training Plan
 
Bahama Bistro Swimlane Map - Full Length As Is
Bahama Bistro Swimlane Map - Full Length As IsBahama Bistro Swimlane Map - Full Length As Is
Bahama Bistro Swimlane Map - Full Length As Is
 

Similaire à How A Single Black Belt Project Jump Starts a Successful Lean Six Sigma Effort

Baskaren Accomplishments Summary
Baskaren Accomplishments SummaryBaskaren Accomplishments Summary
Baskaren Accomplishments Summaryguest524810
 
Integration of modules on site _ final
Integration of modules on site _ finalIntegration of modules on site _ final
Integration of modules on site _ finalScott Coombes
 
Curriculum Vitae-Ashish Trivedi
Curriculum Vitae-Ashish TrivediCurriculum Vitae-Ashish Trivedi
Curriculum Vitae-Ashish TrivediAshish Trivedi
 
Storyboard_SPS_Payroll
Storyboard_SPS_PayrollStoryboard_SPS_Payroll
Storyboard_SPS_PayrollBalaguru SP
 
Lean Management
Lean ManagementLean Management
Lean ManagementAshish Dev
 
Team c powerpoint presentation w6
Team c powerpoint presentation w6Team c powerpoint presentation w6
Team c powerpoint presentation w6Craig Parr
 
Architecture presentation 9
Architecture presentation 9Architecture presentation 9
Architecture presentation 9Anoush Ghamsari
 
Manufacturing Engineer S-TANAYA RESUME
Manufacturing Engineer S-TANAYA RESUMEManufacturing Engineer S-TANAYA RESUME
Manufacturing Engineer S-TANAYA RESUMEStefanus Tanaya
 
Manufacturing Engineer S-TANAYA RESUME
Manufacturing Engineer S-TANAYA RESUMEManufacturing Engineer S-TANAYA RESUME
Manufacturing Engineer S-TANAYA RESUMEStefanus Tanaya
 
Manufacturing Engineer S-TANAYA RESUME
Manufacturing Engineer S-TANAYA RESUMEManufacturing Engineer S-TANAYA RESUME
Manufacturing Engineer S-TANAYA RESUMEStefanus Tanaya
 
Manufacturing Engineer S-TANAYA RESUME
Manufacturing Engineer S-TANAYA RESUMEManufacturing Engineer S-TANAYA RESUME
Manufacturing Engineer S-TANAYA RESUMEStefanus Tanaya
 
Manufacturing Engineer S-TANAYA RESUME
Manufacturing Engineer S-TANAYA RESUMEManufacturing Engineer S-TANAYA RESUME
Manufacturing Engineer S-TANAYA RESUMEStefanus Tanaya
 

Similaire à How A Single Black Belt Project Jump Starts a Successful Lean Six Sigma Effort (20)

LeanSixSigmaProjectPresentation
LeanSixSigmaProjectPresentationLeanSixSigmaProjectPresentation
LeanSixSigmaProjectPresentation
 
Baskaren Accomplishments Summary
Baskaren Accomplishments SummaryBaskaren Accomplishments Summary
Baskaren Accomplishments Summary
 
Tollgate Presentation
Tollgate PresentationTollgate Presentation
Tollgate Presentation
 
Integration of modules on site _ final
Integration of modules on site _ finalIntegration of modules on site _ final
Integration of modules on site _ final
 
Curriculum Vitae-Ashish Trivedi
Curriculum Vitae-Ashish TrivediCurriculum Vitae-Ashish Trivedi
Curriculum Vitae-Ashish Trivedi
 
Storyboard_SPS_Payroll
Storyboard_SPS_PayrollStoryboard_SPS_Payroll
Storyboard_SPS_Payroll
 
Planning Presentation1
Planning Presentation1Planning Presentation1
Planning Presentation1
 
Scott E Huston Resume
Scott E Huston ResumeScott E Huston Resume
Scott E Huston Resume
 
Final April 18 LMKAIZEN
Final April 18 LMKAIZENFinal April 18 LMKAIZEN
Final April 18 LMKAIZEN
 
Lean Management
Lean ManagementLean Management
Lean Management
 
Team c powerpoint presentation w6
Team c powerpoint presentation w6Team c powerpoint presentation w6
Team c powerpoint presentation w6
 
Value stream mapping
Value stream mappingValue stream mapping
Value stream mapping
 
May 01 Resume[1]
May 01 Resume[1]May 01 Resume[1]
May 01 Resume[1]
 
2015 Toronto Section Presentation
2015 Toronto Section Presentation2015 Toronto Section Presentation
2015 Toronto Section Presentation
 
Architecture presentation 9
Architecture presentation 9Architecture presentation 9
Architecture presentation 9
 
Manufacturing Engineer S-TANAYA RESUME
Manufacturing Engineer S-TANAYA RESUMEManufacturing Engineer S-TANAYA RESUME
Manufacturing Engineer S-TANAYA RESUME
 
Manufacturing Engineer S-TANAYA RESUME
Manufacturing Engineer S-TANAYA RESUMEManufacturing Engineer S-TANAYA RESUME
Manufacturing Engineer S-TANAYA RESUME
 
Manufacturing Engineer S-TANAYA RESUME
Manufacturing Engineer S-TANAYA RESUMEManufacturing Engineer S-TANAYA RESUME
Manufacturing Engineer S-TANAYA RESUME
 
Manufacturing Engineer S-TANAYA RESUME
Manufacturing Engineer S-TANAYA RESUMEManufacturing Engineer S-TANAYA RESUME
Manufacturing Engineer S-TANAYA RESUME
 
Manufacturing Engineer S-TANAYA RESUME
Manufacturing Engineer S-TANAYA RESUMEManufacturing Engineer S-TANAYA RESUME
Manufacturing Engineer S-TANAYA RESUME
 

Plus de GoLeanSixSigma.com

Webinar: Process Improvement in Government Using Lean Six Sigma
Webinar: Process Improvement in Government Using Lean Six SigmaWebinar: Process Improvement in Government Using Lean Six Sigma
Webinar: Process Improvement in Government Using Lean Six SigmaGoLeanSixSigma.com
 
Webinar: How to Create Predictable Cash Flow With Lean Six Sigma Projects
Webinar: How to Create Predictable Cash Flow With Lean Six Sigma ProjectsWebinar: How to Create Predictable Cash Flow With Lean Six Sigma Projects
Webinar: How to Create Predictable Cash Flow With Lean Six Sigma ProjectsGoLeanSixSigma.com
 
Webinar: How Soldiers Receive 100% Funding for Lean Six Sigma Certification
Webinar: How Soldiers Receive 100% Funding for Lean Six Sigma CertificationWebinar: How Soldiers Receive 100% Funding for Lean Six Sigma Certification
Webinar: How Soldiers Receive 100% Funding for Lean Six Sigma CertificationGoLeanSixSigma.com
 
Webinar: 10 Tips for a Standout Lean Six Sigma Green Belt Project
Webinar: 10 Tips for a Standout Lean Six Sigma Green Belt ProjectWebinar: 10 Tips for a Standout Lean Six Sigma Green Belt Project
Webinar: 10 Tips for a Standout Lean Six Sigma Green Belt ProjectGoLeanSixSigma.com
 
Webinar: How Army Soldiers Can Advance Their Careers With Green Belt Training...
Webinar: How Army Soldiers Can Advance Their Careers With Green Belt Training...Webinar: How Army Soldiers Can Advance Their Careers With Green Belt Training...
Webinar: How Army Soldiers Can Advance Their Careers With Green Belt Training...GoLeanSixSigma.com
 
Webinar: Going Remote - How Process Improvement Teams Collaborate Virtually
Webinar: Going Remote - How Process Improvement Teams Collaborate VirtuallyWebinar: Going Remote - How Process Improvement Teams Collaborate Virtually
Webinar: Going Remote - How Process Improvement Teams Collaborate VirtuallyGoLeanSixSigma.com
 
How to Request Army Credentialing Assistance on ArmyIgnited.com
How to Request Army Credentialing Assistance on ArmyIgnited.comHow to Request Army Credentialing Assistance on ArmyIgnited.com
How to Request Army Credentialing Assistance on ArmyIgnited.comGoLeanSixSigma.com
 
Webinar: Remote Learning - How to Successfully Switch Lean Six Sigma Training...
Webinar: Remote Learning - How to Successfully Switch Lean Six Sigma Training...Webinar: Remote Learning - How to Successfully Switch Lean Six Sigma Training...
Webinar: Remote Learning - How to Successfully Switch Lean Six Sigma Training...GoLeanSixSigma.com
 
Webinar: How Tax Preparers & Accountants Can Increase Their Profitability Usi...
Webinar: How Tax Preparers & Accountants Can Increase Their Profitability Usi...Webinar: How Tax Preparers & Accountants Can Increase Their Profitability Usi...
Webinar: How Tax Preparers & Accountants Can Increase Their Profitability Usi...GoLeanSixSigma.com
 
Webinar: Remote Learning - How to Brainstorm Lean Six Sigma Improvement Ideas
Webinar: Remote Learning - How to Brainstorm Lean Six Sigma Improvement IdeasWebinar: Remote Learning - How to Brainstorm Lean Six Sigma Improvement Ideas
Webinar: Remote Learning - How to Brainstorm Lean Six Sigma Improvement IdeasGoLeanSixSigma.com
 
Webinar: How to Facilitate Successful Virtual Kaizen Events
Webinar: How to Facilitate Successful Virtual Kaizen EventsWebinar: How to Facilitate Successful Virtual Kaizen Events
Webinar: How to Facilitate Successful Virtual Kaizen EventsGoLeanSixSigma.com
 
Webinar: Online Green Belt Workshop Information Session
Webinar: Online Green Belt Workshop Information SessionWebinar: Online Green Belt Workshop Information Session
Webinar: Online Green Belt Workshop Information SessionGoLeanSixSigma.com
 
Webinar: Online Green Belt Information Session
Webinar: Online Green Belt Information SessionWebinar: Online Green Belt Information Session
Webinar: Online Green Belt Information SessionGoLeanSixSigma.com
 
Webinar: Going Virtual - How to Coach Problem Solvers on A3s
Webinar: Going Virtual - How to Coach Problem Solvers on A3sWebinar: Going Virtual - How to Coach Problem Solvers on A3s
Webinar: Going Virtual - How to Coach Problem Solvers on A3sGoLeanSixSigma.com
 
Webinar: How to Manage Your Project to Completion Using the Project Builder
Webinar: How to Manage Your Project to Completion Using the Project BuilderWebinar: How to Manage Your Project to Completion Using the Project Builder
Webinar: How to Manage Your Project to Completion Using the Project BuilderGoLeanSixSigma.com
 
Webinar: DMAIC: Common Challenges & How to Overcome Them
Webinar: DMAIC: Common Challenges & How to Overcome ThemWebinar: DMAIC: Common Challenges & How to Overcome Them
Webinar: DMAIC: Common Challenges & How to Overcome ThemGoLeanSixSigma.com
 
WEBINAR: How to Deploy Lean Six Sigma in Your Organization
WEBINAR: How to Deploy Lean Six Sigma in Your OrganizationWEBINAR: How to Deploy Lean Six Sigma in Your Organization
WEBINAR: How to Deploy Lean Six Sigma in Your OrganizationGoLeanSixSigma.com
 
WEBINAR: Introduction to Process Management
WEBINAR: Introduction to Process ManagementWEBINAR: Introduction to Process Management
WEBINAR: Introduction to Process ManagementGoLeanSixSigma.com
 
Webinar: How to Use a Fishbone Diagram (Encore!)
Webinar: How to Use a Fishbone Diagram (Encore!)Webinar: How to Use a Fishbone Diagram (Encore!)
Webinar: How to Use a Fishbone Diagram (Encore!)GoLeanSixSigma.com
 
WEBINAR: Introduction to Value Stream Mapping
WEBINAR: Introduction to Value Stream MappingWEBINAR: Introduction to Value Stream Mapping
WEBINAR: Introduction to Value Stream MappingGoLeanSixSigma.com
 

Plus de GoLeanSixSigma.com (20)

Webinar: Process Improvement in Government Using Lean Six Sigma
Webinar: Process Improvement in Government Using Lean Six SigmaWebinar: Process Improvement in Government Using Lean Six Sigma
Webinar: Process Improvement in Government Using Lean Six Sigma
 
Webinar: How to Create Predictable Cash Flow With Lean Six Sigma Projects
Webinar: How to Create Predictable Cash Flow With Lean Six Sigma ProjectsWebinar: How to Create Predictable Cash Flow With Lean Six Sigma Projects
Webinar: How to Create Predictable Cash Flow With Lean Six Sigma Projects
 
Webinar: How Soldiers Receive 100% Funding for Lean Six Sigma Certification
Webinar: How Soldiers Receive 100% Funding for Lean Six Sigma CertificationWebinar: How Soldiers Receive 100% Funding for Lean Six Sigma Certification
Webinar: How Soldiers Receive 100% Funding for Lean Six Sigma Certification
 
Webinar: 10 Tips for a Standout Lean Six Sigma Green Belt Project
Webinar: 10 Tips for a Standout Lean Six Sigma Green Belt ProjectWebinar: 10 Tips for a Standout Lean Six Sigma Green Belt Project
Webinar: 10 Tips for a Standout Lean Six Sigma Green Belt Project
 
Webinar: How Army Soldiers Can Advance Their Careers With Green Belt Training...
Webinar: How Army Soldiers Can Advance Their Careers With Green Belt Training...Webinar: How Army Soldiers Can Advance Their Careers With Green Belt Training...
Webinar: How Army Soldiers Can Advance Their Careers With Green Belt Training...
 
Webinar: Going Remote - How Process Improvement Teams Collaborate Virtually
Webinar: Going Remote - How Process Improvement Teams Collaborate VirtuallyWebinar: Going Remote - How Process Improvement Teams Collaborate Virtually
Webinar: Going Remote - How Process Improvement Teams Collaborate Virtually
 
How to Request Army Credentialing Assistance on ArmyIgnited.com
How to Request Army Credentialing Assistance on ArmyIgnited.comHow to Request Army Credentialing Assistance on ArmyIgnited.com
How to Request Army Credentialing Assistance on ArmyIgnited.com
 
Webinar: Remote Learning - How to Successfully Switch Lean Six Sigma Training...
Webinar: Remote Learning - How to Successfully Switch Lean Six Sigma Training...Webinar: Remote Learning - How to Successfully Switch Lean Six Sigma Training...
Webinar: Remote Learning - How to Successfully Switch Lean Six Sigma Training...
 
Webinar: How Tax Preparers & Accountants Can Increase Their Profitability Usi...
Webinar: How Tax Preparers & Accountants Can Increase Their Profitability Usi...Webinar: How Tax Preparers & Accountants Can Increase Their Profitability Usi...
Webinar: How Tax Preparers & Accountants Can Increase Their Profitability Usi...
 
Webinar: Remote Learning - How to Brainstorm Lean Six Sigma Improvement Ideas
Webinar: Remote Learning - How to Brainstorm Lean Six Sigma Improvement IdeasWebinar: Remote Learning - How to Brainstorm Lean Six Sigma Improvement Ideas
Webinar: Remote Learning - How to Brainstorm Lean Six Sigma Improvement Ideas
 
Webinar: How to Facilitate Successful Virtual Kaizen Events
Webinar: How to Facilitate Successful Virtual Kaizen EventsWebinar: How to Facilitate Successful Virtual Kaizen Events
Webinar: How to Facilitate Successful Virtual Kaizen Events
 
Webinar: Online Green Belt Workshop Information Session
Webinar: Online Green Belt Workshop Information SessionWebinar: Online Green Belt Workshop Information Session
Webinar: Online Green Belt Workshop Information Session
 
Webinar: Online Green Belt Information Session
Webinar: Online Green Belt Information SessionWebinar: Online Green Belt Information Session
Webinar: Online Green Belt Information Session
 
Webinar: Going Virtual - How to Coach Problem Solvers on A3s
Webinar: Going Virtual - How to Coach Problem Solvers on A3sWebinar: Going Virtual - How to Coach Problem Solvers on A3s
Webinar: Going Virtual - How to Coach Problem Solvers on A3s
 
Webinar: How to Manage Your Project to Completion Using the Project Builder
Webinar: How to Manage Your Project to Completion Using the Project BuilderWebinar: How to Manage Your Project to Completion Using the Project Builder
Webinar: How to Manage Your Project to Completion Using the Project Builder
 
Webinar: DMAIC: Common Challenges & How to Overcome Them
Webinar: DMAIC: Common Challenges & How to Overcome ThemWebinar: DMAIC: Common Challenges & How to Overcome Them
Webinar: DMAIC: Common Challenges & How to Overcome Them
 
WEBINAR: How to Deploy Lean Six Sigma in Your Organization
WEBINAR: How to Deploy Lean Six Sigma in Your OrganizationWEBINAR: How to Deploy Lean Six Sigma in Your Organization
WEBINAR: How to Deploy Lean Six Sigma in Your Organization
 
WEBINAR: Introduction to Process Management
WEBINAR: Introduction to Process ManagementWEBINAR: Introduction to Process Management
WEBINAR: Introduction to Process Management
 
Webinar: How to Use a Fishbone Diagram (Encore!)
Webinar: How to Use a Fishbone Diagram (Encore!)Webinar: How to Use a Fishbone Diagram (Encore!)
Webinar: How to Use a Fishbone Diagram (Encore!)
 
WEBINAR: Introduction to Value Stream Mapping
WEBINAR: Introduction to Value Stream MappingWEBINAR: Introduction to Value Stream Mapping
WEBINAR: Introduction to Value Stream Mapping
 

Dernier

Measures of Central Tendency: Mean, Median and Mode
Measures of Central Tendency: Mean, Median and ModeMeasures of Central Tendency: Mean, Median and Mode
Measures of Central Tendency: Mean, Median and ModeThiyagu K
 
Activity 01 - Artificial Culture (1).pdf
Activity 01 - Artificial Culture (1).pdfActivity 01 - Artificial Culture (1).pdf
Activity 01 - Artificial Culture (1).pdfciinovamais
 
microwave assisted reaction. General introduction
microwave assisted reaction. General introductionmicrowave assisted reaction. General introduction
microwave assisted reaction. General introductionMaksud Ahmed
 
“Oh GOSH! Reflecting on Hackteria's Collaborative Practices in a Global Do-It...
“Oh GOSH! Reflecting on Hackteria's Collaborative Practices in a Global Do-It...“Oh GOSH! Reflecting on Hackteria's Collaborative Practices in a Global Do-It...
“Oh GOSH! Reflecting on Hackteria's Collaborative Practices in a Global Do-It...Marc Dusseiller Dusjagr
 
Beyond the EU: DORA and NIS 2 Directive's Global Impact
Beyond the EU: DORA and NIS 2 Directive's Global ImpactBeyond the EU: DORA and NIS 2 Directive's Global Impact
Beyond the EU: DORA and NIS 2 Directive's Global ImpactPECB
 
Organic Name Reactions for the students and aspirants of Chemistry12th.pptx
Organic Name Reactions  for the students and aspirants of Chemistry12th.pptxOrganic Name Reactions  for the students and aspirants of Chemistry12th.pptx
Organic Name Reactions for the students and aspirants of Chemistry12th.pptxVS Mahajan Coaching Centre
 
Separation of Lanthanides/ Lanthanides and Actinides
Separation of Lanthanides/ Lanthanides and ActinidesSeparation of Lanthanides/ Lanthanides and Actinides
Separation of Lanthanides/ Lanthanides and ActinidesFatimaKhan178732
 
A Critique of the Proposed National Education Policy Reform
A Critique of the Proposed National Education Policy ReformA Critique of the Proposed National Education Policy Reform
A Critique of the Proposed National Education Policy ReformChameera Dedduwage
 
Employee wellbeing at the workplace.pptx
Employee wellbeing at the workplace.pptxEmployee wellbeing at the workplace.pptx
Employee wellbeing at the workplace.pptxNirmalaLoungPoorunde1
 
Grant Readiness 101 TechSoup and Remy Consulting
Grant Readiness 101 TechSoup and Remy ConsultingGrant Readiness 101 TechSoup and Remy Consulting
Grant Readiness 101 TechSoup and Remy ConsultingTechSoup
 
The basics of sentences session 2pptx copy.pptx
The basics of sentences session 2pptx copy.pptxThe basics of sentences session 2pptx copy.pptx
The basics of sentences session 2pptx copy.pptxheathfieldcps1
 
1029 - Danh muc Sach Giao Khoa 10 . pdf
1029 -  Danh muc Sach Giao Khoa 10 . pdf1029 -  Danh muc Sach Giao Khoa 10 . pdf
1029 - Danh muc Sach Giao Khoa 10 . pdfQucHHunhnh
 
Paris 2024 Olympic Geographies - an activity
Paris 2024 Olympic Geographies - an activityParis 2024 Olympic Geographies - an activity
Paris 2024 Olympic Geographies - an activityGeoBlogs
 
Q4-W6-Restating Informational Text Grade 3
Q4-W6-Restating Informational Text Grade 3Q4-W6-Restating Informational Text Grade 3
Q4-W6-Restating Informational Text Grade 3JemimahLaneBuaron
 
Arihant handbook biology for class 11 .pdf
Arihant handbook biology for class 11 .pdfArihant handbook biology for class 11 .pdf
Arihant handbook biology for class 11 .pdfchloefrazer622
 
How to Make a Pirate ship Primary Education.pptx
How to Make a Pirate ship Primary Education.pptxHow to Make a Pirate ship Primary Education.pptx
How to Make a Pirate ship Primary Education.pptxmanuelaromero2013
 
Kisan Call Centre - To harness potential of ICT in Agriculture by answer farm...
Kisan Call Centre - To harness potential of ICT in Agriculture by answer farm...Kisan Call Centre - To harness potential of ICT in Agriculture by answer farm...
Kisan Call Centre - To harness potential of ICT in Agriculture by answer farm...Krashi Coaching
 

Dernier (20)

Measures of Central Tendency: Mean, Median and Mode
Measures of Central Tendency: Mean, Median and ModeMeasures of Central Tendency: Mean, Median and Mode
Measures of Central Tendency: Mean, Median and Mode
 
INDIA QUIZ 2024 RLAC DELHI UNIVERSITY.pptx
INDIA QUIZ 2024 RLAC DELHI UNIVERSITY.pptxINDIA QUIZ 2024 RLAC DELHI UNIVERSITY.pptx
INDIA QUIZ 2024 RLAC DELHI UNIVERSITY.pptx
 
Activity 01 - Artificial Culture (1).pdf
Activity 01 - Artificial Culture (1).pdfActivity 01 - Artificial Culture (1).pdf
Activity 01 - Artificial Culture (1).pdf
 
microwave assisted reaction. General introduction
microwave assisted reaction. General introductionmicrowave assisted reaction. General introduction
microwave assisted reaction. General introduction
 
“Oh GOSH! Reflecting on Hackteria's Collaborative Practices in a Global Do-It...
“Oh GOSH! Reflecting on Hackteria's Collaborative Practices in a Global Do-It...“Oh GOSH! Reflecting on Hackteria's Collaborative Practices in a Global Do-It...
“Oh GOSH! Reflecting on Hackteria's Collaborative Practices in a Global Do-It...
 
Beyond the EU: DORA and NIS 2 Directive's Global Impact
Beyond the EU: DORA and NIS 2 Directive's Global ImpactBeyond the EU: DORA and NIS 2 Directive's Global Impact
Beyond the EU: DORA and NIS 2 Directive's Global Impact
 
Organic Name Reactions for the students and aspirants of Chemistry12th.pptx
Organic Name Reactions  for the students and aspirants of Chemistry12th.pptxOrganic Name Reactions  for the students and aspirants of Chemistry12th.pptx
Organic Name Reactions for the students and aspirants of Chemistry12th.pptx
 
Separation of Lanthanides/ Lanthanides and Actinides
Separation of Lanthanides/ Lanthanides and ActinidesSeparation of Lanthanides/ Lanthanides and Actinides
Separation of Lanthanides/ Lanthanides and Actinides
 
A Critique of the Proposed National Education Policy Reform
A Critique of the Proposed National Education Policy ReformA Critique of the Proposed National Education Policy Reform
A Critique of the Proposed National Education Policy Reform
 
Employee wellbeing at the workplace.pptx
Employee wellbeing at the workplace.pptxEmployee wellbeing at the workplace.pptx
Employee wellbeing at the workplace.pptx
 
Grant Readiness 101 TechSoup and Remy Consulting
Grant Readiness 101 TechSoup and Remy ConsultingGrant Readiness 101 TechSoup and Remy Consulting
Grant Readiness 101 TechSoup and Remy Consulting
 
Staff of Color (SOC) Retention Efforts DDSD
Staff of Color (SOC) Retention Efforts DDSDStaff of Color (SOC) Retention Efforts DDSD
Staff of Color (SOC) Retention Efforts DDSD
 
The basics of sentences session 2pptx copy.pptx
The basics of sentences session 2pptx copy.pptxThe basics of sentences session 2pptx copy.pptx
The basics of sentences session 2pptx copy.pptx
 
1029 - Danh muc Sach Giao Khoa 10 . pdf
1029 -  Danh muc Sach Giao Khoa 10 . pdf1029 -  Danh muc Sach Giao Khoa 10 . pdf
1029 - Danh muc Sach Giao Khoa 10 . pdf
 
Paris 2024 Olympic Geographies - an activity
Paris 2024 Olympic Geographies - an activityParis 2024 Olympic Geographies - an activity
Paris 2024 Olympic Geographies - an activity
 
Mattingly "AI & Prompt Design: The Basics of Prompt Design"
Mattingly "AI & Prompt Design: The Basics of Prompt Design"Mattingly "AI & Prompt Design: The Basics of Prompt Design"
Mattingly "AI & Prompt Design: The Basics of Prompt Design"
 
Q4-W6-Restating Informational Text Grade 3
Q4-W6-Restating Informational Text Grade 3Q4-W6-Restating Informational Text Grade 3
Q4-W6-Restating Informational Text Grade 3
 
Arihant handbook biology for class 11 .pdf
Arihant handbook biology for class 11 .pdfArihant handbook biology for class 11 .pdf
Arihant handbook biology for class 11 .pdf
 
How to Make a Pirate ship Primary Education.pptx
How to Make a Pirate ship Primary Education.pptxHow to Make a Pirate ship Primary Education.pptx
How to Make a Pirate ship Primary Education.pptx
 
Kisan Call Centre - To harness potential of ICT in Agriculture by answer farm...
Kisan Call Centre - To harness potential of ICT in Agriculture by answer farm...Kisan Call Centre - To harness potential of ICT in Agriculture by answer farm...
Kisan Call Centre - To harness potential of ICT in Agriculture by answer farm...
 

How A Single Black Belt Project Jump Starts a Successful Lean Six Sigma Effort

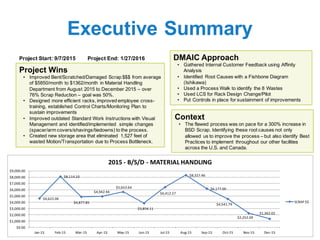
  • 1. Executive Summary Project Wins • Improved Bent/Scratched/Damaged Scrap $$$ from average of $5850/month to $1362/month in Material Handling Department from August 2015 to December 2015 – over 76% Scrap Reduction – goal was 50%. • Designed more efficient racks, improved employee cross- training, established Control Charts/Monitoring Plan to sustain improvements • Improved outdated Standard Work Instructions with Visual Management and identified/implemented simple changes (spacer/arm covers/shavings/tiedowns) to the process. • Created new storage area that eliminated 1,527 feet of wasted Motion/Transportation due to Process Bottleneck. DMAIC Approach • Gathered Internal Customer Feedback using Affinity Analysis • Identified Root Causes with a Fishbone Diagram (Ishikawa) • Used a Process Walk to identify the 8 Wastes • Used LCS for Rack Design Change/Pilot • Put Controls in place for sustainment of improvements Context • The flawed process was on pace for a 300% increase in BSD Scrap. Identifying these root causes not only allowed us to improve the process – but also identify Best Practices to implement throughout our other facilities across the U.S. and Canada. Project Start: 9/7/2015 Project End: 1/27/2016 $4,622.06 $8,114.10 $4,877.85 $4,942.94 $5,653.64 $3,854.11 $6,412.27 $8,327.46 $6,177.00 $4,541.79 $2,252.09 $1,362.02 $0.00 $1,000.00 $2,000.00 $3,000.00 $4,000.00 $5,000.00 $6,000.00 $7,000.00 $8,000.00 $9,000.00 Jan-15 Feb-15 Mar-15 Apr-15 May-15 Jun-15 Jul-15 Aug-15 Sep-15 Oct-15 Nov-15 Dec-15 2015 - B/S/D - MATERIAL HANDLING SCRAP $$
  • 2. Operational Definitions • Anodizing (ANO) – chemical coating process that converts metal stock lengths into a decorative, durable, corrosion-resistant finish • B/S/D = Bent/Scratched/Damaged Material • Bent Material – Material bowed in excess of 1/32” for every 4.5” in width (Max width is 9”) • Damaged Material – Any combination of Bent/Scratched metal in addition to any damage that occurs during transit • Extrusion (EXT) – process where metal logs are pushed through a die to create objects/shapes of a fixed profile • Paint (PNT) – process of pre-treating and adding full coats of primer and desired paint color along conveyor • Scratched Material – Any length scratch appearing in an exposed area of metal and/or scratch in excess of 3” in unexposed area of metal • Exposed Area – Any area of the metal that is on the exterior of the building or visible through a lite of glass • Unexposed Area – Any area of the metal that is not visible upon installation
  • 3. Define • Weighted Criteria Matrix • Project Charter • Collect VOC/Internal Customer Feedback (Affinity Analysis) • VOC Translation Matrix • High Level Map (SIPOC) • Process Walk Planning Checklist • Detailed Process Map (Swimlane) • Stakeholder Analysis • Relationship Map • Communication Plan • Pose and Answer
  • 5. Project CharterSubtitle Scrap $$$ for the Material Handling Dept. has risen to $5850/month in 2015 (January-August) for material marked as Bent/Scratched/Damaged. The Scrap $$$ in 2014 for the same category was just $2141/month. While the costs obviously hurt the bottom line, the inability to push a good quality product in a timely manner impacts delivery to our Assembly/Glazing Plants and eventually; runs the risk of missing Customer Due Dates. My organization's Strategy for 2015 was to create a culture of (1) Problem Solving and (2) Continuous Improvement. With B/S/D Scrap $$$ projected to jump almost 300% from 2014 to 2015, this cross-departmental project is our best opportunity to reduce scrap costs across the board while aligning our efforts with the Organizational Strategy. This project Problem Statement Goal Statement Business Case & Benefits The goal is to reduce Bent/Scratched/Damaged Scrap $$$ by 50% from $5850/month to $2925/month by the end of 4Q/2015. Timeline Preliminary Plan: Timeline Planned Actual Define 9/28/15 9/27/15 Measure 10/26/15 10/27/15 Analyze 11/16/15 11/19/15 Improve 12/14/15 12/24/15 Control Scope In/Out Process : Material Handling Department handles the flow of all Metal traveling from (1) Extrusion Presses, (2) Anodizing Lines, (3) Paint Department, (4) Packing/Shipping. They are the only department that touches all four areas of our Metal Processing Plant. Team Members Team Lead: Jeff (Quality Engineer/Green Belt) - 25% Team Member 1: Michael (Process Owner) - 20% Team Member 2: Dexter M. (Mat. Handler/Driver) - 15% Team Member 3: Vincent L. (Maintenance) - 15% Team Member 4: Jaxson P. (Material Handler) - 15% Team Member 5: Kevin Y. (Fabrication) - 5%
  • 6. VOC – AFFINITY ANALYSIS Customers of this Process-driven project are all internal departments (Extrusion, Anodizing, Paint). The feedback focused on three important factors:
  • 7. VOC Translation Matrix Customer Comment Gathering More Understanding Customer Requirement Skipping Visual Checks - bad material being ignored Customers want material reviewed at each process step Each Dept. (EXT/ANO/PAINT) along with Material Handling to initial traveler showing QC check performed Poorly conditioned (decaying/nails) racks scratching parts Customers want better racks to protect parts (consider re-design) Remove all decaying/defective racks from circulation - replace with new Material arriving out of order, items left waiting, not rushing jobs that should be Customers want to receive parts as needed and have a more organized scheduling system Daily schedule for flow of Material/Orders - sync across EXT/ANO/PNT Parts being stacked on exposed surfaces Customers want parts properly stacked to avoid scratches and double-handling All employees to receive training - signoff on process of stacking parts Metal spacers in circulation with no (or torn) sleeve covers Customers want spacers properly covered to prevent scratches to material Metal spacers to have kevlar sleeves replaced/stapled prior to loading parts Employees not aware if material can be reworked - assumed scrap Customer can prevent serious scrap $$$ by reworking material Relocate potential rework to MRB area so Dept Managers can sign-off/scrap Voice Of the Customer Translation Matrix
  • 8. SIPOC S I P O C Supplier Input Process Output Customer Extrusion Logs Extrusion Press Metal Stock Lengths Anodizing (Internal) Anodizing Anoding Tanks Metal Stock Lengths anodized (chemical coating) Anodized Coating Paint (Internal) Paint Paintline Primers - Full Coats of Paint Applied Painted Metal Shipping (Internal) Packing/Shipping Load Trucks Match Material to Orders Finished Goods General Contractors - Construction Firms (6) Relocate potential Rework to MRB area so Dept Managers can sign-off/scrap Training: (5) All employees to receive training - signoff on process of stacking parts SIPOC Extruded thru Dies (shapes) Customer Requirements: Quality: (1) Each Dept (EXT/ANO/PNT) and MH to initial traveler showing QC check (2) Remove all decaying/defective racks from circulation - replace with new (3) Metal Spacers have kevlar sleeves replaced/stapled prior to use OTIF: (4) Daily Schedule for flow of Material/Orders - sync across EXT/ANO/PAINT
  • 9. Process Walk Planning Activity Completed (Yes or No) Develop a high level map of the process to be “walked” (SIPOC, Spaghetti) Yes Create a list of all Process Walkers/Interviewers (Jeff, Michael) Yes Create a list of all Interviewees (Dexter M., Jaxson P., Steven R.) Yes Create a list of Stakeholders to be invited to the Stakeholder Presentation (Tim J., Paul K., Klay M., Wes B.) Yes Develop a Communication Plan for the event Yes Create a high level agenda for the Process Walk Yes Set a tentative date/time for Process Walk Orientation Yes List tentative dates/times and location for the Process Walk and the Stakeholder Update Yes List tentative dates/times and location for the Stakeholder Update (last day) Yes Process Walk Planning Checklist Notes: *Orientation/Walk/Interviews scheduled for 9/22-9/23/15
  • 11. Stakeholder Analysis Stakeholder/ Stakeholder Group Impact Level Level of Support Reason for Resistance or Support Action(s) to Address This Stakeholder Group Contact VP- MANUFACTURING DECISION AUTHORITY SUPPORTIVE FINANCIAL BACKING - WILL HELP CLEAR BARRIERS UPDATE/NOTIFYIF ANY PURCHASES OR MATERIAL NEEDED TIMJ. METAL PROC. MANAGER IMPACTS NEUTRAL AWARE OF PROBLEMBUT UNSURE EMPLOYEES CAN HANDLE CHANGES CREATE WORK INSTRUCTIONS/TRAINING OPPORTUNITIES EARLYIN THE PROCESS KLAYM. PLANT MGR AFFECTED RESISTANT AFRAID CHANGES COULD LEAD TO NON-VALUE ADDED TIME TO CURRENT PROCESS USE DATATO SHOW EXPECTED COST SAVINGS AND POTENTIAL LOSSES IF NOT ADDRESSED WES B. QUALITYTEAM DECISION AUTHORITY SUPPORTIVE ANXIOUS TO SHOW PROCESS IMPROVEMENT TEAMS CAN ADD VALUE TO THE ORGANIZATION CREATE USEFUL TEMPLATES/DOCUMENT STRATEGIES - IDENTIFY GOOD/BAD LESSONS LEARNED PAUL K. Stakeholder Analysis (Advanced) - DEFINE
  • 12. Relationship Map Project: Relationship Map BSD Scrap Reduction Project Decision Authority - Tim J. (VP- Manufacturing) Impacts Outcome - Klay M. (Metal Processing Mgr) Will Be Affected - Wes B. (Plant Mgr) Project Paul K. (Quality Dir)
  • 13. Communication Plan Stakeholder Group Objectives/Actions Desired Message Delivery Method/Venue Timing Communication Plan VP - Manufacturing Metal Processing Mgr Plant Manager Quality Team Communicate any financial limitations or restrictions - Support the Project Have leads/supervisors give full access to employees and help with training needs Enforce countermeasures and action plans put in place once root causes identified Support team members and encourage other departments to research future projects Potential changes to the racks/sleeves need to be explored for $$$ Email Bi-Weekly Allow time for Process Walks/Interviews to allow team to build knowledge of the current state 1-on-1/Email Weekly (Tues/Thurs) Assist Process Improvement Activities in focused areas and review data ($$) that backs up need for project Weekly Dept. Meetings Weekly (Tues/Thurs) Document Activities/Progression showing value of a culture change 1-on-1 Weekly
  • 14. Pose and Answer Pose & Answer - Influence Strategy Questions Answers What is important about this project? It is a broken/flawed process that impacts all departments of our plant. Why is this project important to do right now? The Scrap $$$ for BSD is in a freefall and on pace to triple our scrap from 2014 (thru 8 months). Why is this project more important than other pressing projects? Other projects can be handled in a 3-5 day Kaizen blitz - more of a quick fix. This project hits the bottom line more than others and has cross-functional impacts and best practices that can be gained. What problems will this project solve? It will identify the root causes for a plant-wide issue - for which currently there are none. How will this project help your colleagues? It will help specify process improvement activities in focused areas. How will the project help your manager? It gives my manager the ammunition (proof) that our Process Improvement Teams can work hand-in-hand with all departments and add value to the organization. In what ways does the business gain from this project? We will gather the lessons learned to fix the problem and put metrics together to prevent it from getting out of control. Draft Business Case What are some positive side effects of doing this project? The ultimate value will be the Best Practices created that can be crossed over and implemented throughout our other facilities across the United States and Canada. Other? My goal is to communicate (with proven results) to the shop employees, department managers, and upper level management that the Lean-Based Culture is something we need to completely adopt.
  • 15. Measure • Data Collection Planning • Bent Material (Visual Management) • Scratched Material (Visual Management) • Damaged Material (Visual Management) • Checksheets • Calculate Sampling Plan • Measurement Systems Analysis (MSA) • Baseline Measure Chart • Process Capability
  • 16. Data Collection Planning Measure Data Type Operational Definition Stratification Factors Sampling Notes Who and How BENT MATERIAL DISCRETE MATERIAL BOWED IN EXCESS OF 1/32" FOR EVERY 4.5" IN WIDTH (MAX WIDTH IS 9") (1) LOCATION (EXT/ANO/PAINT) (2) SHIFT (1st/2nd) SAMPLE EVERY 10TH RACK OF FG1101M (25 PIECES PER RACK/3 RACKS MAX) PER SHIFT EACH DAY FOR 5 DAYS (10/19-10/23) - 750 TOTAL PIECES SIMULTANEOUS FOR BENT, SCRATCHED, AND DAMAGED MATERIAL HANDLING TEAM - 1 RACK EACH AT EXT/ANO/PAINT - VISUAL INSPECTION - USE CHECKSHEET - FOLLOW MARKED RACKS FROM EXT TO ANO TO PAINT SCRATCHED MATERIAL DISCRETE ANY LENGTH SCRATCH APPEARING IN AN EXPOSED AREA OF METAL AND/OR SCRATCH IN EXCESS OF 3" IN UNEXPOSED AREA OF METAL (1) LOCATION (EXT/ANO/PAINT) (2) SHIFT (1st/2nd) SAMPLE EVERY 10TH RACK OF FG1101M (25 PIECES PER RACK/3 RACKS MAX) PER SHIFT EACH DAY FOR 5 DAYS (10/19-10/23) - 750 TOTAL PIECES SIMULTANEOUS FOR BENT, SCRATCHED, AND DAMAGED MATERIAL HANDLING TEAM - 1 RACK EACH AT EXT/ANO/PAINT - VISUAL INSPECTION - USE CHECKSHEET - FOLLOW MARKED RACKS FROM EXT TO ANO TO PAINT DAMAGED MATERIAL DISCRETE ANY COMBINATION OF BENT AND SCRATCHED METAL IN ADDITION TO ANY DAMAGE THAT OCCURS DURING TRANSIT OF MATERIAL (1) LOCATION (EXT/ANO/PAINT) (2) SHIFT (1st/2nd) SAMPLE EVERY 10TH RACK OF FG1101M (25 PIECES PER RACK/3 RACKS MAX) PER SHIFT EACH DAY FOR 5 DAYS (10/19-10/23) - 750 TOTAL PIECES SIMULTANEOUS FOR BENT, SCRATCHED, AND DAMAGED MATERIAL HANDLING TEAM - 1 RACK EACH AT EXT/ANO/PAINT - VISUAL INSPECTION - USE CHECKSHEET - FOLLOW MARKED RACKS FROM EXT TO ANO TO PAINT Data Collection Planning
  • 20. Checksheets B/S/D METAL CHECK DATE: B/S/D METAL CHECK DATE: TEAM: PART# TEAM: PART# SHIFT: LENGTH SHIFT: LENGTH LOCATION: PIECES: LOCATION: PIECES: TYPE COUNT QTY/RW COUNT TOTAL TYPE COUNT QTY/RW COUNT TOTAL Bent Bent Scratched Scratched Damage/Transit Damage/Transit B/S/D METAL CHECK DATE: B/S/D METAL CHECK DATE: TEAM: PART# TEAM: PART# SHIFT: LENGTH SHIFT: LENGTH LOCATION: PIECES: LOCATION: PIECES: TYPE COUNT QTY/RW COUNT TOTAL TYPE COUNT QTY/RW COUNT TOTAL Bent Bent Scratched Scratched Damage/Transit Damage/Transit B/S/D METAL CHECK DATE: B/S/D METAL CHECK DATE: TEAM: PART# TEAM: PART# SHIFT: LENGTH SHIFT: LENGTH LOCATION: PIECES: LOCATION: PIECES: TYPE COUNT QTY/RW COUNT TOTAL TYPE COUNT QTY/RW COUNT TOTAL Bent Bent Scratched Scratched Damage/Transit Damage/Transit B/S/D METAL CHECK DATE: B/S/D METAL CHECK DATE: TEAM: PART# TEAM: PART# SHIFT: LENGTH SHIFT: LENGTH LOCATION: PIECES: LOCATION: PIECES: TYPE COUNT QTY/RW COUNT TOTAL TYPE COUNT QTY/RW COUNT TOTAL Bent Bent Scratched Scratched Damage/Transit Damage/Transit *Mark any impacted piece with a (B) Bent, (S) Scratch, or (D) Damaged in unexposed area of metal
  • 21. Calculate Sampling Plan • Process Sampling (Live) • Stratified/Systematic • Ongoing – every 10th rack • 50% Estimate of Prop (worst case) • Stratification Factors 1. Location 2. Shift Sampling Calculation (Discrete) for Racks of BSD Material - MINITAB Parameter Proportion Distribution Binomial Proportion 0.5 Confidence level 95% Confidence interval Two-sided Results Margin Sample of Error Size 0.04 623 With a Metal Processing Plant and an unlimited amount of samples at my disposal – I chose to use the 50% Estimate of Proportion for a Worst-Case Scenario. This gives me a minimum sampling size of 623 pieces.
  • 22. MSA – Gage R&R (Discrete) 1. Standard/Reference – BSD Material referenced in Data Collection Planning Operational Definitions (Pg 16) 2. Appraisers/Operators – Dexter M. (1st Shift)/Jaxson P. (2nd shift) 3. Parts – WW400 – 20 total (14 good/6bad) – blind and unbiased (highlights) 4. Trials – Twice for each operator 5. Measurement/Response – 0=Defect, 1=Good GOOD DEFECT
  • 23. MSA - ContinuedAttribute Agreement Analysis for ASSESSED RESULT Date of study: 10/12/2015 Reported by: Jeff Owens Name of product: WW400 Misc: BB Project - Discrete MSA Analysis Within Appraisers Assessment Agreement Fleiss’ Kappa Statistics Appraiser Response Kappa SE Kappa Z P(vs > 0) A 0 0.856631 0.223607 3.83097 0.0001 1 0.856631 0.223607 3.83097 0.0001 B 0 0.687500 0.223607 3.07459 0.0011 1 0.687500 0.223607 3.07459 0.0011 Each Appraiser vs Standard Assessment Agreement Fleiss’ Kappa Statistics Appraiser Response Kappa SE Kappa Z P(vs > 0) A 0 0.803971 0.158114 5.08476 0.0000 1 0.803971 0.158114 5.08476 0.0000 B 0 0.722250 0.158114 4.56791 0.0000 1 0.722250 0.158114 4.56791 0.0000 Between Appraisers Assessment Agreement Fleiss’ Kappa Statistics Response Kappa SE Kappa Z P(vs > 0) 0 0.825708 0.0912871 9.04518 0.0000 1 0.825708 0.0912871 9.04518 0.0000 All Appraisers vs Standard Assessment Agreement Fleiss’ Kappa Statistics Response Kappa SE Kappa Z P(vs > 0) 0 0.763111 0.111803 6.82547 0.0000 1 0.763111 0.111803 6.82547 0.0000 In regards to the Appraisers vs. Standard – Fleiss’ Kappa readings remained marginal (between 0.70-0.90) BA 100 95 90 85 80 75 70 65 Appraiser Percent 95.0% CI Percent BA 100 95 90 85 80 75 70 65 Appraiser Percent 95.0% CI Percent Date of study: 10/12/2015 Reported by: Jeff Owens Name of product: WW400 Misc: BB Project - Discrete MSA Analysis Assessment Agreement Within Appraisers Appraiser vs Standard
  • 24. Baseline Measure Chart After running the baseline data – projections showed we had still made no progress towards our goal of reducing scrap to $2925/month $2,141.04 $5886.83 $5427.23 $0.00 $1,000.00 $2,000.00 $3,000.00 $4,000.00 $5,000.00 $6,000.00 $7,000.00 2014 Jan-Sept 2015 10/15 Baseline BSD Monthly Scrap - Material Handling
  • 25. Process Capability • DPU = # Defects/# Units = 422/750 = 0.56 • DPMO = 422/3000 x 1,000,000 = 140,667 (4 Opportunities) • Sigma Level = 2.5 (rounded down), 84.1% Yield (158,655) • Final Yield (Y Final) = # Good Units/# Total Units = 639/750 = 85.2% • First Pass Yield (YFP) = 750-422 = 328, 328/750 = 44% • Rolled Throughput Yield (YRTP) – EXT (61%), ANO (88%), PNT (93%) – .61 x .88 x .93 = 50%
  • 26. Analyze • 8 Wastes Checksheet • Fishbone Diagram • Data for Statistical Testing • Hypothesis Statement – One Proportion • Hypothesis Statement – Two Proportion • Hypothesis Statement – Chi-Square • Hypothesis Testing Plan Results
  • 27. 8 Wastes Checksheet Date: 9/23/2015 Waste Definition Examples Type "High", "Medium", "Low" Description of Issues - Inaccurate applications - Broken parts - Missed deadlines - Extra copies of reports - Redundant storage (hard & soft) - "Reply All" on emails - Waiting for approvals - Waiting for equipment - Waiting for large batches - Employees unable to make decisions - Employees not fully trained - Skilled employees doing unskilled tasks - Hand-offs between functions - Multiple reviews - Sending, resending emails - Stockpiling supplies - Information piling up for data entry - Keeping data longer than necessary - Repetitive key strokes - Walking between equipment - Switching applications - Extra formatting, extra fields - Extra features, excess detail - Extra report information The 8 Wastes Checksheet M Motion Any movement by people that is not of value to the customer Material between Extrusion and Anodizing is kept across street as in Transportation - badly need storage in these areas Poor Layout makes Inventory seem worse than it actually is Transportation Unnecessary movement of materials, information or equipment I Inventory Accumulation of parts, information, applications, etc. beyond what is required by the customer Only source of storage is across the street and the racks transporting material are in terrible shape - too much double-handling Material Handling throughout EXT/ANO/PNTProcess Area: D Defects Information, products and services that are incomplete or innacurate O Overproduction Making more of something - making it earlier or faster- than it's needed W Waiting Waiting for information, equipment, materials, parts or people There are a few Value-Enabling steps but overall not a significant issue E Extra- Processing Any steps that do not add value in the eyes of the customer Low High Low High N Non-Utilized Talent Not properly utilizing people's experience, skills, knowledge or creativity T Defects occurring at every stop (EXT/ANO/PNT) due to inability to follow work instructions, inspections, and safely/securely handle material transfer Not currently a problem - waiting seems to be as a result of the bottleneck in the Extrusion Ovens Mentioned above, cycle time for Extrusion is higher than Anodize and Paint combined. Work schedules would be better off altered. Lack of standard work and cross-training stands out - changing this could perhaps build more ownership among the employees High Low High Medium
  • 30. Hypothesis Statement – One Proportion Test According to past performance (2014), BSD Defect Rates were at 7% for Extrusion/Anodizing/Paint. The team suspects it’s getting worse due to the conditions of the wooden racks, which typically rot out within 3 years. Recent data has been collected and we want to know if BSD Defect Rates have risen. Note that current racks in circulation were built in early 2013. (X) = Time Period. NULL: Ho P = .07 (7%) ALTERNATE: Ha P ≠ .07 (7%) or P › .07 (7%) Test: One Proportion (Proportion compared to standard). In this case, we are determining if there is a difference between a historical level of defects and current defect levels.
  • 31. One Proportion Test Analysis Conclusion: BSD Defect Rates have truly gotten worse, jumping from 7% in 2014 to 11% in 2015. The P Value (0.000) is low (less than 0.05) so the Null must be rejected. The result of this test is True. Test and CI for One Proportion (MINITAB) Test of p = 0.07 vs p ≠ 0.07 Sample X N Sample p 95% CI Z-Value P-Value 1 69 630 0.109524 (0.085138, 0.133910) 3.89 0.000 Using the normal approximation. 0% 2% 4% 6% 8% 10% 12% 2014 2015 BSD DEFECT RATES – EXT/ANO/PNT BSD DEFECT RATES
  • 32. Hypothesis Statement – Two Proportion Test The team suspects that inadequate training to 2nd shift employees has resulted in more defects being allowed to pass on 2nd shift than 1st shift. This test will help us determine if there is a difference between the two. (X) = Work Shifts. P1 = 2nd shift, P2 = 1st shift. NULL: Ho P1 - P2 = 0 ALTERNATE: Ha P1 - P2 ≠ 0 Test: Two Proportion (Proportion of a data set against another) to see if one area is underperforming. Each shift will review the same sample size lot of 630 pieces in the Extrusion Area.
  • 33. Two Proportion Test Analysis Conclusion:BSD Defect Rates are significantly differentbetween the two shifts with 2nd shift allowing 14% ofdefects compared to 9% for 1st shift while reviewing the same lot of material.The P Value (0.006) is low (less than 0.05) so the Null must be rejected. The resultof this test is True. Test and CI for Two Proportions: 2nd Shift, 1st Shift (MINITAB) Event = Good Variable X N Sample p 2nd Shift 542 630 0.860317 1st Shift 573 630 0.909524 Difference = p (2nd Shift) - p (1st Shift) Estimate for difference: -0.0492063 95% CI for difference: (-0.0843421, -0.0140706) Test for difference = 0 (vs ≠ 0): Z = -2.74 P-Value = 0.006 Fisher’s exact test: P-Value = 0.008 0% 2% 4% 6% 8% 10% 12% 14% 2nd Shift 1st Shift BSD DEFECT RATES BSD DEFECT RATES
  • 34. Hypothesis Statement – Chi- Square The team suspects that better inspection is being done in the Paint Department compared to the Extrusion and Anodizing Departments. We will test Defect Rates in each department to see if there is truly a difference in the three. (X) = Departments. P1 = Paint, P2 = Extrusion, P3 = Anodizing. NULL: Ho P1 = P2 = P3 ALTERNATE: Ha P1 ≠ P2 ≠ P3 Test: Chi-Square (2 or more Proportions against each other). In this case, we are determining if there is a difference between defect rates in different departments (EXT/ANO/PNT) in order to find Best Practices for Inspection.
  • 35. Chi-Square Test Analysis Chi-Square Test – MINITAB Rows: Worksheet rows Columns: Worksheet columns EXTRUSION ANODIZE PAINT SUMM SUMM SUMM All 1 566 555 558 1679 559.67 559.67 559.67 0.07167 0.03891 0.00496 2 64 75 72 211 70.33 70.33 70.33 0.57030 0.30964 0.03949 All 630 630 630 1890 Cell Contents: Count Expected count Contribution to Chi-square Pearson Chi-Square = 1.035, DF = 2, P-Value = 0.596 Likelihood Ratio Chi-Square = 1.046, DF = 2, P-Value = 0.593 Conclusion: BSD Defect Rates showed variation but are not statistically different between the three departments. The P Value (0.596) is high (more than 0.05) so we fail to reject the Null. The result of this test is False. 7% 8% 9% 10% 11% 12% 13% 14% 15% 16% PAINT EXTRUSION ANODIZING BSD DEFECT RATES BSD DEFECT RATES
  • 36. Hypothesis Testing Plan Results Possible X Root Cause Hypothesis Hypothesis Test Results Time Period BSD Defect rates were lower in the past when newer racks were being used to transport material One Proportion TRUE Work Shifts 2nd Shift Material Handlers are responsible for allowing more defects than the 1st Shift Two Proportion TRUE Departments Material Handlers in the Paint Department are doing a better job of inspecting material than the Extrusion and Anodizing Departments Chi-Square FALSE Hypothesis Testing Plan
  • 37. Improve • Root Causes to Address (Fishbone) • Rack Design Change • Poor Lighting • Poor Layout • New Storage Area • Spacers • Dolly/Rack Covers • Shavings • Tie-Down Material • Cross-Training Matrix • Updated Communication Plan • Updated Stakeholder Analysis • Implementation Plan
  • 38. Root Causes to Address The Team referenced our Fishbone Diagram to brainstorm solutions that address our root causes. The highlighted root causes (aside from the Racks) above allowed for the most impact with the least amount of effort. Anew Rack Design is our featured change.
  • 39. Rack Design Change Based on our Hypothesis for a One Proportion Test in the Analyze Phase, we were able to show an increase in Defect Rates from 7% in 2014 to 11% in 2015 due to the poor conditions of wooden racks used to transport material. The pictures below give you an idea of the battle our Material Handling Department has of not damaging material in transit. Within 2-3 years, the wooden racks begin to rot and expose nails that results in Scratched Material. In addition, the wood eventually loses its structure and will bottom out on other material, making it susceptible to scratches and bowed metal (Bent Material).
  • 40. Rack Design Change With a game-changing issue such as Rack Design, we decided to add a few team members and used another DMAIC tool (LCS) to get ideas from other departments upstream and downstream that also have to deal with the racks. This allowed us to overhaul the Racks using metal that was originally scrapped with the help of our Brake Metal and Welding Shop. Our newest team members helped suggest a preset lifting length that could be setup for all forklifts and therefore be used throughout the entire campus. The new design would also carry enough strength/stability for our longest material lengths (28 feet) while maintaining features mandated by our Safety Department (weighing under 75 lbs so two team members can move).
  • 41. Rack Design Change Pilot Armed with a new design and taking advantage of material that had been left for scrap – we had 15 racks built and deployed five each to Extrusion, Anodizing, and Paint to gain feedback of potential improvements to the Material Handling Process. After carefully assessing the risk of process changes, we would heavily use them in circulation for the next two weeksbefore making any large scale plans. The supportive feedback was unanimouson both shiftsand we made it known to our Stakeholders that we wanted to fully replace our 800+ wooden racks already in circulation. Since the previous process involved purchasing the wood and building from within, the changed process of using already scrapped metal and welding on-site was an actual push in termsof Return on Investment ($$$).
  • 42. Poor Lighting One root cause that was easily identified as a “Quick Fix” or simply just needing implementation was the poor lighting in the Inspection Areas near the Anodizing Lines. We found this to be a routine problem throughout the plant and added Maintenance to our list of Stakeholders to help ensure this doesn’t re-occur.
  • 43. Poor Layout The layout of our plant remains the biggest challenge we cross every day. With our final step of the Metal Processing lifecycle (Paint) and our Warehouse being located across the street, it leaves our Material Handling Department open to multiple risks in transit – not to mention a horrible violation of the 8 Wastes (Motion/Transportation).
  • 46. Spacers Our process walk during the Define Phase shed the light on a problem that we’ve been familiar with but simply was not being implemented in the Extrusion area. All metal spacers should have stapled kevlar covers on them. Uncovered spacers lead to Scratched Material. It’s already in the Work Instructions but was not being followed. After being told they were not getting much life out of the old style kevlar – we got the Purchasing Dept. involved to make sure we could get a better product with a longer life expectancy. Scratched Material
  • 47. Dolly/Rack Covers Along the lines of the Spacer Covers was an issue with the arms of the dollies/racks rubbing up against material and causing scratches. Our Purchasing Dept. was able to use the same company from the Spacer Covers for these kevlar-coated Rack Covers.
  • 48. Shavings Shavings left on extruded metal can only result in one thing – Scratched Material. This is another implementation item that is called out in all Work Instructions but not being followed by all employees despite air guns at the Extrusion Presses. We had all department supervisors reiterate in their pre-shift meetings the importance of this and will also make it more visual in the Work Instructions.
  • 49. Tie-Down Material As you’ve seen with the Spaghetti Map, material travels quite a distance from our Anodizing Department and across the street to Paint and the warehouse for storage. If a batch of material is not properly tied down, it will shift while in transit and lead to Damaged Material. This has also led to the need to upgrade the road conditions for the material transfer. This will be an added Training feature and part of the updated Work Instructions. Properly Tied
  • 50. Cross-Training Matrix In our Two Proportion Hypothesis Test, we were able to show a statistically significant difference in the defect rates between 1st and 2nd shift due to inadequate training. We created a Cross-Training Skills Matrix to ensure both shifts would be equally trained. NAME NOT TRAINED IN TRAINING - OPERATES UNDER SUPERVISION CAPABLE WITH MINIMAL SUPERVISION OPERATES INDEPENDENTLY TO STANDARDS FULLY COMPETENT - CAN TRAIN OTHERS TEAM LEADER OR CAN FILL IN FOR TEAM LEADER MATERIAL HANDLING CROSS-TRAINING SKILLS MATRIX R E A D P R I N T S S T A C K I N G P R O C E D U R E S D E T E C T R E W O R K L O A D I N G A N D U N L O A D I N G E P I C S K N O W L E D G E D E F E C T C O D E K N O W L E D G E F O R K L I F T C E R T I F I C A T I O N P A L L E T J A C K T R A I N I N G C R A N E / H O I S T T R A I N I N G S K I L L S U N D E R S T A N D W O R K I N S T R U C T I O N S M A T E R I A L I N S P E C T I O N I N T E R P R E T B / S / D M A T E R I A L
  • 51. Updated Communication Plan Stakeholder Group Objectives/Actions Desired Message Delivery Method/Venue Timing Communication Plan VP - Manufacturing Metal Processing Mgr Plant Manager Quality Team Inform of project findings and report back potential costs/expected savings Inform of project findings, foster buy-in and ownership, participate in roll-out Inform of project findings, foster buy-in and ownership, participate in roll-out Document Project Timeline for Best Practices Translate ROI for racks and costs of sleeves after discussions with Purchasing - inform of pilot results Email Within 1 week Inform of pilot results, work instruction overhaul, training and implementation plan Schedule meeting along with Plant Manager Within 2 weeks Inform of pilot results and implementation plan Maintenance Purchasing Safety (1) lighting at inspection areas (2) road conditions for material transit (3) preventive maintenance as identified Purchase sleeves (covers) for spacers and dolly/rack arms Review new Rack design Schedule meeting along with MP Manager Within 2 weeks Use project results to help identify/teach other departments about the importance of a Lean Culture Email After Project Storyboard is Complete Need areas of the plant setup immediately - order safety stock Email Today Research/compare suppliers Email Today Inform of any challenges due to added weight of new rack design - apply in next month's safety training topics 1-on-1 This week - prior to pilot
  • 52. Updated Stakeholder Analysis Stakeholder/ Stakeholder Group Impact Level Level of Support Reason for Resistance or Support Action(s) to Address This Stakeholder Group Contact VP- MANUFACTURING DECISION AUTHORITY SUPPORTIVE FINANCIAL BACKING - WILL HELP CLEAR BARRIERS UPDATE/NOTIFY IF ANY PURCHASES OR MATERIAL NEEDED TIM J. METAL PROC. MANAGER IMPACTS NEUTRAL AWARE OF PROBLEM BUT UNSURE EMPLOYEES CAN HANDLE CHANGES CREATE WORK INSTRUCTIONS/TRAINING OPPORTUNITIES EARLY IN THE PROCESS KLAY M. PLANT MGR AFFECTED RESISTANT AFRAID CHANGES COULD LEAD TO NON-VALUE ADDED TIME TO CURRENT PROCESS USE DATA TO SHOW EXPECTED COST SAVINGS AND POTENTIAL LOSSES IF NOT ADDRESSED WES B. QUALITY TEAM DECISION AUTHORITY SUPPORTIVE ANXIOUS TO SHOW PROCESS IMPROVEMENT TEAMS CAN ADD VALUE TO THE ORGANIZATION CREATE USEFUL TEMPLATES/DOCUMENT STRATEGIES - IDENTIFY GOOD/BAD LESSONS LEARNED PAUL K. MAINTENANCE IMPACTS SUPPORTIVE WANT TO PREVENT ANY TYPE OF DOWNTIME AND LOST PRODUCTIVITY PROVIDE LINE ITEMS OF NECESSARY IMPROVEMENTS AND KEEP SAFETY STOCK VINCENT L. PURCHASING IMPACTS SUPPORTIVE POTENTIAL NEW SUPPLIERS COULD BENEFIT OTHER AREAS OF OUR ORGANIZATION RESEARCH/STOCK COVERS USED FOR SPACERS AND DOLLY/RACK ARMS DEREK J. Stakeholder Analysis (Advanced) - IMPROVE
  • 53. Implementation Plan Action Item (List steps required to implement solutions) Responsible (List person(s) responsible for action steps) Due Date (Indicate when action items must be completed) Outline Pilot Strategy (Timeframe/Dept/Adjustments) Jeff/Daniel/Kevin 12/8/2015 Order supply of spacer/arm covers with enough safety stock - apply immediately Michael/Purchasing 12/11/2015 Update Work Instructions with Process Changes Jeff/Dexter 12/23/2015 Adjust/Replace Lighting in Inspection Areas Vincent 12/11/2015 Create cross-training matrix and setup training for 2nd shift Jeff/Michael 12/22/2015 Create P-Chart to show Improvement over Baseline Jeff 1/6/2016 Set-up Safety Topic to discuss changes and potential lifting hazards (heavier/wider racks) Jake 12/3/2015 Implementation Plan
  • 54. Control • Improvements from Baseline (P-Charts) • Data compared to Goal • Monitoring Plan • Response Plan • Visual Management • Innovation Transfer • Lessons Learned
  • 55. P-Chart (Measure Phase) Process Capability P-Chart for Process Capability during Measure Phase in October 2015
  • 56. P-Chart Revisited 28252219161310741 0.4 0.3 0.2 0.1 0.0 Sample Proportion _ P= 0.1347 UCL= 0.3395 LCL= 0 P Chart of DEFECTS Tests are performed with unequal sample sizes. The improvement from our baseline back in October was dramatic, dropping our Proportion Defective for Bent, Scratched, and Damaged Material from 0.5627 to 0.1347, shown in the Minitab P-Chart below. This translated to only 101 defects over a lot of 750 pieces, compared to 422 defects during our baseline measure of 750 pieces. I chose the P-Chart due to our racks of material having unequal sample sizes, ranging from 20-30 pieces per rack.
  • 57. Shattering the Goal Our goal was to reduce Bent/Scratched/Damaged Scrap $$ by 50% from an average of $5850/month (thru August) to $2925/month by the end of the year. We blew that away with savings of over 76% by reducing it to just $1362.02 by the end of 2015. The graph below shows the dramatic decline. $4,622.06 $8,114.10 $4,877.85 $4,942.94 $5,653.64 $3,854.11 $6,412.27 $8,327.46 $6,177.00 $4,541.79 $2,252.09 $1,362.02 $0.00 $1,000.00 $2,000.00 $3,000.00 $4,000.00 $5,000.00 $6,000.00 $7,000.00 $8,000.00 $9,000.00 Jan-15 Feb-15 Mar-15 Apr-15 May-15 Jun-15 Jul-15 Aug-15 Sep-15 Oct-15 Nov-15 Dec-15 2015 - B/S/D - MATERIAL HANDLING SCRAP $$
  • 58. Monitoring Plan Measure Control Limits/Specs Checking Item Checking Frequency Who Bent, Scratched, and Damaged Material (Defects) No greater than 0.3395 Proportion Defective - Upper Control Limit Checksheets created in Data Collection Plan Each rack of material (ranges from 20-30 pieces) in Extrusion, Anodizing, and Paint Material Handling Team Monitoring Plan We want the communication to be open so this Monitoring Plan will be a standard slide used in the MDI (Managing Daily Improvement) walks performed each week for all levels of Plantleadership along with Pre-ShiftMeeting documentation for all operators. The expectations are that with the attention this has received and the pride of the employees taking ownership – sustainmentofthese improvements will come easy.
  • 59. Response Plan Damage Control Process Adjustment Effectiveness Assessment Continuous Improvement Confirm all Employees Trained on Operational Definitions (and Visuals) of Bent, Scratched, Damaged Material Process Owner to Audit Material on Each shift with employees No greater than 0.3395 Proportion Defective per rack - UCL setup in the Monitoring Plan Offset employee turnover with continued Cross-Training and pair new employees with seasoned veterans to ensure proper training habits Check to see if Racks need repairs or if spacers/arms are properly covered Gather a safety stock for all maintenance items used for racks Replace rack if defective and store two months of safety stock (kevlar covers) at point-of-use Create weekly Preventive Maintenance schedule for Material Handling Teams to sign-off on Response Plan (If Proportion Defective dips above 0.3395)
  • 60. Visual Management Pictures identifying definitions like Bent, Scratched, Damaged Material along with Checksheets to use for Data Collection (Pages 17-20 of this PowerPoint) have been added to the Standard Work Instructions. We’ve also included pictures of the spacer/arm covers, shavings, tiedowns for a visual explanation within the Work Instructions. The next step is to have the Control Charts/Monitoring Plans posted in each department for everyone to see.
  • 61. Innovation Transfer Process Innovation/Addition/Change/Removal (Describe the implemented solution) Process Benefits (Describe the both measurable and intangible benefits of the change) Area/Department/Business Unit (Indicate the process area that could benefit from innovation transfer) New Rack Design/Spacer Covers/Arm Covers Eliminates B/S/D Opportunities All Metal Processing Facilities in U.S. and Canada Cross-Training Matrix Creates Employee Ownership and Strengthens workforce depth All Departments Control Charts/Monitoring Plans Identifies Trigger Measures (UCL/LCL) that lead to variation All Departments Visual Aids added to Work Instructions Quicker training method and immediate understanding of Operational Definitions like Bent, Scratched, and Damaged Material All Metal Processing Facilities in U.S. and Canada New Checksheets for Data Collection An easy-to-use sheet that tracks each rack of material against our goal of Proportion Defective All Metal Processing Facilities in U.S. and Canada Innovation Transfer Opportunities
  • 62. Lessons Learned • Important to drive inspection earlier in the process where Rework is an Option. The more VA to the Metal – the harder it is to Rework – and the less $$ you get for defective material in a scrapyard • Too many blind handoffs – wanted to create opportunities where items (Checksheets) had to be initialed to create more ownership • Newspaper Items – Dig deeper into Scrap Reporting Efficiency – Use Project to show value of adding a 2nd Age Oven in Extrusion to serve as Workload Balancing and eliminate the obvious bottleneck. – Sell Lean Culture benefits at the Management Level for ultimate buy-in on Process Improvements – Identify more KPIs/Metrics for Tracking (Rework/FPY)