1. CHAPTER 2 - MATERIAL COST
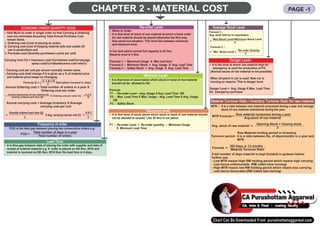
ECONOMIC ORDER QUANTITY (EOQ)
– How Much to order in single order so that Carrying & Ordering
cost are minimized Assuming Total Annual Purchase Cost
remain Same.
1. Ordering cost (Cost of placing an order),
2. Carrying cost (cost of keeping material safe and usable till
use in production) and
3. Purchase cost (Quantity purchased x price per unit)
Carrying Cost (%) = Insurance cost (%)+interest cost(%)+storage
space cost(%)+obsolescence cost rate(%)
- Carrying cost per unit per annum normally remain same.
- Carrying cost shall change if it is given as a % of material price
and material price keeps on Changing
Frequency of order
FOO is the time gap between placing two consecutive orders e.g.
• When to Order
• It is that level of stock of raw material at which a fresh order
for raw material should be placed otherwise the firm may
face stock-out situation. This level lies between maximum
and minimum level.
A Car tank petrol normal full capacity is 25 litre.
Reserve level is 5 litre.
Formula 1 :- Maximum Usage X Max lead time
Formula 2 :- Minimum Stock + Avg. Usage X Avg. Lead Time
Formula 3 :- Safety Stock + Avg. Usage X Avg. Lead Time
Material Turnover Ratio / Inventory Turnover Ratio for raw material
MTR :- It is a ratio between raw material consumed during a year and average
stock of raw material maintained during the year.
Re-order Level
Minimum Level:
• It is that level of stock below which stock in hand of raw material
should not be allowed to fall.
Formula
F1 - Re-order Level – Avg. Usage X Avg. Lead Time OR
F2 - Max. Lead Time X Max. Usage – Avg. Lead Time X Avg. Usage
OR
F3 - Safety Stock
Lead Time:
• it is time gap between date of placing the order with supplier and date of
receipt of ordered material e.g. if order is placed on 4th Nov. 2016 and
material is received on 8th Nov. 2016 then the lead time is 4 days.
Maximum level:
• It is that level of stock above which stock in hand of raw material should
not be allowed to exceed. Like 25 litre in car petrol.
F1 - Re-order Level + Re-order quantity – Minimum Usage
X Minimum Lead Time.
Average Stock Level
Formula 1:-
Avg. stock held by an organization
2 × A × O
Formula Q = Derivation Covered in class
C
Annual Ordering cost = Total number of orders in a year X
Ordering cost per order
Annual requirement of raw material (A) A X O
= X Ordering cost per order (O) =
Quanity ordered each time (Q) Q
Annual carrying cost = Average Inventory X Average
carrying cost per unit
Quantity ordered each time (Q) Q X C
= X Avg. carrying cost per unit (C) =
2 2
Total number of days in a year
FOO =
Total number of orders
Max.Stock Level+Minimum Stock Level
=
2
Formula 2 :-
Re-order Quanity
= Min. Stock Level +
2
Danger Level:-
• It is the level at which raw material kept for
emergency is used for production of FG
(Normal issues of raw material is not possible).
When all petrol in car is used. Now car is
running on reserve. This is danger level.
Danger Level = Avg. Usage X Max. Lead Time
for emergency purchase
Raw material consumed during a year
MTR Formula =
Avg.stock of raw material
Opening Stock + Closing stock
Avg. stock of raw material =
2
Raw Material holding period or Inventory
Turnover period:- it is a ratio between No. of days/months in a year and
MTR.
365 Days or 12 months
Formula =
Material Turnover Ratio
It tell number of days material is kept (holded) in godown before
further use.
- Low MTR means High RM holding period which means high carrying
cost hence unfavourable. (RM called slow moving)
- High MTR means low RM holding period which means less carrying
cost hence favourable.(RM Called fast moving)
PAGE -1
2. while calculating per unit cost of raw material purchased, some items are
considered as follows:-
1. Trade Discount Deduct from purchase price
2. Quantity Discount Deduct from purchase price
3. Cash Discount Not Deduct from purchase price
since it is finance benefit.
4. Road Tax/Toll Tax / Add to purchase cost
Octroi / Entry Tax
5. GST Add to purchase cost if no input tax
Integrated GST - paid on credit availed. Unless specifically
inter-state supply of goods and services mentioned in question, it will be
State GST – Paid on intra-state supply of excluded from cost of purchase
goods and services assuming that credit is available
Central GST – Paid on mfd& supply
of goods .
6. Demurrages / Detention Charges Deduct from purchase price since it
/ Fine / Penalty is a penalty
7. Insurance Cost / Comm. / Add to purchase cost
Brokerage Paid / Freight Inwards
8.Cost of containers (if specifically charged) • Add to purchase cost if it is
non-returnable.
• Don’t add to purchase cost if it is
returnable.
9.Normal Loss Good units shall absorb cost of
normal loss of material.
Valuation of raw material
Total Cost
Note:-Cost per unit =
Total units - normal loss units
How to Calculate cost of material consumed and cost of closing stock of material
if material purchase prices keeps on changing
3 methods
1. FIFO (First in First Out):- Material issued for production shall be priced at the
price of material purchased first till its quantity exhausts. When the quantity
exhausts, next price shall be used as basis.
2. LIFO (Last in First Out):-Material issued for production shall be priced at the
price of material purchased LAST till its quantity exhausts. When the quantity
exhausts, previous price shall be used as basis.
3. Weighted Average method:- With every receipt of material, price is averaged and
this averaged price used for issue of material till next receipt of material. On
next receipt of material, average price changes. Used when difficult to identify
material physically e.g. petrol storage in a tank.
Treatment of normal and abnormal loss of units in valuation
a. Normal Loss in units:- Price per unit of remaining material shall be increased.
b. Abnormal loss in units:- it shall be treated as issue of material. Cost of
material lost shall be charged to costing P&L A/c as loss.
If given in question “Shortage will be charged as overhead” then it means cost of
such issues shall be treated as overhead cost (material Cost became indirect
material cost). It is neither normal loss nor abnormal loss.
ABC ANALYSIS
Practical steps to classify material in
category A, B and C
Step 1:- Calculate value of each raw
material by multiplying annual
consumption of each raw
material by its unit price.
Step 2:- Calculate total value of all raw
materials.
Step 3:- Calculate % of value of each
raw material in relation to total
value of all raw materials.
Step 4:- Assign ranking to above
calculated % i.e. Rank 1 to
highest %, Rank 2 to second
highest % and so on.
Step 5:- Classify items having nearly
70% value under category A,
20% value under category B
and 10% value under category C.
Input-output ratio
It explains the relationship between input
consumption and output produced using
that input.
Example:-
suppose in a manufacturing process,
output obtained is 200 kg from use of
input of 260 kg then input-output ratio
shall be 130%
input
Formula = x 100
output
If input-output ratio is 130%, it means that
- Input consumption is 130% of the output.
- manufacturing loss is of 30% of output.
This ratio is treated as unfavorable if it is
more than 100% while it is regarded as
favorable if it is near 100%.
Material cost for 1 unit of output = Input
– Output Ratio x Purchase price of RM
260 kg
i.e x 100
200 kg
Stock-out situation
When a supplier could not supply
ordered units of FG then such a
situation is called Stock out
situation.
Stock-out ratio (Finished Goods) =
units for which order got cancelled
=
total units for which orders
received in whole year
Inventory turnover ratio for FG (ITR for FG)
1. Inventory turnover ratio for finished goods
Cost of sales
=
Average inventory of finshed goods
2. Average inventory of finished goods
Opening stock of FG+closing stock of FG
=
2
3. Avg. stock of finished goods
365 days or 12 months
=
inventory turnover ratio of FG
Low ITR for FG means High inventory holding
period which means high holding cost hence
unfavourable.
High ITR for FG means Low Inventory holding
period which means low holding cost hence
favourable.
Stock out cost = stock out units x Stock out cost
per unit x probability (%).
CHAPTER 2 - MATERIAL COST PAGE -2
3. CHAPTER 3 - EMPLOYEE COST AND DIRECT EXPENSES
Various Motivation schemes to boost up moral of workers
Various Motivation schemes to boost up moral of workers
There are 2 formula oriented bonus schemes as follows:-
1. Halsey Plan-
Total wages = hours worked x wage rate + hours saved x x hourly wage rate (Called Bonus)
2. Rowan Scheme-
Total Wages = hours worked x wage rate + hours saved x x hourly wage rate (Called Bonus)
Example:- suppose time allowed for a work is 40 hours.Actual time taken by worker is 25 hours. Wage rate is Rs. 6 per
hour. Calculate earnings for 25 hour time worked under Halsey and Rowan scheme?
Solution:- Time saved = 40 hour – 25 hour = 15 hour
Total Earning (Wages) Hours worked x hourly wage rate + Hours Saved x Hourly wage rate x worker sharing ratio
Halsey 25 hour x Rs. 6 per hour + 15 hour x 50% x Rs.6 = 195
Rowan 25 hour x Rs. 6 per hour + 15 hour x x Rs. 6 per hour = Rs. 206.25
Direct labour cost per unit =
Effective Wage Rate =
Treatment of Overtime
-Overtime means working over & above normal working hours e.g. suppose job time is 9Am to
5Pm and worker works from 9AM to 7Pm hence he is doing overtime working for 2 hours.
Cases Treatment of overtime
1. When overtime working is always required due to Overtime payment is charged to product using inflated wage rate.
shortage of labour. (Workers are not available in
market hence overtime always needed by available
workers)
2. When worker has to work overtime since customer Overtime payment shall be charged to job (Recovered from customer)
was demanding production instantly.
3. When company had to overtime since working Overtime payment is charged as loss in costing profit and loss account.
during day stopped due to abnormal situations e.g.
breakdown of machine.
4. When sometimes company to work overtime to Overtime payment is treated as production overhead. (Indirectly
fulfill production requirements. charged to products)
Labour turnover means change in workers of company as follows
1. Old worker resigns from company if they get better opportunity (Called Resignation / Retirement / Left).
2. Old workers are fired from company if they does not perform well (Called retrenchment / discharged).
3. New workers are recruited to fill in vacancy due to resignation/retrenchment (Called Replacement). It is not due to expansion plan of company.
4. New workers are recruited as additional work force if company opened a new factory (Called Fresh recruitment).
High LTR means high cost of replacement and training to workers hence company always desires Low LTR.
There are 4 methods of calculating labour turnover rates as follows:-
1. Labour turnover under separation method :- x100
Separations (S) = Resignation + Retirement + left ++ retrenchment+ discharged
Note:-Average no. of workers on roll =
2. Labour turnover under replacement method = x100
Replacement (R )= New workers are recruited to fill in vacancy due to resignation/retrenchment
Replacement does not include those works who are engaged due to expansion scheme.
3. Labour turnover under accession method = x100
Accession (A) = Replacement + Fresh recruitment
4. Labour turnover under Flux method
= x 100
SinceAccession includes both replacement and fresh recruitment.
Labour Turnover Rate (LTR)
Control Ratios
Activity Ratio = x100 = S/B
Capacity ratio = x100 =A/B
Efficiency ratio = x100 = S/A
Treatment of Normal Idle Time &Abnormal idle Time
Idle time when worker keep on sitting without working. Idle time is categorized in 2 categories:-
1. Normal Idle Time:- Like lunch time, small 10 minutes beak etc.:- Cost of such normal idle time
is absorbed into cost of product.
2. Abnormal idle time:- Like breakdown of machine, charged as a loss in costing P&LA/c. Cost
of abnormal idle time is charged as loss to costing P&LAccount.
50
100
time taken
time allowed
25 hour
40 hour
total wages
total unit produced
total wages
total actual hours worked
std hours for actual output obtained
budgeted hours for budgeted production
actual hours worked
budgeted hours for budgeted production
std.hours for actual output obtained
actual hours worked
No.of separations in a year
Average no.of workers on the roll during the period
workers on the beginning of the period+workers at the end of period
2
No.of replacements in the period
Average no.of workers on roll during the period
No.of accessions in the period
Average No.of workers on the roll during the period
No.of separtions in a year+ No.of accessions
verage no.of workers on the roll during the period
4. Chapter 4 - Overheads Absorption Costing Method
Overheads Recovery Rates / Overhead absorption rate Allocation of overheads VS apportionment of overheads:-
Allocation means charging a full amount of overhead directly to a department for which this amount has been incurred.
For example, suppose in factory there are 3 departments namely Dept. 1, Dept. 2 and Dept. 3.Asupervisor is appointed in each department and salary
paid to supervisor of dept. 1 is Rs. 10,000, salary paid to supervisor of dept. 2 is Rs. 15,000 and salary paid to supervisor of dept. 3 is Rs. 20,000. Hence
total Rs. 45000 has been paid for whole factory. Now Rs. 10000 will be charged to Dept. 1, Rs. 15000 will be charged to Dept. 2 and Rs. 20000 will be
charged to Dept.3.
Apportionment of overheads:- when separate identification of overhead department-wise is not possible then we have to divide cost of whole overheads
among all departments on logical basis then it is called apportionment of overheads.
For example, factory rent paid for whole factory as whole shall be divided to all departments on the basis of floor area occupied.
Common Expense, i.e. Overhead Basis ofApportionment(Multiple Options)
Rent of Factory Building •Area of Deptt. IfArea Given
•Equal if area not given
Factory Lighting Expenses • Number of Light Points or
•Area if light points not given
Depreciation of machines • Number of machines of each deptt if value not given
•Value of machines
Power for Machines • Horse Power (HP) Rating or
•HP Rating × Machine Hours
•Machine hours
Indirect Wages • Direct Wages
Treatment of under/over absorption (Recovery) of overheads:-
Meaning of unabsorbed OH:- When overhead cost has been incurred more and overhead has been recovered less
Under absorption of OH means that amount of OH absorbed over products is less than the amount of actual OH incurred.
Over absorption of OH means that amount of OH absorbed over products is more than the amount of actual OH incurred.
Methods to dispose off
Method 1:- Charge under/over absorbed OH to costing P&L Account
Method 2:- Charge under/over absorbed OH to WIP, Finished goods- stock and units sold by using supplementary rate.
Note:- When units are not given then charge in ratio of their value.
PAGE -1
Company use following methods to charging
overheads cost to various products
a) Percentage of direct material cost
= Amount of production overheads
Direct material cost
b) Percentage of direct labour cost
= Amount of production overheads
Direct labour cost
c) Percentage of prime cost
= Amount of production overheads
Prime cost
d) Direct labour hours rate
= Amount of production overheads
Direct labour hours
e) Machine hour rate
= Amount of production overheads
Machine hours
Example The following information relates to the
production department for a certain period in a
factory:
Direct Materials consumed Rs. 75,000
Direct Wages Rs. 50,000
Production Overheads Rs. 1,50,000
Labour Hours 30,000 hours
Machine Hours 25,000 hours
For one Order No. 101 carried out in the department
during the period, the relevant data were:
Direct Material consumed Rs. 14,000
Direct Wages Rs. 11,000
Machine hours worked 5000 hours
Labour hours worked 7000 hours
Required: Prepare a Comparative Statement of Cost
of this order by using the following methods:
(i) Direct Material Cost Percentage;
(ii) Direct Labour Cost Percentage;
(iii) Prime Cost Percentage;
(iv) Labour Hour Rate;
(v) Machine Hour Rate.
Solution:
Step 1 Computation of Production Overhead Rate
(I) Direct Material Cost Percentage
= production overheads × 100 = 1,50,000 × 100
direct material cost 75,000
= 200% of DMC
(ii) Direct Labour Cost Percentage
= production overheads × 100 = 1,50,000 × 100
direct labour cost 50,000
= 300% of DLC
(III) Prime Cost Percentage
= production overheads × 100 = 1,50,000 × 100
Prime Cost 1,25000
= 120% of Prime Cost
(iv) Labour Hour Rate
= production overheads = 1,50,000
direct labour hour 30,000
= Rs.5 per labour hour
(v) Machine Hour Rate
= production overheads = 1,50,000
Machine Hours 25,000
= Rs.6 per machine hour
Step 2 Comparative Statement of Cost of Order
No. 101
Particulars DMC% DLC% Prime Direct Machine
Cost% Labour Hour
Hour Rate
Rate
Rs. Rs. Rs. Rs. Rs.
Direct
Material
Cost 14,000 14,000 14,000 14,000 14,000
Direct
Labour
Cost 11,000 11,000 11,000 11,000 11,000
Prime Cost 25,000 25,000 25,000 25,000 25,000
Production
Overheads
200% of
DMC 28,000 — — — —
300% of
DLC — 33,000 — — —
120% of
Prime Cost — — 30,000 — —
@Rs.5 per
Direct
Labour Hour — — — 35,000 —
@Rs.6 per
Machine
Hour — — — — 30,000
53,000 58,000 55,000 60,000 55,000
Note 1:- supplementary rate
= unabsorbed or over absorbed OH
Total production in units including equivalent units of WIP
Note 2:- The under absorbed overhead relating to inefficiency or defective planning or defective production policy is
always charged to profit and loss account as loss.
Note 3:- For calculation of unabsorbed / over absorption OH, Actual overhead incurred should not include non-recurring
expenses
• amount paid to worker as per court order
• previous years’ expenses booked to current year
• wages paid in strike period
• obsolete stores written off.
x 100
x 100
x 100
x 100
x 100
5. PAGE -2
Chapter 4 - Overheads Absorption Costing Method
Method 1 - Repeated / continuous distribution method:- Following steps shall be applied under this method assuming
3 production deptt.As P1, P2, P3 and 3 service deptt. S1, S2 and S3.
S.1Original Cost of S1 is distributed among P1, P2, P3, S2 and S3 in given %.
S.2Original Cost of S2 Plus shared cost from S1 is distributed among P1, P2, P3, S1, S3 in given %.
S.3Original cost of S3 plus shared cost from S1 & S2 is distributed among P1, P2, P3, S1 and S2 in given %.
S.4Repeat the above step -1, step – 2 and then step -3 until cost of S1, S2 and S3 becomes small figure.
(Rs. 1 or Rs. 2). Now distribute this small figure over P1, P2 and P3
Method 2 - Trial and error method:-Following steps are applied under this method assuming 3 production deptt.As
P1, P2, P3 and 3 service deptt. S1, S2 and S3.
S.1 Original Cost of S1 is distributed among S2 and S3 in given %.(1:2) (No amount shall be reduced from S1)
S.2 Original Cost of S2 along with shared cost from S1 is distributed among S1 & S3 in given %.(1:2) (No amount shall
be reduced from S2)
S.3 Original Cost of S3 along with shared cost from S1 & S2 is distributed among S1 & S2 in given %.(1:2) (No amount
shall be reduced from S3)
S.4 Repeat the process of distribution again beginning with S1 until the additional amount becomes small amount
(Rs.1 or Rs.2)
S.5 Now distribute the [100% - Share of other Service Deptt. ] cost of S1, S2 and S3 among P1, P2 and P3 only once.
Method 3 - Simultaneous equation method:- Following steps are applied under this method assuming 3 production
deptt.As P1, P2, P3 and 2 service deptt. S1 and S2.
S.1Make2 equation to show the total cost of S1 & S2 including its share (%) in S2 & S1 respectively.
S.2Solve these 2 equationsto find out the cost of S1 and S2.(Called Calculated Cost)
S.3This calculated cost of S1 and S2 is then distributed only once over production deptt and service deptt. in given %.
Method 4 - Step ladder method:- following steps are applied under this method assuming 3 production deptt.As P1,
P2, P3 and 4 service deptt. S1, S2, S3 & S4.
S1 provide services to P1, P2, P3, S2, S3 & S4.
S2 provide services to P1, P2, P3, S3 & S4.
S3 provides services to P1, P2, P3 and S4.
S4 provides services to P1, P2 & P3.
S.1 Original Cost of S1 is distributed among P1, P2, P3, S2, S3 & S4.
S. 2 Original Cost of S2 along with shared cost from S1 is distributed among P1, P2, P3, S3 & S4.
S.3 Original Cost of S3 along with shared cost from S1 & S2is distributed among P1, P2, P3 and S4.
S.4 Original Cost of S4 along with shared cost from S1, S2& S3is distributed among P1, P2 & P3.
Re-distribution of overheads Different Capacity
Meaning It is expressed in terms of Units of product e.g. 100 cars per day [20 costing Question per
day] & Production Hours e.g.100 hours per day [Study 10 hours per day]
Types
1. Maximum / Rated Capacity It refers to the maximum possible production capacity of a factory which can never be
achieved practically and it is only a theoretical capacity.
ExampleAfactorycan work 8 hours per day.
Here, Maximum capacity = 365 days × 8 = 2,920 hours
2. Practical Capacity It refers to the maximum capacity of a factory reduced by capacity lost due to Normal
repairs& maintenance, Sundays, Holidays etc. Thus,
Practical capacity = Maximum capacity – Normal loss of capacity
ExampleAfactory can work 8 hours per day during a six day week and remains closed for
18 holidays (exclusive of Sundays) during a year.Average idle hours per month is 20 for
cleaning and maintenance.
Maximum capacity (365 days × 8 hours) 2,920 hours
Less: Idle capacity due normal reasons:
Sundays (52 × 8) 416 hours
Holidays (18x8) 144 hours
Maintenance (20 × 12) 240 hours 800 hours
Practical Capacity 2,120 hours
3. Normal Capacity /
Average Capacity It refers to average of capacity utilised of factory during one full business cycle which may
extend over 3 to 5 years ignoring the abnormal year of highest and lowest utilisation.
ExampleActual Capacity during the last 5 years was: I 30,000 II 38,000, III 31,000 IV 30,800,
V 26,900.
Here year II being two high andYear V being too low are to be ignored.
Hence, Normal Capacity = Average of (30,000 + 31,000 + 30,800) = 30,600 hours.
4.Actual Capacity It refers to the capacity actually utilised during a given period.
Machine hour rate
Machine hour rate = Amount of production overheads
Machine hours
- All expenses related to operating of machine are divided into fixed/standing charges and running/machine
expenses.
- Comprehensive machine hour rate
=Simple machine hour rate + direct wages per machine hour Total Direct wages
Total machine hours
( )
STATEMENT SHOWING THE COMPUTATION OF MACHINE HOUR RATE
Particulars Amount (Rs.)
A. Fixed/Standing Charges:
(a) Rent & Rates XXX
(b) Heating & lighting cost XXX
(c) Supervision cost XXX
(d) Insurance cost XXX
(e) Department & general overheads XXX
(f) Sundry Shop Supplies XXX
(g) Depreciation of factory – building
Total Fixed/Standing Charges XXX
B. Machine Expenses per hour:
(a) Depreciation = original cost + installation exp. - scrap value
effective useful life (in hours)
(b) Powerconsumed cost / Electricity
(c) Repair & Maintenance
(d) Lubricating oil & Consumable stores
(e) Other running expenses
C. Machine Hour Rate
Note:- Calculation of Effective machine hours
Particulars Hours
Maximum Capacity (365 days x 8 hours in a day) XXX
Less:- Hours spent on holidays, festivals, Sundays, repair & maintenance (XXX)
Practical capacity (In hours) XXX
Less:- Set up time (If unproductive) (XXX)
Effective machine hours XXX
Note:- if set-up time is considered productive then it shall not be reduced.
6. Chapter 5 - Activity Based Costing
Absorption Technique
Overhead recovery rate (ORR)
- Budgeted Output Overhead Recovery Rate = Budgeted Overhead
Budgeted Output
- Budgeted Labour hours Overhead Recovery Rate = Budgeted Overhead
Budgeted Labour Hours
- Budgeted machine hours Overhead Recovery Rate = Budgeted Overhead
Budgeted Machine Hours
- Budgeted material cost Overhead Recovery Rate = Budgeted Overhead
Budgeted Material Cost
- Budgeted Labour cost Overhead Recovery Rate = Budgeted Overhead
Budgeted Labour Cost
- Budgeted prime cost Overhead Recovery Rate = Budgeted Overhead
Budgeted Prime Cost
Under ABC Costing
All overheads are divided into 2 parts:-
1. Overhead which is activity oriented i.e. set-up cost is indirect cost (OH)
which will increase if number of set-ups on machine increases and
vice-versa.
2. Overhead which is not activity oriented i.e. Factory rent, depreciation on
machine on SLM. This overhead is apportioned among products using
single recovery rate.
Steps in ABC system
1. Statement of Car Pool (Car Allocation) :- Group of overhead
2.Statement of Cost
Statement of Cost Pool
Overhead Amount Basis No. of Activities Cost per activity
Set up Cost XX No. of Set Ups XX XX
Inspection Cost XX No. of inspections XX XX
Stores Cost XX Material Cost XX XX
Other Cost XX Method of absorption (Output) XX XX
(
(
(
(
(
(
(
(
(
x 100)
x 100)
x 100)
7. Chapter 6 - COST SHEET
Main Things
1. Never break sequence
2. One Format Based Chapter
Format to make Cost Sheet
Particulars Amt (Rs.) Total units
Opening stock of raw material xxx
Add:- Purchase of raw material including carriage inwards xxx
Less:- Closing stock of raw material (xxx)
Direct material consumed / DMC xxx Units produced
Direct Labour Cost xxx Units produced
Direct Expenses / Chargeable Expenses xxx Units produced
Prime Cost/Direct Cost xxx Units produced
Factory/works/Manufacturing/Production overhead xxx
Plus Opening stock of WIP xxx
Less closing stock of WIP (xxx)
Factory Cost xxx Units produced
xxx
Quality Control Cost
Research & Development Cost (Process Related) xxx
Adm. Overheads (Related to ProductionActivity) xxx
Less:- Credit for Recoveries / Scrap / By –Products / Misc. Income (xxx)
Primary Packing Cost xxx
Cost of Production (For FG Produced) xxx Units produced
Plus opening stock of finished goods xxx
Less closing stock of finished goods (xxx)
Cost of goods Sold (For FG Sold) xxx Units Sold
Selling and distribution overhead xxx Units Sold
xxx Units Sold
GeneralAdmin Overheads
Total cost / Cost of sales xxx Units Sold
Total Profit xxx
Total Sales xxx
Case 1:- When Labour Efficiency reduced
- Reduction in efficiency or workers means workers are producing less units in same time
Example: Suppose earlier worker was producing 4 units in 1 hour and we were paying him Rs.100 per hour then in
such direct labour cost per unit shall be Rs.25 per unit.
If now question says that efficiency of worker has been reduced by 25%.
It means now worker is producing 3 units [ 4 units – 4 units x 25% ] in 1 hour hence now direct labour cost per unit
would be Rs 33.33 since we are paying worker on time basis i.e. Rs. 100 per hour.
Alternative way to calculate New DLC per unit
Old DLC per unit = Rs 25 = 33.33 per unit
100%-Reduction in Effciency 100%-25%
Case 2:- When Labour Efficiency Increased
Alternative way to calculate New DLC per unit = Old DLC per unit
100%+ Reduction in Effciency
Meaning of Change in Labour efficiency & Its impact
Impact of a word in Costing solution
Example 1 Semi-variable overheads per annum at 75% capacity is Rs. 60,000
Case 1:- (it will increase by Rs. 4,000 per annum for increase of every 5% of the capacity utilisation or any part thereof)
Solution:-
Capacity Level Annual Semi-variable OH
75% 60000
80% 60000+4000 = 64000
90% 60000+4000x3 = 72000
86% 60000+4000x3 = 72000
Case 2:- (it will increase by Rs. 4,000 per annum for increase of every 5% of the capacity utilisation thereof)
Solution:-
Capacity Level Annual Semi-variable OH
75% 60000
80% 60000+4000 = 64000
90% 60000+4000x3 = 72000
86% 60000+4000x2 + 4000 x = 68800
Example 2
Particulars Total Cost Variable Cost Fixed Cost
Administration OHs (75% Fixed) 150000 150000 x 25% = 37500 150000 x 75% = 112500
Administration OHs – Fixed (75%) 150000 150000 x 25% = 50000 150000
75%
Special Formulas
1. No. of units produced = Sales (units) + Closing Stock (units) – Opening Stock (units)
2. No. of units Sold = Opening Stock (units) + produced (units) – closing Stock (units)
3. While preparing the cost sheet, following amounts are ignored
i. Items of financial nature e.g. income tax, cash discount, interest on loan/capital, dividend, goodwill
written off
ii. Abnormal expenses
Conversion cost
Conversion cost :- It means cost incurred to convert raw material into finished goods.
Method1 :- Conversion cost = direct labour cost + direct expenses + factory overheads
Method 2 :- Conversion Cost = Factory Cost – Direct material cost
Note :- Method 2 is applicable only when Opening & Closing WIPis not given.
1%
5%
8. CHAPTER 7 - INTEGRATED AND NON-INTEGRATED ACCOUNTS
AND RECONCIALITION OF PROFIT
3 golden rules of accounting
1. Debit the receiver and credit the giver
2. Debit what comes in and credit what goes out
3. Debit all exp. & losses and credit all revenues & incomes
Particulars Receiver Giver Entry
Logic behindAbove Entries Debit the receiver
Credit the Giver
On Transferring Factory Stores WIPLedger ControlA/c Dr.
Direct Raw Material from store to To Stores Ledger ControlA/c
Factory
On Transferring Warehouse Factory FG Ledger controlA/c Dr.
Finished Goods from factory to To WIP Ledger controlA/c
Warehouse (Also Called Factory Cost)
On Transferring FG from Shop Warehouse Cost of SalesA/c Dr.
Warehouse to Showroom To Finished Goods Ledger
(Also Called Cost of goods Sold) controlA/c
On transferringActual cost of Sales Costing P&LA/c Dr.
to Costing P&LA/c To Cost of SalesA/c
(Also Called Cost of Sales)
General LedgerAdjustmentA/c (GLAA/c) OR Cost Ledger ControlA/c OR Nominal ledger controlA/c
GLAaccountshallbeusedinplaceofaccountnotopenedwhilepreparingcostsheet
Transaction Entry Transfer Entry
Direct Expenses for factory Direct Exp. ControlA/c Dr. WIPLedger ControlA/c Dr.
To GLAA/c To Direct exp. controlA/c
Journal Entries relating to direct expenses
Journal Entries relating to Material
Transaction Entry Transfer Entry
Direct Material to factory Stores ledger ControlA/c Dr.
To GLAA/c WIPLedger ControlA/c Dr.
To Stores ledger ControlA/c
(Wages incurred for production)
Indirect material at Factory /Admin.
Office / Selling Office Stores ledger ControlA/c Dr.
To GLAA/c Factory OH ControlA/c Dr.
Office &Admin OH ControlA/c Dr.
Selling OH ControlA/c Dr.
To Stores ledger ControlA/c
Note:- Raw material issued/used for repairs and maintenance means indirect materials for factory.
Treatment of under and over recovery of overheads
Option 1 of Treatment :- Carry Forword & Set Off Next Year
• NoAccounting Entry is made for this.
Option 2 of Treatment :-
• If management decides to charge the amount of under/over recovery of overheads in current year then current year’s
under/over recovery shall be transferred to current year’s profit & loss account.
Journal Entry for Under – Recovery (Loss)
Costing P&LA/c Dr. XXX
To Factory OH /Admin OH / Selling & Dist. OHA/c XXX
Just reverse entry for over-recovery.
Journal Entries relating to Overheads
PAGE -1
Journal Entries relating to wages
Transaction Entry Transfer Entry
Direct Wages to factory Wages ControlA/c Dr. WIPLedger ControlA/c Dr.
To GLAA/c To Wages ControlA/c
(Wages incurred for production)
Indirect Wages at Factory /Admin. Wages ControlA/c Dr. Factory OH ControlA/c Dr.
Office / Selling Office To GLAA/c Office &Admin OH ControlA/c Dr.
Selling OH ControlA/c Dr.
To Wages ControlA/c
Particulars Transaction Entry Transfer Entry
- Overheads charged/Recovered
Factory Overheads Factory OH ControlA/C Dr. WIPLedger ControlA/C Dr.
To GLAA/C To Factory OH ControlA/C
Office &Admin Office &Admn OH ControlA/C Dr. FG Ledger ControlA/C Dr.
Overheads To GLAA/C ToAdmin OH ControlA/C
Selling & Distribution Selling & Distribution OH controlA/C Dr. Cost Of SalesA/C Dr.
To GLAA/C To Selling OH ControlA/C
9. Example to DecideAddition/Deletion
Expense Side
Amount Implication (Other ItemsAssumed Constant)
(Rs.)
An Exp. Charged in Cost 50,000 Profit as per costing will be less by Rs.10000
Same Exp. Charged in Trading 40,000 Profit as per financial will be more by Rs.10000
Difference 10,000
Treatment
- If we use costing profit as starting point then we need to Add Rs.10000
- If we use trading profit as starting point then we need to Reduce Rs.10000
Revenue Side
Amount Implication (Other ItemsAssumed Constant)
(Rs.)
An Revenue Item in Cost Zero Profit as per costing will be less by Rs.10000
Same Revenue Item in Finan. 10,000 Profit as per financial will be more by Rs.10000
Difference 10,000
Treatment
- If we use costing profit as starting point then we need to Add Rs.10000
- If we use trading profit as starting point then we need to Reduce Rs.10000
Format to Make Reconciliation
Particulars Plus Minus
Items Items
Profit / Loss as per cost Records
Add:- Items demanding addition should be
added here in plus items heading
Less:- Items demanding deletion should be
deducted here in minus items heading
Total (Make Total of both the columns i.e.
“Plus items and Minus Items”
Profit/Loss as per financial records
( Rs. XXX – Rs. XXX) = Rs. XXX
Memorandum ReconciliationAccount
-All Plus Column Items ----- Credit Side of MRA
-All Minus Column Items ---- Debit Side of MRA
- Difference shall be profit / loss as per financial records.
PAGE -2
Shortage in raw material
When raw material balance on physical checking is found to be less than
raw material balance as per books then difference is called shortage.
Treatment as follows:-
If shortage is due to normal loss Factory OHA/c Dr.
To Stores Ledger ControlA/c
If shortage is due to abnormal loss Costing P&LA/c Dr.
To Stores Ledger ControlA/c
If shortage is due to non-recording WIPLedger controlA/c Dr.
of actual consumption To Stores Ledger ControlA/c
Note:- In case of surplus, just reverse the entries.
Important Notes
(a) Opening balances of raw material,
WIP& Finished goods shall be shown
on debit side ofA/c and closing
balances shall be shown on credit
side ofA/c.
(b) Opening balance of GLAA/c shall be
shown on credit side and closing
balance shall be shown on debit side.
Reasons of Difference
- Different basis of Overheads
o In Costing – Overheads absorbed are shown
o In Trading –Actual Overheads incurred are shown.
- Closing stock valuation
o In Costing – Cl. Shock at cost
o In Trading – Cost or Market Price whichever is lower
- Depreciation on machine
o In Costing – based on life of machine or machine hours
o In Trading – SLM Or WDV
- Some Financial Items only in financial e.g. Interest income, Dividend Income,
Rental Income
CHAPTER 7 - INTEGRATED AND NON-INTEGRATED ACCOUNTS
AND RECONCIALITION OF PROFIT
10. Chapter 8 - JOB AND BATCH COSTING
Job Costing is that form of specific order costing under which each job is treated
as a cost unit and costs are ascertained separately for each job. A job may
consist of a job, product, contract, a service or any other specific order.
Batch Costing is that form of specific order costing under which each batch is
treated as a cost unit and costs are accumulated and ascertained separately for
each batch. Each batch consists of a number of like units.
Example:- Batch costing states that cost per unit shall be less as number of
units increases and total cost of batch shall increase as number of units
increases in a batch. Example Rs. 200 for 100 visiting cards while Rs.300 for
200 visiting cards etc.
JOB AND BATCH COSTING
Economic Batch Quantity (EBQ) (Similar as Economic order quantity)
EBQ refers to the optimum quantity batch at which Set up & Processing Costs and Carrying
Costs are together minimised.
E.B.Q = 2×Annual Demand×Set up cost per batch
Cost of carrying per unit of production per annum
JOB AND BATCH COSTING
11. CHAPTER 9 - CONTRACT COSTING
Value of work certified
Value of work certified:- It is expressed as a % of the contract price.
Example:- If contract price is Rs. 10 Lakh & work certified is 60% then
value of work certified shall be 6 lakh (contract price x work certified as %)
Retention money
Retention money:- it is that portion of value of work certified which has not been
paid by contractee and kept as security money for future defective work.
Retention money = Value of work certified – Cash received by contractor
Example:- suppose in above example, if Rs. 5 Lakh has been paid by contractee
to contractor then retention money shall be 1 lakh.
Estimated Total Profit = Total Contract Price – Estimated Total Cost
Estimated Total Cost = Cost of Contract upto date + Costs to be incurred
Material Turnover Ratio / Inventory Turnover Ratio for raw material
ContractA/c (For 1stAccounting Period) Format 1
Particulars Rs. Particulars Rs.
To Materials Issued to site XXX By Materials at site (Closing Stock) XXX
To Wages incurred (Paid + O/s – Prepaid) XXX By Materials returned from site i.e. returned to stores XXX
To Direct Expenses (Paid + O/s – Prepaid) XXX By BankA/c (Sale of Materials) XXX
To Depreciation on Plant &Equipments XXX By Costing P&LA/c (Loss on sale) XXX
To Office &Adm. Exp. Incurred(Paid + O/s – Prepaid) XXX By Cost of Contract (Works Cost) (B.F) XXX
XXX XXX
To Works Cost XXX — Value of Work certified (Like Sale) XXX
To Costing Profit & LossA/c — Cost of Work Uncertified (Like closing stock) XXX
XXX XXX
ContractA/c (For 1stAccounting Period) Format 2
Particulars Rs. Particulars Rs.
To Materials Issued to site XXX By Materials at site (Closing Stock) XXX
To Wages incurred (Paid + O/s – Prepaid) XXX By Materials returned from site i.e. returned to stores XXX
To Direct Expenses (Paid + O/s – Prepaid) XXX By BankA/c (Sale of Materials) XXX
To Depreciation on Plant &Equipments XXX By Costing P&LA/c (Loss on sale) XXX
To Office &Adm. Exp. Incurred(Paid + O/s – Prepaid) XXX By Work-in-progress
To Costing Profit & LossA/c XXX — Value of Work certified (Like Sale) XXX
— Cost of Work Uncertified (Like closing stock) XXX
XXX XXX
ContractA/c (For 2nd year)
Particulars Rs. Particulars Rs.
To Work-in-progress b/d
Value of Work Certified ...... XXX
Cost of Work Uncertified ...... XXX'
Remaining Portion same as in previous format
Note: Fines & Penalties are not shown in the ContractAccount.
BALANCE SHEET (Extract)
Liabilities Rs. Assets Rs.
Capital XXX Land & Building (Less: Depreciation) XXX
Profit & LossA/c XXX Plant & Equipment (Less: Depreciation): XXX
Outstanding Expenses XXX Materials : ——
Contractee Cr. Balance XXX At Stores ...... XXX
At Site XXX
Work-in-progress :
Value of work certified ..................... XXX
Cost of work uncertified ................... XXX XXX
Cash & Bank Balance XXX
Prepaid Expenses XXX
Estimated Total Profit & Estimated Total Cost
Treatment of notional loss and estimated total loss
Treatment of notional loss and estimated total loss
• Notional loss shall arise when cost of work certified is more than value of work certified.
• Estimated total loss shall arise when total estimated cost of contract is more than total
contract price.
• Excess of estimated total loss over and above notional loss is called anticipated loss.
The whole amount of notional loss and anticipated loss shall be recognized as loss &
TF to costing P&LA/c.
Cost of work uncertified
Cost of work uncertified = Total cost incurred till date – Cost of work certified
Total Work Done (Total Cost incurred)
Work certified (Cost incurred) Work uncertified (Cost incurred)
Add:- Profit Add:- Nothing
= Value of work certified = Cost of work uncertified
Escalation clause
Escalation clause:- under this clause of a contract, rise in price of material and labour beyond standard price
fixed is paid by contractee as extra amount along with contract price. Formula to Calculate escalation:-
For material:- Standard quantity x (Actual Price – Std. Price)
For labour:- Standard labour hours x (Actual Price – Standard Price)
Escalation clause does not cover increase in cost caused due to inefficiency or wrong estimation on part of
contractor.
Reversely, de-escalation clause, contract price is reduced by downward trend in price of materials and rates
of labour etc.
Accounting Entries
Accounting Entries
Material issued from stores to contractAccount ContractA/c (Contract Number) Dr. XXX
To Stores ledger controlAccount XXX
Material Purchased directly from supplier & used in contractAccount ContractA/c (Contract Number) Dr. XXX
To General Ledger controlAccount XXX
Material Returned to stores Store ledger ControlAccount Dr. XXX
To ContractAccount XXX
Material Returned to supplier General Ledger ControlA/c Dr. XXX
To ContractAccount XXX
Employee Labour Cost ContractA/c Dr. XXX
To Wages ControlAccount XXX
Direct Expenses of contract ContractA/c Dr. XXX
To Direct ExpensesAccount XXX
Indirect Expenses of contract ContractA/c Dr. XXX
To OverheadAccount XXX
Depreciation on Plant & Machinery ContractA/c Dr. XXX
To Dep. On P&MA/c XXX
12. CHAPTER 10 - PROCESS & OPERATION COSTING
Why we need to make processA/c?
Process costing is applicable when 2 or more process are required in mfd a product.
We need it to calculate
• All cost incurred in each process.
• Cost of FG transferred to next process.
• Cost of FG directly sold in market & held as stock
2 types of losses arise in process costing:-
1. Normal loss:- loss which arise generally. Suppose 10,000 units are introduced in process & 2% is
normal loss then 200 units will be normal loss units.
2. Abnormal loss:- ifActual loss is above normal loss. If in above example, 300 units are lost in
processing then 100 units are abnormal loss.
Sometimes actual loss is less than normal loss. If in above example, only 150 units are lost in
processing then 50 units are treated as abnormal gain.
FollowingA/cs are prepared in process costing
FollowingA/cs are prepared in process costing:-
1.ProcessA/c
2.Finished goodsA/c
3.Normal lossA/c
4.Abnormal lossA/c
5.Abnormal gainA/c
6.P&LAccount
7.Any otherA/c as required in question.
ProcessAccount
Particulars Units Amount Particulars Units Amount
To material input XX XX By normal lossA/c XX = Scrap value
ToAll Expenses incurred XX By abnormal lossA/c XX = Cost of good units
To Rectification cost of normal loss By Next processA/c XX = Cost of good units
units XX (unitsTF to next
process)
ToAbnormal gainA/c XX = Cost of By finished goodsA/c XX = Cost of good units
good units (units held as stock
+ units sold in mkt)
XXX XXX XXX XXX
Finished goodsA/c / Finished stockA/c
Particulars Units Amount Particulars Units Amount
To processA/c (TF from processA/c) XX = Cost of By Sales XX = Sale value
good units
To P&LA/c Profit on sale By balance C/d XX = Cost of good units
XXX XXX XXX XXX
Normal lossA/c
Particulars Units Amount Particulars Units Amount
To processA/c (TF from processA/c) XX =scrap value By BankA/c (Note 1) XX =scrap value
abnormal
gain units
By abnormal gainA/c XX = Bal. Fig.
XXX XXX XXX XXX
Note 1:- Sale of normal loss units cannot exceed actual loss units.
Abnormal lossA/c
Particulars Units Amount Particulars Units Amount
To processA/c (TF from processA/c) XX = cost of By BankA/c XX =scrap value
good units
By P&LA/c = Bal. Fig.
XXX XXX XXX XXX
Abnormal gainA/c
Particulars Units Amount Particulars Units Amount
To normal lossA/c (TF XX XX By processA/c (TF
from normal lossA/c) from processA/c) XX = cost of good units
To P&LA/c = Bal. Fig.
XXX XXX XXX XXX
INTER-PROCESS PROFIT
PAGE -1
When output of one process is transferred to next process not at cost
but at transfer price.Transfer price means cost plus some profit.
Particulars Cost (A) Profit (B) Transfer Price (A+B)
Opening stock XXX XXX XXX
Add:-
Direct Material cost XXX XXX
Direct Labour cost XXX XXX
Dierct Expenses XXX XXX
Cost from previous process XXX XXX
Prime Cost XXX(D) XXX XXX (E)
Less closing stock XXX XXX XXX (F)
( D X F / E) (Bal. Fig)
Net Balance XXX XXX XXX
Add:- Factory Overhead XXX XXX
Total Cost XXX XXX XXX
Add:- costing P&L A/c (Profit) XXX XXX
Grand Total XXX XXX XXX
Some Special Points
(a) No Selling & distribution OH, Adm. OH Since it is internal transfer of
goods.
(b) Opening & closing stock in process 1 shall not include any profit
since it has not been transferred from any previous process.
(c) Profit included in opening stock of process II and onwards is
normally given in question. Hence we need not to calculate it.
(d) Costing Profit and loss Account
a. Shall be credited by unrealized profit on opening stock.
b. Shall be debited by unrealized profit on closing stock.
c. Shall be credited by profit of process A/c & finished goods A/c.
d. Bal. Fig. shall be net profit / loss
13. Method 1 FIFO METHOD
FIFO means units transferred as 100% complete shall comprise all opening WIPand balance from units introduced in
current period. Units Transferred = Opening WIP + Units Introduced and completed
Total Cost of units Transferred to next process = Cost incurred in previous period on opening WIP+ Cost incurred in
current period on Opening WIP+ Cost incurred in current period on units introduced & completed
Statement 1 -> Statement of Equivalent Production:-
Input Output Material Labour Overheads
Particulars Units Particulars Units % Units % Units % Units
Completion Completion Completion
Opening WIP XXX Opening WIP completed XXX XXX* XXX - 1 XXX * XXX - 2 XXX * XXX - 3
Units Units introduced XXX 100% XXX - 4 100% XXX - 5 100% XXX - 6
introduced XXX and completed [Units
Transferred – Op.WIP]
Closing WIP XXX XXX XXX - 7 XXX XXX - 8 XXX XXX - 9
Normal loss XXX --- — -– --– --- —-
Abnormal Loss XXX XXX XXX - 10 XXX XXX - 11 XXX XXX - 12
Abnormal Gain (XXX) 100% (XXX)-13 100% (XXX)–14 100% (XXX)-15
Total XXX Total XXX XXX–16 XXX–17 XXX-18
*100% – Degree of Completion of Opening WIPin previous period
Statement 2 Statement of Cost per Equivalent unit
Particulars Net Material cost (Rs)* Labour Cost (Rs.) Overheads (Rs.)
Cost (Rs.) (A) XXX XXX XXX
Equivalent units (B) XXX - 16 XXX --- 17 XXX --- 18
Cost per equivalent unit (A/B) XXX - 19 XXX --- 20 XXX --- 21
* Net Material Cost = Material Cost – Scrap Value of Normal Loss
Statement3 Statement of Evaluation:
Particulars Cost Equivalent Cost per Equivalent Cost of Equivalent TotalRs.
Elements UnitsA UnitRs. B UnitsRs (Ax B) (AX B)
Opening WIP
Cost incurred inprevious period XXX
Cost incurred in current period : Material XXX - 1 XXX –19 XXX
Labour XXX - 2 XXX –20 XXX
Overhead XXX - 3 XXX - 21 XXX
Units introduced & completed Material XXX - 4 XXX – 19 XXX
Labour XXX - 5 XXX – 20 XXX
Overhead XXX - 6 XXX - 21 XXX
Total Cost of Units t/f to next process: XXX - 22
Closing WIP Material XXX - 7 XXX – 19 XXX
Labour XXX - 8 XXX – 20 XXX
Overhead XXX - 9 XXX - 21 XXX XXX - 23
Abnormal Loss Material XXX - 10 XXX – 19 XXX
Labour XXX - 11 XXX – 20 XXX
Overhead XXX – 12 XXX - 21 XXX XXX - 24
Abnormal gain Material XXX – 13 XXX – 19 XXX
Labour XXX – 14 XXX – 20 XXX
Overhead XXX – 15 XXX - 21 XXX XXX - 25
ProcessAccount
Particulars Units Rs . Particulars Units Rs.
To Opening WIP XXX XXX By Normal Loss XXX Scrap Value
To Direct Material XXX ByAbnormal Loss XXX XXX - 24
To Direct Labour XXX By Process IIA/c
(Transfer to next process) XXX XXX - 22
To Factory Overheads XXX By Closing WIP XXX XXX - 23
To abnormal gain XXX XXX - 25
XXX XXX XXX XXX
Method 2 – WeightedAverage Method
Average method is used when it is not possible to identify opening WIPunits in units transferred to next process
Average cost per equivalent unit is calculated
= Cost incuured in previous period on Opening WIP+Cost Incurred in current period@-Scrap value of normal loss units
Total Equivalent Units
Total Cost of units Transferred to next process = Equivalent Units xAverage Cost per unit
Statement 1 -> Statement of Equivalent Production:-
Input Output Material Labour Overheads
Particulars Units Particulars Units % Units % Units % Units
Completion Completion Completion
Opening WIP XXX Units transferred
to next process XXX 100% XXX - 4 100% XXX - 5 100% XXX - 6
Units introduced XXX Closing WIP XXX XXX XXX - 7 XXX XXX - 8 XXX XXX - 9
Normal loss XXX — -– ---- – – ---
Abnormal Loss XXX XXX XXX - 10 XXX XXX - 11 XXX XXX - 12
Abnormal Gain (XXX) 100% (XXX)-13 100% (XXX)–14 100% (XXX) - 15
Total XXX Total XXX XXX –16 XXX –17 XXX - 18
Statement 2 Statement of Cost per Equivalent per unit
Particulars Net Material Cost Labour Cost Overhead cost
Opening WIP – Cost (A) XXX XXX XXX
Cost incurred in current period (B) XXX XXX XXX
Less Scrap value of normal loss (C ) (XXX) --- ---
Total Cost (A+B-C) XXX XXX XXX
Equivalent units XXX -- 16 XXX - 17 XXX -- 18
Cost per equivalent unit XXX -- 19 XXX - 20 XXX -- 21
Statement 3 -> Statement of Evaluation
Particulars Elements Equivalent UnitsA Cost per Equivalent Cost of Equivalent Total Rs.
Unit Rs. B Units Rs (Ax B)
Units transferred to next process Material XXX - 4 XXX – 19 XXX
Labour XXX - 5 XXX – 20 XXX
Overhead XXX - 6 XXX - 21 XXX XXX - 22
Closing WIP Material XXX - 7 XXX – 19 XXX
Labour XXX - 8 XXX – 20 XXX
Overhead XXX - 9 XXX - 21 XXX XXX - 23
Abnormal Loss Material XXX - 10 XXX – 19 XXX
Labour XXX - 11 XXX – 20 XXX
Overhead XXX – 12 XXX - 21 XXX XXX - 24
Abnormal gain Material XXX – 13 XXX – 19 XXX
Labour XXX – 14 XXX – 20 XXX
Overhead XXX – 15 XXX - 21 XXX XXX - 25
ProcessAccount
Particulars Units Rs. Particulars Units Rs.
To Opening WIP XXX XXX By Normal Loss XXX Scrap Value
To Direct Material XXX ByAbnormal Loss XXX XXX - 24
To Direct Labour XXX By Process IIA/c (Transfer to next process) XXX XXX - 22
To Overheads XXX By Closing WIP XXX XXX - 23
To abnormal gain XXX XXX - 25
XXX XXX XXX XXX
PAGE -2
Prepare processA/c when Opening & closing WIP is given cost item wise.
We need to prepare additional 3 statements as follows:-
Statement 1: Prepare Statement of Equivalent Production
Statement 2: Prepare Statement of Cost per Equivalent Unit
Statement 3: Prepare Statement of Evaluation
St. of equivalent production
Equivalent production units (EPU) = No. of units x degree (%) of completion performed in current period
EPU is calculated separately for each element of cost e.g. material, labour &OH because % of completion
with regard to each element of cost is different.
Example: Suppose 900 units are incomplete at end of year (Closing WIP) & degree of completion is:
Material 80%, Labour 70%, Overheads 30% then EPU of closing WIPshall be
EPU for material cost = 900 units x 80% = 720 units
EPU for labour cost = 900 units x 70% = 630 units
EPU for OH Cost = 900 units x 30% = 270 units
Explanation:-
Material cost of 900 incomplete units = material cost of 720 completed units.
Labour cost of 900 incomplete units = labour cost of 630 completed units.
OH cost of 900 incomplete units = overheads of 270 completed units.
Input Units Output Case 1 - Units Case 2 - Units
Opening WIP 2000 Opening WIP 2000 2000
now Completed
Units introduced 10000 Units introduced in 8000 8000
in current year current period and completed
Closing WIP 1000 1500
Normal loss 8% of 800 800
current period input
Abnormal loss 200 (Bal.Fig.)
Abnormal gain (300) (Bal. Fig)
Total 12000 Total 12000 12000
Degree (%) of completion performed in current period shall be
- (100% - degree of completion performed in previous period) for Opening WIP.
- 100% for units introduced in current period and completed
-As given in question for closing WIP
-Always ZERO for normal loss units
-As given in question for abnormal loss units. (100% if not given in question)
-Always 100% for abnormal gain units
Calculation of Normal loss Units
In exam Normal loss may be given as a % of Current Input, Total Input, Production or Units Processed.
Opening WIP XXX
Add:- Units Introduced XXX - Also Called Current Input
Total input units XXX
Less:- Closing Stock (XXX)
Units Processed / Production XXX
St. of cost per equivalent production
Material cost per equivalent unit, labour cost per equivalent unit and overhead cost per equivalent unit is
calculated
Formula = Total cost
Total equivalent units
St. of evaluation
Cost of units completed, closing WIP, abnormal loss units and abnormal gain units is calculated
Formula = No. of equivalent units x cost per equivalent unit.
CHAPTER 10 - PROCESS & OPERATION COSTING
14. Chapter 11 - JOINT PRODUCTS AND BY-PRODUCTS
How to apportion total processing cost among different joint products arising out of 1 process?
Joint products means when 2 or more products of almost equal importance are produced simultaneously using same raw
material in same process e.g. Oil refining industry, joint products are kerosene and petrol etc.
Method No. 1 :- Physical unit method:- Joint cost is distributed in ratio of quantity manufactured.
Method No. 2 :- Sale value at separation point method:- Joint cost is distributed in ratio of sales value at split off point.
Sale value at split off point = No. of units produced x selling price
This method is used when sale price per unit is known at split off point.
Method No. 3 :- Net realizable value (NRV) method:- Joint costs are apportioned in the ratio of net realizable values of joint products
NRV is calculated as follows:-
Sale value after further processing XXX (No. of units manufactured x Selling price)
Less:- Further processing costs (XXX)
NRV XXX
This method is used when
C.1. Sale value at split off point is not known and
C.2. Product is sold after further processing.
Method No. 4 :- Average unit cost method:- under this method, first average cost per unit is calculated using following formula:-
Average cost per unit = Total Joint Costs
Total No.of units of jonts products
Share of each product in joint cost = No. of units of each product X Average cost per unit
Method No. 5 :- Contribution margin method
- Under this method, joint costs are divided into variable cost and fixed cost.
- Variable cost portion of joint cost is divided among products on the basis of physical units (Quantity / Units Ratio)
- Fixed cost portion of joint cost is divided among products on the basis of contribution ratio.
Contribution = Sales – Total variable cost
Contribution Ratio = Contrinution of an individual product x 100
Total contribution of all products
Method No. 6 Constant gross margin % NRV method (Extension of NRV method)
Joint cost of joint products is calculated as balancing figure.
St. of joint cost apportionment
Particulars Product A Product B
Sale value after further processing
(No. of units manufactured x Selling price) XXX XXX
Less further processing cost (XXX) (XXX)
Less Gross Margin (Sales x G. Margin Ratio) (XXX) (XXX)
Joint cost apportioned XXX XXX
Format to Calculate Overall Gross Margin %
Sale value after further processing of all joint products XXX
Less joint cost and Further processing costs of all joint products (XXX)
Gross Margin / Profit XXX
Gross Margin (%) = gross margin x 100
total sales value
Note:-Joint cost calculated under this method may be negative sometimes since balancing figure.
Note:- Joint cost calculated among all methods need not to be same.
Joint products & By-products
Yes process if incremental sales < incremental cost i.e. if Profit increases.
St. Showing incremental profit / loss
Particulars Amount (Rs.)
Sales value after further processing (A) XXX
Sales value at split off point (B) XXX
Incremental Sales revenue (C)={(A)-(B)} XXX
Further processing cost: (D) XXX
Profit (Loss) arising due to further processing {(C) – (D)} XXX
Decision:- Go for further processing if profit increase as a result of further
processing otherwise don’t go for further processing.
Decision as to go for further processing or not.
When 2 or more products arise from same process using same raw material and almost
of equal importance they are called joint products but when any product has less
selling price in market. It is called by-products.
Step 1:- Calculate Joint cost of by-product using following formula
Particulars Amount (Rs.)
Sales value of by products XXX
Less:-
Cost incurred after separation (XXX)
Estimated Profit (XXX)
Estimated Expenses (XXX)
Joint Cost XXX
Step 2:- Calculate Joint cost of main product = Total joint cost of all products -Net joint
cost of all by-product.
How to calculate joint cost of main products and by-products
15. CHAPTER 12 - OPERATING COSTING OR TRANSPORT COSTING OR SERVICE COSTING
Transport Service providers
1. Transport of Passengers
2. Transport of Goods
Various Cost per unit shall be calculated as follows:-
Service Provider Cost per unit Formula
Ola Cab / Taxi Cost per Km. Total Cost of operating
Total Kms.run
School Bus, Chartered Cost per passenger Total Cost of operating
Bus, Railways,Airlines Total Passengers
Metro, DTC Bus Cost per passenger per km Total Cost of operating
Total Passengers-Kms
Goods Transport Cost per tonne per km Total Cost of operating
Service providers Total Tonne-Kms
Total Passenger – Kms = Total No. of Passengers x Total Kms.
All expenses in 2 categories
All expenses in 2 categories
a. Fixed Exp. / Standing Charges :- e.g. Salary to driver, Insurance, Road Tax etc
b. Running Charges / Variable Expense:- Purely dependent on running of vehicle like petrol exp. diesel, Repairs.
Note 1:- Dep. Of vehicle
• Fixed if life is in years
• Variable if life is in kilometers
• Fixed if nothing specified
Note 2:- Repairs & Maintenance
• Fixed if in form ofAMC
• Otherwise variable
In case of transport of goods services, we shall calculate cost per tonne-km.
Total Tonne-km = Total Tonne x Total Kms.
Tonne km are of 2 types:-
1. Absolute Tonne Km = Weight in tonne x km run
2. Commercial Tonne – Km = Total Km xAvg. Tonne Km.
Hospital charging unit is “Rent per bed per day”
Rent per patient per day = Total operating cost+Desired profit
Total No.of patient days
Patient Days = No. of beds x No. of Days x Occupancy Rate
SERVICE Costing for Hospital
Total Collection for transport industry
is called as total takings.
Particulars Amount (Rs.)
Total operating Cost XXX
Add:- Profit XXX
Net Takings XXX
Add:- Passenger Tax XXX
Total Takings XXX
Break Even Points (In Number of patient Days)
BEP Points ( No. of Units) = TFC / (S.p.p.u – V.Cost p.u.) = TFC / Contribution Per unit
In case of hospital (unit means patient-day)
• No. of units = No. of patient Days
• V. cost per unit = V cost per patient Day
SERVICE COSTING FOR CANTEEN COSTING
Fixed menu in Thali
Cost per meal / Thali = Total Operating cost
No.of meals
SERVICE Costing for Lodge
Same like Hotels. Charging unit is “Rent per room per day”
Cost per room per day = Total operating cost
Total number of room days
Total Room Days = No. of Rooms X Occupancy ratio x No. of Days
SERVICE Costing for Software Developing companies
Cost is calculated on project-by-project basis.
Cost of project = Cost per project = Specific Cost involved
for project + Overhead cost absorbed (Normally on the basis of salaries).
SERVICE Costing for Toll Roads
Construction of Highway – 10 Year right to recover Toll from vehicles passing through
3 types of expenditure:-
- Capital cost = Huge amount incurred in beginning in construction of Road
- Operating Cost = salary of persons involved in collecting tolls
- Maintenance Cost = Cost incurred in maintain repairs every year.
Price per vehicle = Toll Rate per vehicle =
Formula 1:- Cost per vehicle + profit per vehicle
Cost per vehicle = Total of capital cost+operating cost+maintenance cost
Total number of vehicles estimated to be passing through this highway
Formula 2:- Total Cost+Total Profit
Total Number of chargeable Vehicles
Cost per Km - Constructed = Total of capital cost+operating cost+maintenance cost
Total Length of Road (Total Km)
SERVICE Costing for Financial Institutions
Loan to persons for buying a house, buying a car, buying Switzerland ticket etc.
Processing Cost per home loan application = Total Processing Cost in a year
Total number of loan applications in a year
SERVICE Costing for POWER HOUSE
Generate electricity & calculate cost per
unit of electricity generated
Cost per unit of electricity generated
= Total Cost
Total chargeable Units Generated
16. chapter 13 - Standard Costing
Variances at a Glance
Variable Overhead Cost Variance
(Standard Variable Overheads for Production –Actual Variable Overheads)
(I) Material Cost Variance
[Standard Cost – Actual Cost]
(The difference between the Standard Material Cost of the actual production volume and the Actual Cost of Material)
[(SQ × SP) – (AQ × AP)]
Material Price Variance Material Usage Variance
[Standard Cost of Actual Quantity – Actual Cost]
(The difference between the Standard Price and Actual Price for
the Actual Quantity Purchased)
[(SP – AP) × AQ]
Or
[(SP × AQ) – (AP × AQ)]
(ii) Labour Cost Variances
[Standard Cost –Actual Cost]
(The difference between the Standard Labour Cost and theActual Labour Cost incurred for the production achieved)
[(SH × SR) – (AH* ×AR)]
Total Cost Variance
Material Cost Variance Labour Cost Variance Overhead Cost Variance
Price Variance UsageVariance Rate Variance Idle Time Variance Efficiency Variance Variable Overheads Variance Fixed Overhead Variance
Mix Variance Mix Variance Expenditure Variance Expenditure Variance Volume Variance
Yield Variance Yield Variance Efficiency Variance Efficiency Variance
Capacity Variance
Calendar Variance
[Standard Cost of Standard Quantity for Actual Production –
Standard Cost of Actual Quantity]
(The difference between the Standard Quantity specified for actual
production and the Actual Quantity used, at Standard Price)
[(SQ – AQ) × SP]
Or
[(SQ × SP) – (AQ × SP)]
Material Mix Variance
[Standard Cost of Actual Quantity in Standard Proportion –
Standard Cost of Actual Quantity]
(The difference between the Actual Quantity in standard
proportion and Actual Quantity in actual proportion, at Standard
Price)
[(RSQ – AQ) × SP]
Or
[(RSQ × SP) – (AQ × SP)]
Material Yield Variance
[Standard Cost of Standard Quantity for Actual Production –
Standard Cost of Actual Quantity in Standard Proportion]
(The difference between the Standard Quantity specified for
actual production and Actual Quantity in standard proportion, at
Standard Purchase Price)
[(SQ – RSQ) × SP]
Or
[(SQ × SP) – (RSQ × SP)]
Labour Rate Variance
[Standard Cost ofActual Time –Actual Cost]
(The difference between the Standard Rate
per hour andActual Rate per hour for the
Actual Hours paid)
[(SR –AR) ×AH*] Or
[(SR ×AH*) – (AR ×AH*)]
Labour Idle Time Variance
[Standard Rate per Hour xActual Idle Hours]
(The difference between theActual
Hours paid andActual Hours worked at
Standard Rate)
[(AH* –AH#) × SR] Or
[(AH* × SR) – (AH# × SR)]
Labour Efficiency Variance
[Standard Cost of Standard Time forActual
Production – Standard Cost ofActual Time]
(The difference between the Standard Hours
specified for actual production andActual
Hours worked at Standard Rate)
[(SH –AH#) × SR] Or
[(SH × SR) – (AH# × SR)]
Labour Mix Variance Or Gang Variance
[Standard Cost ofActual Time Worked in Standard
Proportion – Standard Cost ofActual Time Worked]
(The difference between theActual Hours worked in
standard proportion andActual Hours worked in actual
proportion, at Standard Rate)
[(RSH –AH#) × SR]
Or
[(RSH × SR) – (AH# × SR)]
Labour Yield Variance Or Sub-Efficiency Variance
[Standard Cost of Standard Time forActual Production
– Standard Cost ofActual Time Worked in Standard
Proportion]
(The difference between the Standard Hours specified
for actual production andActual Hours worked in
standard proportion, at Standard Rate)
(SH – RSH) × SR Or
(SH × SR) – (RSH × SR)
Variable Overhead Expenditure (Spending) Variance
(Standard Variable Overheads forActual Hours#)
Less
(Actual Variable Overheads)
[(SR –AR) ×AH#]
Or
[(SR ×AH#) – (AR ×AH#)]
Variable Overhead Efficiency Variance
(Standard Variable Overheads for Production)
Less
(Standard Variable Overheads forActual Hours#)
[(SH –AH#) × SR]
Or
[(SH × SR) – (AH# × SR)]
(iv) Fixed Overhead Variances
(Absorbed Fixed Overheads) Less (Actual Fixed Overheads)
Fixed Overhead Expenditure Variance
(Budgeted Fixed Overheads)
Less
(Actual Fixed Overheads)
Or
(BH × SR) – (AH ×AR)
Fixed Overhead Volume Variance
(Absorbed Fixed Overheads)
Less
(Budgeted Fixed Overheads)
Or
(SH × SR) – (BH × SR)
Fixed Overhead Capacity Variance
SR (AH – BH)
Or
(AH × SR) – (BH × SR)
Fixed Overhead Calendar Variance
Std. Fixed Overhead rate per day (Actual no.
of Working days – Budgeted Working days)
Fixed Overhead Efficiency Variance
SR (AH – SH)
Or
(AH × SR) – (SH × SR)
AH* -Actual Hours paid
AH# -Actual Hours worked
17. CHAPTER 14 - MARGINAL COSTING
Contribution
Formula 1:- Contribution per unit = Selling price per unit – Variable Cost per unit
Formula 2:- Total Contribution = Total Sales – Total Variable Costs
Formula 3:- Contribution = Fixed Cost + Profit (Derivation covered in class)
Formula 4:- Contribution = Fixed Cost – Loss (Derivation covered in class)
Contribution to Sales Ratio
Contribution to Sales Ratio = x100 (Expressed in %)
- Called Profit-Volume Ratio (P/V Ratio)
- Fixed Cost is ignored in Decision Making
Formula 5 :- Contribution = Sales x P/V Ratio
P/V ratio = x100 = x100 = x100
P/v ratio = x100
At BEP, Profit = Zero & Sales means BEP Sales
P/V Ratio = x100 (Formula)
Calculating P/V Ratio when profit and sales volume of 2 periods are given.
P/V Ratio =
Calculating P/V Ratio when break-even sales given
Break Even Sales Ratio and MOS Sales Ratio
Cash BEP
Minimum level of sales at which company is able to recover out fixed cost incurred in cash.
Cash BEP in units= Cash Fixed cost
contribution per unt
Cash BEP in rupees = cash Fixed cost
PV ratio
Cash fixed cost = Total FC – Non-FC
Non-cash FC are those which do not involve cash outflow e.g. depreciation
Margin of safety sales
contribution
sales
sales-variablecost
sales
fixedcost+profit
sales
fixedcost-loss
sales
fixed cost + profit
sales
fixed cost
break even sales
difference in profit
difference in sales
- Sales generating profit
- MOS sales means excess of actual sales
over break-even point sales
MOS Sales units = profit
contribution per unit
MOS Sales in Rs. = profit
pv ratio
Break Even Sales ratio + MOS Sales Ratio = 100%
Variable cost to sales ratio
variable cost to sales ratio = x100
If variable cost to sales ratio is 60% then it means that if
sales is made for Rs. 100 the variable cost of Rs. 60 is incurred
variable cost
sales
Relation between PV Ratio & Variable Cost to Sales Ratio
Relation between PV Ratio & Variable Cost to Sales Ratio
P/V Ratio + variable cost to sales ratio = 100%
Required sales level to earn desired profit
Desired level of Sales (In units) =
(Sum of BEP Sales and MOS Sales Formula)
Desired level of Sales (In Rs.) =
(Sum of BEP Sales and MOS Sales Formula)
fixed cost + profit
contribution per unit
fixed cost + profit
p/v ratio
Merger of 2 departments or companies
If management of 2 or more companies decides to merge companies which are operating at
same or different capacity level then Merged company desires to know following things:-
1. P/V Ratio
2. BEPin rupees
3. Capacity utilization at BEP
4. Desired Sales
5. Desired Profit
6. Desired capacity utilization of merged plant
Step1 :- Make marginal cost equation of all companies at 100% capacity level
Step2 :- Add all figures to calculate Sales, Variable Costs, Fixed Costs and Contribution of
merged company.
Note :- Fixed cost shall include additional fixed cost involved in merger, if any
P/V Ratio of merged co. = Total contribution of all co.at 100% capacity
Total sales of all co.at 100% capacity
BEP in rupees of merged co. = Total Fixed cost of all co.+Additiona FC of merger,if any
PV Ratio of merged co.
Capacity utilization at BEP of merged co. = BEPof merged co.
Total sales of merged co.at 100% capacity
Desired sales to earn given profit = Fixed cost of merged co.+desired profit
PV Ratio of merged co.
Capacity utilization at desired sales = desired sales
Total sales of merged co.at 100% capacity
x100
x100
x100
x100
x100
Shut down Point
Decision as to whether Produce or discontinue loss making product
FC is divided in 2 category :-
Unavoidable FC :- FC which has to be incurred whether or not item is produced.
Avoidable FC :- FC which can be avoided by stopping production.
SDP Sales (units) = Avoidable Fixed Cost
contribution per unit
SDP Sales (Rs.) = Aviodable FC
PV Ratio
Avoidable FC = Total FC – Unavoidable FC
Absorption Vs Marginal costing:-
Income statement under Marginal costing approach
Particulars Amount (Rs.)
Variable (Direct Material Cost) XX
Variable (Direct Labour Cost) XX
Variable (Direct Expenses) XX
Variable Factory OH XX
Variable manufacturing cost of Quantity Produced XX
Add:- Opening FG XX
Less:- Closing FG (XX)
Variable manufacturing cost of Quantity Sold XX
Add:- Variable Office &Admin OH XX
Add:- Variable Selling & Distribution OH XX
Variable Cost of Sales (A) XX
Sales (B) XX
Contribution (B –A) XX
Less:- Fixed Factory OH (XX)
Fixed Office andAdmin OH (XX)
Fixed Selling & Distribution OH (XX)
Profit XX
Income statement underAbsorption costing approach
Particulars Amount (Rs.)
Variable (Direct Material Cost) XX
Variable (Direct Labour Cost) XX
Variable (Direct Expenses) XX
Variable Factory OH XX
Fixed Factory OH absorbed units produced x standard rate per unit XX
Total manufacturing cost of Quantity Produced XX
Add:- Opening FG XX
Less:- Closing FG (XX)
Total manufacturing cost of Quantity Sold XX
Add:- Variable Office &Admin OH XX
Fixed Office andAdmin OH XX
Variable Selling & Distribution OH XX
Fixed Selling & Distribution OH XX
Add:- Under absorbed OH (Actual OH incurred – OH absorbed) XX
Less:- Over absorbed OH (OH absorbed –Actual OH incurred) (XX)
Total Cost of Sales (A) XX
Sales (B) XX
Profit (B –A) XX
Reason for difference in profit
Particulars Amount (Rs.)
Profit under marginal costing Xxx
Add:- Opening stock Excess in marginal costing Xxx
Closing stock Excess in absorption costing Xxx
Less:- Opening stock Excess in absorption Costing (xxx)
Closing stock Excess in Marginal costing (xxx)
Profit under absorption costing Xxx
Break Even Point Sales
BEP Sales means “No Loss Sales” OR “Survival Sales”
BEP (In units) = Fixed Cost
contribution per unit (Formula 1)
BEP Sales in rupees = Fixed Cost
p/v ratio (Formula 2)
18. Chapter 15 - BUDGETARY CONTROL
ControlRatio FlexibleBudget
FlexibleBudget
Thisbudgetispreparedatdifferentlevelofproduction.Wedividealltypesofexpensesinto3
categorieswhilemakingthisbudget
a.Variableexpense=Feature(variablecostremainsameatperunitatalllevels)
b.Fixedexpenses=Feature(Fixedcostintotalityremainsameatalllevels)
c.Semi-variableexpenses=NeitherVariableExp.NorFixedExp.
Variableportioninsemi-variablecost = Differenceintotalsemi-variablecost
Differenceinunits
Fixedportioninsemivariablecost=Totalsemivariablecost–Totalvariableportioninsemi-variablecost.
DIFFERENTBUDGETS
Sales Budget
- Sales target (In units & In Amount)
- Actual Sales compared with Budgeted
- Analyse Sales Variances
Production Budget
- Units to be produced
- Budgeted production = budgeted Sales + closing stock of finished
goods – opening stock of finished goods
Raw Material Budget
- Raw material to be purchased = budgeted production x raw material
requirement per unit
Production Cost Budget
- Cost which should have been incurred for the budgeted production level.
- Budgeted production cost is compared with actual production cost
- Analyse variance
Activity Ratio
std hours for actual output obtained
budgeted hours for budgeted production
Capacity ratio
actual hours worked
budgeted hours for budgeted production
Efficiency ratio
std.hours for actual output obtained
actual hours worked
Activity ratio = Capacity ratio x efficiency ratio
x100
x100
x100
=
=
=
Zerobasebudgeting(ZBB)
MakebudgetFuturebased(NotPastBased)
Cashbudget
- Estimatedcashinflowsandoutflowsduringthebudgetedperiod.
- Cashaccountismaintainedforpastcashinflowsandcashoutflows.
- Openingcashbalances+estimatedcashreceipts–estimatedcashpayments=closingcashbalance
-