Thurston County Sustainable Food System
•
0 j'aime•380 vues

This report presents a thought-action framework for increasing production and consumption of local and organic foods

Recommandé
Recommandé
Contenu connexe
Tendances
Tendances (20)
En vedette
Similaire à Thurston County Sustainable Food System
Similaire à Thurston County Sustainable Food System (20)
Plus de Greg Schundler
Plus de Greg Schundler (20)
Dernier
Dernier (15)
Thurston County Sustainable Food System
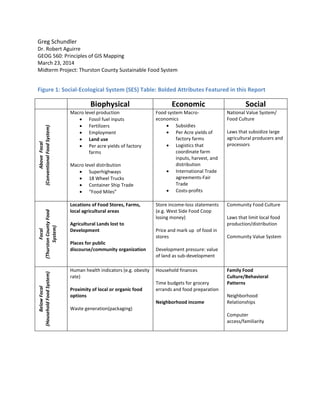
- 1. Greg Schundler Dr. Robert Aguirre GEOG 560: Principles of GIS Mapping March 23, 2014 Midterm Project: Thurston County Sustainable Food System Figure 1: Social-Ecological System (SES) Table: Bolded Attributes Featured in this Report Biophysical Economic Social AboveFocal (ConventionalFoodSystem) Macro level production Fossil fuel inputs Fertilizers Employment Land use Per acre yields of factory farms Macro level distribution Superhighways 18 Wheel Trucks Container Ship Trade “Food Miles” Food system Macro- economics Subsidies Per Acre yields of factory farms Logistics that coordinate farm inputs, harvest, and distribution International Trade agreements-Fair Trade Costs-profits National Value System/ Food Culture Laws that subsidize large agricultural producers and processors Focal (ThurstonCountyFood System) Locations of Food Stores, Farms, local agricultural areas Agricultural Lands lost to Development Places for public discourse/community organization Store income-loss statements (e.g. West Side Food Coop losing money) Price and mark up of food in stores Development pressure: value of land as sub-development Community Food Culture Laws that limit local food production/distribution Community Value System BelowFocal (HouseholdFoodSystem) Human health indicators (e.g. obesity rate) Proximity of local or organic food options Waste generation(packaging) Household finances Time budgets for grocery errands and food preparation Neighborhood income Family Food Culture/Behavioral Patterns Neighborhood Relationships Computer access/familiarity
- 2. Figure 2: Entity-Relationship Table Entity Relationship Source "Border" Thurston County Border Thurston County Data Disc UW Library "Fire Stations" Potential Distribution Node Thurston County Data Disc UW Library "Schools" Potential Distribution Node Thurston County Data Disc UW Library "Park Points" Potential Distribution Node Thurston County Data Disc UW Library "Roads" Distribution Routes Thurston County Data Disc UW Library "Canoe Routes" Distribution Routes Custom Drawn "Farmer Markets" Distribution Point Custom Geocode "Food Coops" Distribution Point Custom Geocode "Farms" Production/Distribution Point Custom Geocode "Churches" Production/Distribution Point Custom Geocode "Fire Station" Production/Distribution Point Custom Geocode "Schools" Production/Distribution Point Custom Geocode "Private Marina/Launch" Production/Distribution Point Custom Geocode "Park Points" Production/Distribution Point Custom Geocode "Public Marinas" Production/Distribution Point Custom Geocode "Citizen Allies" Production/Distribution Point Custom Geocode Developed Open Space Potential Food Production Area National Land Cover 2006 Grassland Potential Food Production Area National Land Cover 2006 Pasture/Hay Potential Food Production Area National Land Cover 2006 Cultivated Crops Present Food Prodution Area National Land Cover 2006 USA Meals at Restaurants Social Behavior ESRI 2012 Consumer Spending USA Average Household Size Social Behavior ESRI US Updated Demographic Data USA Food Away from Home Social Behavior ESRI 2012 Consumer Spending USA Food at Home: Fruit & Vegetables Social Behavior ESRI 2012 Consumer Spending USA Average Household Income Social Behavior ESRI US Updated Demographic Data USA Meals at Restaurants Social Behavior ESRI 2012 Consumer Spending
- 3. Figure 3: National Food Production (Above Focal Scale) Figure 4: Washington State Endangered Farmland (Above Focal)
- 4. Figure 5: Focal Scale Below, Family Food Choices
- 5. Figure 4: Thurston County (Focal Scale): Sustainable Food System Displays Potential County Resources for Agriculture, Public Meeting Points, Landings for Watercraft, Roads, and Canoe Routes
- 6. The process of creating the Thurston County Sustainable Food System map was a learning experience both in design and in software capabilities. I wanted to explore what was possible in imagining a sustainable food production and distribution system at the county scale. Food ethics have recently found their way into contemporary discourse at all scales from the family dinner table to the White House. Our food choices, when aggregated, are extremely influential to human and environmental health. At the county level, I hypothesize that supporting local food production and distribution is a means to improve employment opportunities for young or unskilled workers as well as a means to maintain open spaces used for agriculture. On a household level, the benefit of a local food system is to enable socially, environmentally, and biologically healthier food choices by increasing access to local foods and organic bulk foods, while saving customers the time of running a grocery errand. The eventual goal, given time and expertise, is to construct a web map application that tracks local food indicators including employment on farms, money spent on local food, garden production, development patterns, land available for local food production, and consumer behavior. Visualization of the local food system will hopefully encourage greater participation in food production, patronage of local producers, and behavioral changes in diet. Mapping will allow us to model how small changes, if brought to scale, could have significant impacts on social and environmental problems. A large portion of agricultural production in Thurston County goes to production of inedible crops including Christmas trees, ornamental shrubs, and sod. NLDC, though lacking resolution does give us a sense of the space available for food production. Despite development, nearly a third of Thurston county’s land area could potentially be utilized for gardening, farming, grazing, orchards, or food forests. “Developed Open Space” includes lawns, yards, parks, and golf courses, some of which is available for gardening or fruit tress. Meanwhile, pasture and hay areas already provide for animals, though it is not clear whether those harvests go to animals inside or outside the county; nor is it known whether those animals are consumed within county lines. It is unclear whether the shrub/scrub class represents unkempt land that is fit for clearing, or areas, whether because of soil composition or moisture, are unsuitable for growing food. Cultivated crops as a designated land cover class, only make up 1.1% of the county’s land area. Not included in the land cover class are fishing areas or shellfish aquaculture areas. The general conclusion from the NLCD analysis is that local food still represents a tiny fraction of the entire food system and significant incentives must be aligned if a change to the current equilibrium is desired. Open Water 0.9% Developed Open Space 9.8% Developed Low Intensity 6.0% Developed Medium Intensity 2.0% Developed High Intensity 0.6% Barren/Rock/Clay 0.4% Deciduous Forest 5.2% Evergreen Forest 31.5% Mixed Forest 10.4% Shrub/Scrub 12.8% Grassland 5.5% Pasture/Hay 7.2% Cultivated Crops 1.1% Woody Wetlands 4.5% Emergent Herbaceous Wetlands 2.3% TOTAL 100.0% Figure 6: National Land Cover Dataset for Thurston County (percent total acreage)
- 7. I was fortunate to find that the Dashboard application provided datasets that inform the “demand side” of the local food system. “USA Food at Home: Fruit and Vegetables”, “USA Average Household Income”, “USA Meals at Restaurants/Other”, “USA Average Household Size”, and “USA Food Away from Home” all provide data at census block group resolution. The” Boston Harbor” block group (Census # 530670121.003) contains the “Boston Harbor Marina” represented by the purple star on the Figure 4 inset map. The “Carlyon Beach” block group (Census# 530670119.001) contains the “Carlyon Beach Marina” represented by the red star on the Figure 4 inset map. Their “demand side” attributes are compared in the following table: Boston Harbor Marina Carlyon Beach Marina USA Average Household Income $131`,770 $97,273 USA Food at Home: Fruit & Vegetables $1,679 $1,239 USA Food Away From Home $5,625 $4,153 USA Average Household Size 2.3 2.3 USA Food at Home $8,690 $6,415 USA Meals at Restaurants $5,122 $3,781 In order to model the economic value of an errand foregone, I calculated the round trip of a customer to the nearest Food Coop (See Figure 5). I used the following assumptions: a $4 per gallon price of gasoline, a 20 mpg vehicle, a shopping time of 45 minutes, the time given by Google Maps for an automobile round trip, and a $10/hour value of time. The resulting calculations are on the left side of Figure 5. On the right side of Figure 5 we see the assumptions that underlie the alternative canoe-based transport model: $10 per hour pay for workers, 3 hours worker time additional to transport, total hours spent in transport, the total payload of the canoe, the number of customers served (15), and the fair transport share (20 pounds). The income level of the Boston Harbor neighborhood as well as its average budget spent on fruits and vegetables, disposable income represented by money spent on food away from home, and price point ($10 delivery fee) all make it a more attractive proof-of-concept route to target. The Boston Harbor Marina is a public dock, sees more traffic, and is anecdotally much more open to supporting this idea. In addition, Boston Harbor often has freshly caught seafood, which could be brought back to the Olympia Food Coop on the return trip to prevent a so-called “dead head” trip, where no cargo is carried on the return leg. Marketing efforts in 2014 should be concentrated on Boston Harbor and the transportation route from Food Coop to the Marina should be tested. In addition, bicycle transportation routes or the operation of vegetable oil trucks can be modeled with Network Analyst. It would be interesting to use social media to solicit garden area data from the general public. Alternatively, one neighborhood could provide a “transect” study to understand how much garden food production occurs on the household level.
- 8. Figure 5: Costs Compared: Conventional Errands and Canoe Based Delivery
- 9. Comments on Cartographic Design and Best Practices Worksheet The challenge in creating this map was to imply a different process model for food distribution based on a current representation model. Because the potential process model is undetermined and flexible, it is not clear whether churches, parks, marinas, or schools, or a combination thereof would participate in a future community collaborative food system. In addition the feature class of “citizen allies” is presented to suggest that the network can be self-organizing and directed using private property/homes. Choosing the right scale was difficult because I wanted specific locations and symbols to be identifiable without clutter, but I also wanted southern areas of Olympia with farms and “cultivated crop” land cover to be visible. Meanwhile, there had to be enough “deadspace” on the map to contain the location and inset maps as well as the extensive legend. Other nuances are summarized in the following table: STATIC MAP WEB MAP What type of Map? The map I produced was a qualitative thematic map described in Dent p. 7 as “structural features…directional relationships, patterns of location” The web map combines the qualitative thematic static map with quantitative thematic data from the Esri Database. What Map Projection is Used? NAD_1983_StatePlane_Washington_South_FIPS_4602_Feet Projection:Lambert_Conformal_Conic I was not sure where to obtain this information in Operations Dashboard What are the Geographic Phenomena of Interest? The geographic phenomena of interest are community nodes that can and do serve as distribution points in a local food system. Of secondary interest, are food production points and areas. The Geographic phenomena interest is the spatial variability of economic data including income and consumer behavior Geographic Data Used Public data from Thurston County provided schools and fire stations. Parks, farms, and churches were all custom geocoded from Google search results. Data from the Esri 2012 Consumer Spending Survey and 2012 Demographic database # of Data Classes Used 4 data classes were used for land cover: Grassland, Cultivated Crops, Pasture/Hay and Developed Open Space. The abstract symbols did not follow any classification scheme. 5 or 6 data classes were used depending on the dataset Data Classification Scheme No data classification was used since the land cover data was derived from raster data and the abstract symbols were not classified. It was hard to determine what classification scheme was used. I know for sure it was not equal interval Color In order to simultaneously display land use and locational attributes, I chose to represent only a few classes of land use in light colors. Because “cultivated crops” is the greatest land use of interest, I chose the color red to stand out prominently. I also chose a light gray for the road network so that it would not block or clutter the view of the other attributes. The layers from the Esri database were presented as a chloropleth. I was not sure how to manipulate the colors. How was type used in the map? Because there was so much data represented in the map and I wanted to allow high resolution for any Olympia resident to see their own Type was limited to the legend only and for reference names on the base map. Cartographic Design I wanted to make sure the scale bar was not confused with the inset or location map and so put it directly under the legend I didn’t understand how to manipulate cartographic features in the Operations Dashboard/Web Map App Cartographic Design I made sure that all of the abstract symbols used a black outline N/A Cartographic Design Although I did not explicitly group feature classes by symbol, I used triangles for “community” locations. Stars were used mostly for points that have a boat launch of some kind (although some parks are inland). N/A Cartographic Flaw I did not include a scale bar in the inset or location map (I was not sure how to do this in ArcMap) The size of the abstract symbols does not change with the zoom level of the map. When viewed at a small scale level, the symbols crowd onto one another. Cartographic Flaw I did not include a scale ratio on any of the maps Some of the data did not translate over to the webmap including land cover for developed open space and pasture/hay Cartographic Flaw The title of the map is “Thurston County”, but only Northern Thurston County is featured her