1. Technical analysis
Tuesday 5 January 2010
5 January 2010 Challenge 2010 – Season 1
Jean-Christophe Dourret Summary
Technical analyst, CFTe
+33 (0)1.40.17.52.09 a) Combined summary of themes analysed
jcdourret@oddo.fr
Themes Short term Medium term Long term
I – Technical environment (partially)
II – Charts
III – Intermarket links =
IV – Sectors and stocks
• Over the short term, our themes as a whole point to a possible last-ditch
rally spanning late 2009 and early 2010. There is a wealth of evidence to
suggest that the current upswing – that emerged in late 2009 – is limited in
both upside and duration.
• Over the medium term, it is highly unlikely that equity indices as well as
commodities will be able to circumvent a significant secondary reaction to
the downside. We expect this to materialise in Q1 2010.
• The counter-trend decline in Q1 2010 will probably not signal the start of a
new bear market. More likely, the correction (however sharp it may be) will
subsequently pave the way for another major advance, corresponding to
the third phase of the primary upcycle initiated in March 2009.
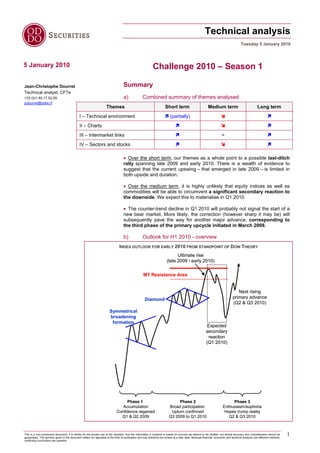
b) Outlook for H1 2010 - overview
INDEX OUTLOOK FOR EARLY 2010 FROM STANDPOINT OF DOW THEORY
Ultimate rise
(late 2009 / early 2010)
MT Resistance Area
Next rising
Diamond primary advance
(Q2 & Q3 2010)
Symmetrical
broadening
formation
Expected
secondary
reaction
(Q1 2010)
Phase 1 Phase 2 Phase 3
Accumulation Broad participation Enthusiasm/euphoria
Confidence regained Upturn confirmed Hopes trump reality
Q1 & Q2 2009 Q3 2009 to Q1 2010 Q2 & Q3 2010
This is a non-contractual document; it is strictly for the private use of the recipient, and the information it contains is based on sources we believe to be reliable, but whose accuracy and completeness cannot be
guaranteed. The opinions given in the document reflect our appraisal at the time of publication and may therefore be revised at a later date. Because financial, economic and technical analysis use different methods,
1
conflicting conclusions are possible.
2. Technical analysis
Tuesday 5 January 2010
c) Key supports and resistances
Major supports Major resistances
Indices
Long term Medium term Medium term Long term
S&P 500 950 943.8 [1132.6-1219.5] 1150, 1400
DJ Industrial 9000 9026 [10210-10994] 10700, 11670
DJ Transport 2000 [2987-3434] [4287-4734], 4635 5487
DJ Utilities 294.3, 307 360, [324.4-340.8] 422, 460 470
Nasdaq [1261-1350] 2168, [2024-2190] [2430-2550] 2900
DJ Stoxx 600 162.2, 165.8 214.2 [252.7-272.7], 262.5, 290 300
Eurostoxx 50 1847, 2000 2330, 2600 [2978-3272], 3000, 3450 3900
Cac 40 2465, 2581 3400, 3100 [3848-4289], 4002, 4500 5303
Nikkei 225 7000 9000 [11565-11721] 10788, 12000, 14500
d) Approximate idea of prospective highs/lows by timeframe
Themes < 1 month 1-3 months 3-6 months > 6 months
ROUGH IDEAS OR TARGETS?
S&P 500 1168 960 1150 1250
The opposite table aims to DJ Industrial 10700 9100 10500 11500
show approximate values that DJ Transport 4530 3600 4400 5400
can be estimated under our
present scenario. DJ Utilities 417 370 410 458
Nasdaq 2350 2050 2300 2550
Signals (targets are set only
DJ Stoxx 600 265 220 255 285
when a position is
recommended, reversions to Eurostoxx 50 3150 2650 3050 3450
neutral, etc.) are dealt with in Cac 40 4170 3450 4000 4450
our Technical Overview. The
goal of this report is to Nikkei 225 10800 9000 11500 12000
provide ballpark estimates Eurobund 118.1 121.0 116.7 114.8
that will then be fined tuned
via our daily publications. EUR / USD 1.5030 1.4300 1.5000 1.6000
EUR / GBP 0.9200 0.9000 0.9460 0.9790
Commodity Index 513 440 490 530
WTI 86.5 66 82 100
Gold ounce 1100 1100 1185 1295
e) Sector plays and stock picks/avoid recommendations
STANCE SECTOR STOCKS TO AVOID STOCK PICKS
AVOID Chemicals Air Liquide, Akzo Nobel, Bayer,
(Underperformance Casino, Delhaize, BAE Systems, Tha-
Retail Syngenta, Carrefour, Areva, Siemens,
emerging or les, Thyssen, Vallourec
Industrial Goods Suez Environnement
underway)
GIVE PRIORITY Technology Alcatel, Atos, Cap Gemini, Iliad, E.ON,
(Outperformance Utilities Logica, Nokia, SAP, Lagardère, BG EDF, EDF Energies Nouvelles, GDF,
emerging or Medias Group, Technip Veolia, B Sky B, JC Decaux, Pearson,
underway) Oil & Gas TF1, Vivendi, ENI, Royal Dutch, Total
STOCKS TO AVOID STOCK PICKS
Daimler, Crédit-Agricole, Deutsche Bank, BHP-Billiton, Salzgitter, Imerys, Danone, Unilever,
AngloAmerican, Randgold, Adidas, Ubi Soft, Saint- MAN Group, AstraZeneca, Roche, Sanofi, British
Gobain, Nestlé, Julius Baer, L.S.E., Aegon, ING Land, Axa, British Telecom, Deutsche Telekom,
Group, Cable & Wireless Vodafone, Air France
This is a non-contractual document; it is strictly for the private use of the recipient, and the information it contains is based on sources we believe to be reliable, but whose accuracy and completeness cannot be
guaranteed. The opinions given in the document reflect our appraisal at the time of publication and may therefore be revised at a later date. Because financial, economic and technical analysis use different methods,
2
conflicting conclusions are possible.
3. Technical analysis
Tuesday 5 January 2010
Contents
Part I – Technical environment ............................ 4
I - Asset allocation ................................................................. 4
II – The liquidity perspective .................................................. 5
III – Investor psychology........................................................ 8
IV – Breadth and sentiment ................................................... 8
V – Round up ...................................................................... 10
Part II - Charts ................................................... 11
. I – Dow Theory..................................................................... 11
a) Uptrends intact .................................................................................. 11
b) A confirmed uptrend .......................................................................... 12
c) A counter-trend decline that is sorely lacking! ................................... 12
d) Lines.................................................................................................. 13
II – Chart configurations ....................................................... 14
III - Zones, supports and resistances ................................... 16
IV – Market indicators........................................................... 17
a) Moving averages ............................................................................... 17
b) Status of LT momentum .................................................................... 18
c) Combined analysis of trend, momentum and volumes ...................... 19
V – Round up ....................................................................... 21
Part III – Intermarket links.................................. 22
I – Long-term debt................................................................ 22
a) T-Notes.............................................................................................. 22
b) Eurobund........................................................................................... 23
II - Commodities ................................................................... 25
a) Broad overview.................................................................................. 25
b) Continuous Commodity Index ........................................................... 25
c) WTI .................................................................................................... 27
d) Gold ounce ........................................................................................ 28
III - Currencies...................................................................... 29
IV – Round up ...................................................................... 30
Part IV - Sectors and stocks .............................. 31
I - Sectors’ status in late 2009/early 2010 ........................... 31
II - Sector picks and overview of momentum....................... 32
III - Sector clusters and business cycle ............................... 33
IV – Sector and stock prospects.......................................... 35
a) Stock picks in line with sector-based analysis ................................... 35
b) Stock-picking independently of sector considerations ....................... 35
Appendix: bibliography ...................................... 36
This is a non-contractual document; it is strictly for the private use of the recipient, and the information it contains is based on sources we believe to be reliable, but whose accuracy and completeness cannot be
guaranteed. The opinions given in the document reflect our appraisal at the time of publication and may therefore be revised at a later date. Because financial, economic and technical analysis use different methods,
3
conflicting conclusions are possible.
4. Technical analysis
Tuesday 5 January 2010
Part I – Technical environment
As we turn the corner into 2010, we might rightly ask ourselves about the
technical context. Our analysis in this section will shed some light on the
question.
I – Asset allocation
The following table shows the technical status of the leading three asset
classes (bonds, equities and commodities) as we head into 2010 based on
key ratios.
Naturally, ratios cannot be interpreted in the same manner when analysing in
the long or short term.
Ratio Short term Medium/long term
Bonds/Commodities
Stocks/Commodities
Stocks/10-year bonds
LONG TERM
WEEKLY – T-NOTES / COMMODITY INDEX • The ratio of T-Notes against Commodities started to
decrease in March 2009. The most important indication it can
give us are the points of reversal (marking the time when
trendlines were breached). When the ratio punches below a
trendline, this reveals that commodities are developing
positively. This can be taken as a buy signal confirming
trends or recoveries observed on other financial markets. On
the other hand, upside violations frequently coincide with the
onset of consolidation on commodities (and the sectors
thereto related), yielding a confirmed sell signal on equities.
The ratio’s trajectory both now and over the longer term
portrays conditions supportive of equities. However, our
momentum oscillator (marked by red circle) is staging an
upside cross suggestive of a likely upswing in early 2010.
• The stocks/commodities ratio is decreasing over the long
term, signalling reversion to a stock-market environment
perceived as more prone to inflation, and points towards a
rise in long-term yields over 2010.
• The ratio between equities and long-term yields is rising over the
medium/long term. The course followed by long-term yields is not yet
dampening the outlook for equity markets; nonetheless, this ratio has
reached overbought territory and could swing to the downside in the initial
months of 2010.
SHORT TERM
• Over the short term, the market continues to prefer commodities to bonds
and is not showing any early indications of a reversal.
This is a non-contractual document; it is strictly for the private use of the recipient, and the information it contains is based on sources we believe to be reliable, but whose accuracy and completeness cannot be
guaranteed. The opinions given in the document reflect our appraisal at the time of publication and may therefore be revised at a later date. Because financial, economic and technical analysis use different methods,
4
conflicting conclusions are possible.
5. Technical analysis
Tuesday 5 January 2010
• The stocks/commodities ratio is decreasing, signalling that investors have
recently bought back into commodities and the related stocks and sectors
with a vengeance. The thing is, commodities are primarily assets that lag
behind the cycle. Recent outperformance by commodities relative to equities
as a whole (as in 2008) suggests that the uptrends driving shares are close
to ending.
• Over the short term, initial pressure stemming from long-term debt is
starting to be felt. The ratio has been in poor shape since mid-December.
SUMMING UP
What does all this mean for equity markets?
Ratio Short term Medium/long term
Bonds/Commodities Positive impact Positive impact
Stocks/Commodities Negative impact Negative impact
Stocks/10-year bonds Negative impact Positive impact
Key points:
1. Over the medium/long term, the only clear sign that the uptrend on
equities is starting to wilt is the recent sharp rise by commodities. But even
though the other ratios are for now supportive, they could well reverse to
the downside in early 2010.
2. Over the short term, warning signs are in more plentiful supply due
to the halt in index upturns coupled with the recent surge in commodities
and initial stress on long-term yields.
3. The prime beneficiary of asset rotation in the closing stages of 2009
has been commodities.
II – The liquidity perspective
Liquidity analysis allows us to take a more in-depth looks at the relationships
between the three asset classes noted above.
For this exercise:
• We have picked a liquidity indicator: M2/Commodities, M2 money supply
deflated by the Commodity Index. More effective normalisation methods may
well exist (such as using the CPI as the deflator), but as Martin Pring rightly
points out, this method confers our analysis a “market” angle missing from
economic indicators.
• We have selected charts representing T-Notes, S&P 500 and the
Commodity Index.
• Rather than showing unadjusted historical price trends for these
underlyings we have instead sought to show momentum and nothing else.
As such, the charts on the following page correspond only to the LT rates of
change for each underlying (i.e. rates of growth and decrease over the LT).
Price lines have been removed.
• Each LT rate of change also shows a short-run signal line.
• All charts indicate monthly change.
This is a non-contractual document; it is strictly for the private use of the recipient, and the information it contains is based on sources we believe to be reliable, but whose accuracy and completeness cannot be
guaranteed. The opinions given in the document reflect our appraisal at the time of publication and may therefore be revised at a later date. Because financial, economic and technical analysis use different methods,
5
conflicting conclusions are possible.
6. Technical analysis
Tuesday 5 January 2010
It is normal for money supply to influence debt markets, which in turn affects
equity markets, which then have an impact on commodities.
CONVENTIONAL "BUSINESS CYCLE"
Bonds
Stocks
Commodities
However, ordinary prices of each underlying can have highly disparate
configurations. Using rates of change, which have a smoothing effect and
facilitate comparison, highlights the conventional economic sequence
between the three asset classes.
PINPOINTING LT DOWNSIDE REVERSAL POINTS VIA LT RATES OF CHANGE
?
?
Generally speaking the following sequence is commonly accepted: a
contraction in deflated money supply, discontinued decline in long-term
yields, a peak in equities followed by a peak in commodities prices.
Of course, this is not foolproof. Momentum has at times got ahead of the
reversal signal supplied by the preceding asset class in the sequence.
This is a non-contractual document; it is strictly for the private use of the recipient, and the information it contains is based on sources we believe to be reliable, but whose accuracy and completeness cannot be
guaranteed. The opinions given in the document reflect our appraisal at the time of publication and may therefore be revised at a later date. Because financial, economic and technical analysis use different methods,
6
conflicting conclusions are possible.
7. Technical analysis
Tuesday 5 January 2010
The long-term technical status flagged by the above chart is that bearish
signals have appeared in terms of market liquidity and the direction of
yields on long-term US debt.
PINPOINTING LT UPSIDE REVERSAL POINTS VIA LT RATES OF CHANGE
The charts also substantiate the conventional chronological order.
The main lesson is that following positive liquidity stimulus in 2007 (with the
onset of the uptrend on bonds) and 2008 (bull signal on liquidity indicator),
equities and commodities issued a long-term bull signal as recently as in
November 2009.
SUMMING UP
1. Mounting constraints arising on liquidity (which is contracting)
and debt markets (with the discontinued decline in long-term yields) will
have a bearing on equity markets in the months ahead.
2. Even so, both shares and commodities are in good shape over
the long term on the momentum front (i.e. solely from this angle). This
suggests that the negative fallout from the preceding point will not result in
a major downside-reversal signal for some time yet – perhaps not until
2011 or even later.
For now, as we head into 2010, the LT momentum signal is bullish on both
equities and commodities.
This is a non-contractual document; it is strictly for the private use of the recipient, and the information it contains is based on sources we believe to be reliable, but whose accuracy and completeness cannot be
guaranteed. The opinions given in the document reflect our appraisal at the time of publication and may therefore be revised at a later date. Because financial, economic and technical analysis use different methods,
7
conflicting conclusions are possible.
8. Technical analysis
Tuesday 5 January 2010
III – Investor psychology
Throughout this past year we have used several ratios to pinpoint the
investor mindset of the day. As we head into 2010, it is worth asking whether
the market is thinking offensively or defensively?
The following table provides an answer. Rising arrows indicate a bullish
mood (a mindset supportive to appreciation in equities) while falling arrows
mark a defensive slant (bearish for equities).
Ratio Category Short term Medium term
Gold ounce/DJ Stoxx 600 Inter-Asset (since 14 Dec) (since 18 Aug)
Emerging Markets/DJ World Inter-Region (since 28 Oct) (since 20 July)
CME Midcap 400/S&P 500 Intra-Market (liquidity) (since 15 Dec) (since 26 Oct)
DJ Industrial/S&P 500 Intra-Markets (selectiveness) (since 26 Oct) (since 26 Oct)
Food & Beverage/DJ Stoxx 600 Inter-Sector (since 6 Oct) (since 7 Dec)
60% - 40% 100%
These findings highlight the following:
BASELINE SCENARIO EXPOUNDED ON 30 NOV
1. A sharp shift to a defensive bias over the medium term, gradually
1. UPSIDE BREAKOUT OF DIAMONDS coming into play as the uptrend has progressed.
2. ATTAINMENT OF ST TARGETS,
SITUATED INSIDE MT RESISTANCE AREAS
2. The recent resurgence of slightly more bullish conditions over
3. SHARP CORRECTION the short term. Other ST indicators may follow this same path in upcoming
sessions.
MT Resistance Area 3. The combination of the above two findings (a market again more
bullish over the short term but as cautious as ever medium term) tallies
1
with our baseline scenario .
This renewed upward-facing stance over the ST has produced upside
breakouts from diamonds. At the same time, the market remains on the
defensive and will not hesitate to sell positions once targets are attained
and/or if subsequent profit taking takes an aggressive turn. This would then
fuel the secondary reaction over the medium term.
IV – Breadth and sentiment
The observations summed up in the following table do not give much reason
for cheer:
OVERALL PROBABILITY: 60%
Ratio Short term Medium term
Breath
Sentiment Excessive optimism n.m.
Diffusion Bearish divergence Softening
Volumes Distribution Distribution
On the whole, fewer shares drove the latest trend-based upturn in Q3 and
Q4 2009, the market is overcome with euphoria, fewer shares are exhibiting
bullish configurations, and the final part of the year – a period in which
indices generally hold their own – was used to thin out long positions.
1
See our Focus from 30 Nov.: Dubai-related panic under control.
This is a non-contractual document; it is strictly for the private use of the recipient, and the information it contains is based on sources we believe to be reliable, but whose accuracy and completeness cannot be
guaranteed. The opinions given in the document reflect our appraisal at the time of publication and may therefore be revised at a later date. Because financial, economic and technical analysis use different methods,
8
conflicting conclusions are possible.
9. Technical analysis
Tuesday 5 January 2010
BREADTH
Several indicators can offer a view of investors’ participation in the upturn.
Amongst these, broad advance/decline and high/low indicators have
continued to rise. Conversely, more detailed analysis of specific timeframes
(ST and MT) reveals the following:
• Receding participation over both the short and medium
terms. In other words, fewer shares are driving the upturn either in
the US or in Europe: investors are becoming more selective. This
incidentally supports the conclusions from Part III of this report
regarding the market’s current mindset. Selectiveness is problematic
because, at the same time, some indices have managed to rise to
new highs recently. Because these advances were comprised of a
smaller number of stocks, they are more at risk.
• A small proportion of stocks fuelling the formation of new
highs. Less than 10% of stocks on the NYSE are involved in
peak formations. According to Paul Desmond2, this is a weighty
bear signal, one that has shortly preceded the formation of
14 market tops on the DJ Industrial over the course of time.
• The Bullish Percent Index,3 showing the proportion of
shares trading with point and figure buy signals, is signalling
bearish prospects on the NYSE and a confirmed bear climate on
Nasdaq. This indicator is showing percentages of 70% on the NYSE
compared with 84% in September and 59% on Nasdaq compared
with 74%. This indicates that recent upturns have been substandard
in quality. A growing proportion of shares has been buoyed by the
rising tide despite no longer benefiting from positive charts (which
would signal a bullish mindset). They will have no trouble
accompanying the decline once the correction takes hold.
SENTIMENT
The swift resolution of fallout stemming from Dubai has given investors a
false sense of security. At the end of 2009, there were three times as many
buyers as there are sellers – levels on a par with June and September 2007.
This does not portend that the stockmarket trend in store for 2010 will be the
exact replica of that witnessed in 2007/2008. Rather, it emphasises beyond
any doubt the excessive optimism raging in the market.
DIFFUSION
• Over the medium/long term, the proportion of shares still
trading above moving averages has ebbed to 90% on the S&P 500
(from 95% in Sept.) and 86% on the NYSE (down also from 95%). A
restricted number of stocks are starting to consolidate over the
medium/long term.
• Over the short term, bearish divergence has been looming
large since September/October – signalling the inability of a growing
cluster of stocks to sustain the advances on equity indices.
2
See feedback on 2009 IFTA conference, available from us shortly.
3
Or BPI.
This is a non-contractual document; it is strictly for the private use of the recipient, and the information it contains is based on sources we believe to be reliable, but whose accuracy and completeness cannot be
guaranteed. The opinions given in the document reflect our appraisal at the time of publication and may therefore be revised at a later date. Because financial, economic and technical analysis use different methods,
9
conflicting conclusions are possible.
10. Technical analysis
Tuesday 5 January 2010
VOLUMES
Most dedicated volume oscillators are exhibiting distribution over both short
and medium terms, on a wide array of indices (e.g. Cac 40, DJ Industrial and
Nasdaq).
Taken by itself, this is not a bearish indication; it may simply reflect end-of-
year adjustments in investment portfolios as opposed to selling in anticipation
of a downturn. As such, recent distribution may have a supportive effect over
the short term. If equity indices can sustain their upward trajectory in the new
year, there will be a “catch-up effect”. Investors will have to buy back the
stocks they jettisoned too early.
Even so, in the meantime (and from a more pragmatic standpoint), indices
are stabilising in a climate of mistrust and amid technical selling.
V – ROUND UP: Technical environment
Ratio Short term Medium term Long term
Asset allocation (heading ) n.m.
Liquidity and LT cycles n.m. n.m.
Market psychology (40%) - 60% n.m.
Breadth and sentiment n.m.
Altogether, equity markets are entering 2010 in an adverse technical
environment, broadly speaking.
But we should specify the following:
1. Information relating to short-term conditions insinuates support for a
last-ditch rise (following recent upswing in the market’s mood) while
underlining the limits and vulnerability of the latter.
2. The market’s fragility over the short term warrants expectations for a
short-lived upturn while medium-term observations reaffirm the
imminence of bearish secondary reaction. The correction – expected in
Q1 2010 - is likely to be sharp.
3. Analysis of long-term cycles between asset classes points to a
major bullish slant on equities and commodities. Consider:
REVISED SCENARIO TAKING LT OBSERVATIONS INTO a) We are talking long term. This finding does not
ACCOUNT rule out a correction spanning the short or medium term.
Ultimate rise b) Even now we can project that the market is not
(late 2009 / early 2010) heading for a full trend reversal in 2010 in the wake of the
prospective MT correction in Q1 2010. After the counter-
MT Resistance Area trend decline, the market is likely to bounce back and revert
to the primary uptrend initiated in March 2009.
Next rising The end result is a probable trend-based upturn in the wake of
Diamond primary advance the MT correction expected for Q1 2010. This is crucial (and new)
(Q2 & Q3 2010)
information suggesting that we should buy once the MT counter-
trend decline is over – regardless of how sharp it is – rather than
revert to neutral at that point. That would be too passive a stance in
Expected the light of the long-term cycle.
secondary
reaction
(Q1 2010)
This is a non-contractual document; it is strictly for the private use of the recipient, and the information it contains is based on sources we believe to be reliable, but whose accuracy and completeness cannot be
guaranteed. The opinions given in the document reflect our appraisal at the time of publication and may therefore be revised at a later date. Because financial, economic and technical analysis use different methods,
10
conflicting conclusions are possible.
11. Technical analysis
Tuesday 5 January 2010
Part II – Charts
At which stage within Dow Theory are equity index trends located? What are
the dominant chart configurations as we head into 2010? What are the
supports and resistances that must be watched above all? How are indicators
shaping up at the cusp of the new year?
I – Dow Theory
Regarding Dow Theory three key points are worthy of note as we head into
2010:
1. Uptrends remain intact over the ST and MT.
2. The three Dow Jones indices are rising in tandem. In this instance,
the upturn on the DJ Industrial has been endorsed by the DJ Transport and
DJ Utilities.
3. Two pivotal US indices – the S&P 500 and the DJ Industrial – are
sorely lacking a bearish secondary reaction.
However, there are no indications at this juncture that the prospective
correction will retrace the whole of the preceding advance. In fact,
retracement to the downside will probably be only partial and will not
undermine the primary upcycle initiated in March 2009.
a) Uptrends intact
The following charts play down the bearish views currently doing the rounds.
Dow Theory is highly pragmatic in its approach, describing price trends rather
than trying to forecast their future direction. There can be no doubt that US
equity indices are following uptrends at the moment.
WEEKLY – DJ INDUSTRIAL (TOP) & DJ TRANSPORT (BOTTOM) WEEKLY – DJ INDUSTRIAL (TOP) & DJ UTILITIES (BOTTOM)
In the medium term, the DJ Industrial is forming systematically higher peaks
and troughs. This same pattern emerged on the DJ Transport in July and
recently, in December, on the DJ Utilities.
The latest breach in a MT high, on the DJ Utilities, has delivered a message
of strength just as a last-ditch ST upswing is expected to materialise –
before the counter-trend decline takes hold.
This is a non-contractual document; it is strictly for the private use of the recipient, and the information it contains is based on sources we believe to be reliable, but whose accuracy and completeness cannot be
guaranteed. The opinions given in the document reflect our appraisal at the time of publication and may therefore be revised at a later date. Because financial, economic and technical analysis use different methods,
11
conflicting conclusions are possible.
12. Technical analysis
Tuesday 5 January 2010
THEORETICAL ASIDE
Incidentally, it is plainly clear that the strength of Dow Theory lies not in its
ability to forecast reversals but to ratify new trends.
To take the example of the DJ Industrial on its own, the downside reversal in
its MT trend was only signed and sealed in June 2008, which is late4.
However:
INTERMEDIATE OSCILLATIONS 1. It is not the job of Dow Theory to project the future. Rather it
observes whether a trend is still in action or has been reversed. Naturally,
AN INTERMEDIATE OSCILLATION IS COMPRISED when price analysis is applied to the long and short terms separately,
OF: shades of distinction quickly emerge and the price action is then better
understood. However, it is first and foremost a factual, descriptive
1. AN INTERMEDIATE MOVE IN THE SAME approach.
DIRECTION AS THE PRIMARY CYCLE
2. A SECONDARY REACTION 2. Confirmation of a trend reversal using Dow Theory delivers a strong
signal, making it possible to avoid taking contrarian positions at that
Bearish specific time and ascertain the right position in a trend at a time when we
secondary would rather pull back from the market.
reaction
3. A trend reversal that is ratified by Dow Theory at times will offer the
very last entry point into a trend when other technical methods have failed
Intermediate 5
to anticipate a reversal in trend with a satisfactory level of probability .
advance
b) A confirmed uptrend
A new trend cycle is only valid if confirmed by two indices (the crucial
relationship is represented by the ties that bind the DJ Industrial with the DJ
Rising Transport) and possibly a third one as well (DJ Utilities).
primary trend
The current MT uptrend was flagged simultaneously by the DJ Industrial and
DJ Transport in July 2009 but was only recently endorsed by the DJ Utilities.
This decisive surge (triggering a reversal in MT trend to the upside on
utilities) came in the nick of time. A renewed bullish mood in one of the
Intermediate market’s spaces may temporarily provide fuel for the upside extension
oscillation expected on equities at the start of the new year.
c) A counter-trend decline that is sorely lacking!
Secondary
rallye It is widely known that during uptrends each intermediate oscillation is
Intermediate comprised of an intermediate advance and a secondary reaction to the
decline downside. During a downtrend, the terminology would be a secondary
reaction to the upside (or bear market rally) followed by an intermediate
decline.
Falling
primary trend
4
However, Dow Theory had issued a strong alert over the status of the uptrend in the
summer of 2007. Additionally, other technical methods had yielded a warning of a
possible reversal in trend as early as August 2007 before flagging the reversal in
Europe and the US in January 2008. Dow Theory is only one piece of the puzzle.
Other technical indicators are better suited to forecasting.
5
This was especially true in July 2009 when upside reversals in trends picked up by
Dow Theory led to us shelving our bear stance (before prices had shot up) and
confidently buying into the new trend as it was materialising.
This is a non-contractual document; it is strictly for the private use of the recipient, and the information it contains is based on sources we believe to be reliable, but whose accuracy and completeness cannot be
guaranteed. The opinions given in the document reflect our appraisal at the time of publication and may therefore be revised at a later date. Because financial, economic and technical analysis use different methods,
12
conflicting conclusions are possible.
13. Technical analysis
Tuesday 5 January 2010
As the following charts indicate, the DJ Industrial and S&P 500 have
produced an ambitious intermediate advance dating from July 2009 … but
neither has staged a secondary reaction.
WEEKLY – DJ INDUSTRIAL DAILY – S&P 500
In the case of the DJ Industrial, the intermediate MT advance has been
particularly strong and has not allowed for retracement of any real magnitude.
As for S&P 500, one could argue that a slightly fuller correction took place in
October. However, this lacked the dimension to suggest that the market had
paused sufficiently for breadth or firmed up its foundations.
Amongst the other factors revealing the continued state of stress in the
market in the wake of this ST correction, the ST upturn was not even
knocked off course by this decline. A genuine MT secondary reaction to the
downside would have easily punched through ST lows. But this is no cause
for concern: a poignant example is likely to emerge in early 2010.
d) Lines
Granted, but have not other indices formed “lines”?
In Dow Theory, lines are ranging markets that can temporary take the place
of a conventional secondary reaction. Instead of declining, investors opt for
6
consolidation over time .
Hesitant configurations in the guise of diamonds (see next section) on
European indices (DJ Stoxx 600, Eurostoxx 50 and Cac 40), or the
broadening formation on Nasdaq, are simply examples of sideways
consolidation or lines under Dow Theory.
On these indices, chart configurations have been firmed up by consolidation
moves (laterally) and in theory should produce a fresh rally.
6
The two forms that consolidation can take – laterally or declining – crops up
regularly in stock analysis contained in our Technical Overview.
This is a non-contractual document; it is strictly for the private use of the recipient, and the information it contains is based on sources we believe to be reliable, but whose accuracy and completeness cannot be
guaranteed. The opinions given in the document reflect our appraisal at the time of publication and may therefore be revised at a later date. Because financial, economic and technical analysis use different methods,
13
conflicting conclusions are possible.
14. Technical analysis
Tuesday 5 January 2010
However, technical analysis has many facets and should take into account a
whole gamut of different factors. Furthermore, this particular slant has some
serious drawbacks:
1. Two heavyweight US indices have not staged standard
consolidation moves. The onset of secondary reactions on these two
indices (S&P 500 and DJ Industrial) would force others to halt their upward
course, even if the upturn was initially confirmed by an upside breakout of a
continuation pattern.
2. Theoretically, an upside breakout of a transition period will leave an
accumulation area behind it. Yet, as stated in the section of this paper
devoted to technical environment, this recent period was mainly
characterised by distribution rather than accumulation.
3. Lastly, the upper limit for uptrends is often shown by resistance
areas with the mettle to slow or possibly even halt upcycles. In Europe, all
the indices we track are located inside MT resistance areas that are likely
to mark the end of MT upcycles (measured move ups). These zones will
muster sell trades such that the next rally, despite being bolstered by a
long-run consolidation period, will probably be stopped in its tracks and
flipped over to the downside.
II – Chart configurations
Here is a list of active or potential chart configurations7 at the end of 2009
and beginning of 2010 by index. Attached to the name of each pattern is an
arrow indicating each of their ramifications.
Index Short term Medium term
S&P 500 : Flag : Measured move up ending
DJ Industrial ?: Ascending broadening wedge? : Measured move up ending
DJ Transport : Desc. right-angled broadening formation : Measured move up ending
DJ Utilities : Asc. right-angled broadening formation : Upside breakout of LT trading-range
Nasdaq : Broadening formation Neutral
DJ Stoxx 600 : Diamond : Measured move up ending
Eurostoxx 50 : Diamond : Measured move up ending
Cac 40 : Diamond : Measured move up ending
Nikkei 225 Neutral ?: Head and shoulders?
From a chart-configuration standpoint, we can indicate that the market’s
mood is currently:
1. Bullish short term, as the majority of indices have recently broken
upside of sideways consolidation periods (diamonds in Europe and
assorted broadening formations and flags in the US).
2. Bearish medium term because MT upcycles are terminating on the
vast majority of indices. From this standpoint, a post-cycle correction
seems unavoidable in the near future. The Nikkei 255 seems to be leading
the pack. The secondary reaction has come and gone and the price action
is now tentatively tracing a possible head and shoulders.
7
As always in our nomenclature, potential patterns carry question marks.
This is a non-contractual document; it is strictly for the private use of the recipient, and the information it contains is based on sources we believe to be reliable, but whose accuracy and completeness cannot be
guaranteed. The opinions given in the document reflect our appraisal at the time of publication and may therefore be revised at a later date. Because financial, economic and technical analysis use different methods,
14
conflicting conclusions are possible.
![Technical analysis
Tuesday 5 January 2010
c) Key supports and resistances
Major supports Major resistances
Indices
Long term Medium term Medium term Long term
S&P 500 950 943.8 [1132.6-1219.5] 1150, 1400
DJ Industrial 9000 9026 [10210-10994] 10700, 11670
DJ Transport 2000 [2987-3434] [4287-4734], 4635 5487
DJ Utilities 294.3, 307 360, [324.4-340.8] 422, 460 470
Nasdaq [1261-1350] 2168, [2024-2190] [2430-2550] 2900
DJ Stoxx 600 162.2, 165.8 214.2 [252.7-272.7], 262.5, 290 300
Eurostoxx 50 1847, 2000 2330, 2600 [2978-3272], 3000, 3450 3900
Cac 40 2465, 2581 3400, 3100 [3848-4289], 4002, 4500 5303
Nikkei 225 7000 9000 [11565-11721] 10788, 12000, 14500
d) Approximate idea of prospective highs/lows by timeframe
Themes < 1 month 1-3 months 3-6 months > 6 months
ROUGH IDEAS OR TARGETS?
S&P 500 1168 960 1150 1250
The opposite table aims to DJ Industrial 10700 9100 10500 11500
show approximate values that DJ Transport 4530 3600 4400 5400
can be estimated under our
present scenario. DJ Utilities 417 370 410 458
Nasdaq 2350 2050 2300 2550
Signals (targets are set only
DJ Stoxx 600 265 220 255 285
when a position is
recommended, reversions to Eurostoxx 50 3150 2650 3050 3450
neutral, etc.) are dealt with in Cac 40 4170 3450 4000 4450
our Technical Overview. The
goal of this report is to Nikkei 225 10800 9000 11500 12000
provide ballpark estimates Eurobund 118.1 121.0 116.7 114.8
that will then be fined tuned
via our daily publications. EUR / USD 1.5030 1.4300 1.5000 1.6000
EUR / GBP 0.9200 0.9000 0.9460 0.9790
Commodity Index 513 440 490 530
WTI 86.5 66 82 100
Gold ounce 1100 1100 1185 1295
e) Sector plays and stock picks/avoid recommendations
STANCE SECTOR STOCKS TO AVOID STOCK PICKS
AVOID Chemicals Air Liquide, Akzo Nobel, Bayer,
(Underperformance Casino, Delhaize, BAE Systems, Tha-
Retail Syngenta, Carrefour, Areva, Siemens,
emerging or les, Thyssen, Vallourec
Industrial Goods Suez Environnement
underway)
GIVE PRIORITY Technology Alcatel, Atos, Cap Gemini, Iliad, E.ON,
(Outperformance Utilities Logica, Nokia, SAP, Lagardère, BG EDF, EDF Energies Nouvelles, GDF,
emerging or Medias Group, Technip Veolia, B Sky B, JC Decaux, Pearson,
underway) Oil & Gas TF1, Vivendi, ENI, Royal Dutch, Total
STOCKS TO AVOID STOCK PICKS
Daimler, Crédit-Agricole, Deutsche Bank, BHP-Billiton, Salzgitter, Imerys, Danone, Unilever,
AngloAmerican, Randgold, Adidas, Ubi Soft, Saint- MAN Group, AstraZeneca, Roche, Sanofi, British
Gobain, Nestlé, Julius Baer, L.S.E., Aegon, ING Land, Axa, British Telecom, Deutsche Telekom,
Group, Cable & Wireless Vodafone, Air France
This is a non-contractual document; it is strictly for the private use of the recipient, and the information it contains is based on sources we believe to be reliable, but whose accuracy and completeness cannot be
guaranteed. The opinions given in the document reflect our appraisal at the time of publication and may therefore be revised at a later date. Because financial, economic and technical analysis use different methods,
2
conflicting conclusions are possible.](data:image/gif;base64,R0lGODlhAQABAIAAAAAAAP///yH5BAEAAAAALAAAAAABAAEAAAIBRAA7)