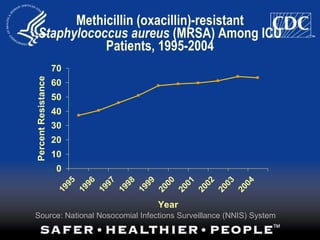
This slide plots historic data from the National Nosocomial Infections Surveillance –or NNIS-system. The prevalenceo – or percent of S. aureus Nosocmial infections caused by methicillin-resistant S. areus is plotted over the past decade. These data are compiled from several of the NNIS reporting components, and in 1995, these data were extrapolated to the U.S. population, estimating that about 207 thousand S. aureus NI occurred annualy in the US—of which 70,000 were MRSA Two additional points should be made regarding these data. First, it is clear that the MRSA prevelance has continued to increase in the ICU setting, passing 50% in 1999. Several new approaches to reducing MRSA among ICU patients have been developed and tested—and you will hear from Others today on these initatives. Second, as fewer hospitals reported sufficient data in the non-ICU areas in the past 10 years, making national estimates after 2000 became unreliable. Therefore, last year we partnered with NCHS to make national estimates using alternative data sources…….
This slide plots historic data from the National Nosocomial Infections Surveillance –or NNIS-system. The prevalenceo – or percent of S. aureus Nosocmial infections caused by methicillin-resistant S. areus is plotted over the past decade. These data are compiled from several of the NNIS reporting components, and in 1995, these data were extrapolated to the U.S. population, estimating that about 207 thousand S. aureus NI occurred annualy in the US—of which 70,000 were MRSA Two additional points should be made regarding these data. First, it is clear that the MRSA prevelance has continued to increase in the ICU setting, passing 50% in 1999. Several new approaches to reducing MRSA among ICU patients have been developed and tested—and you will hear from Others today on these initatives. Second, as fewer hospitals reported sufficient data in the non-ICU areas in the past 10 years, making national estimates after 2000 became unreliable. Therefore, last year we partnered with NCHS to make national estimates using alternative data sources…….
This slide plots historic data from the National Nosocomial Infections Surveillance –or NNIS-system. The prevalenceo – or percent of S. aureus Nosocmial infections caused by methicillin-resistant S. areus is plotted over the past decade. These data are compiled from several of the NNIS reporting components, and in 1995, these data were extrapolated to the U.S. population, estimating that about 207 thousand S. aureus NI occurred annualy in the US—of which 70,000 were MRSA Two additional points should be made regarding these data. First, it is clear that the MRSA prevelance has continued to increase in the ICU setting, passing 50% in 1999. Several new approaches to reducing MRSA among ICU patients have been developed and tested—and you will hear from Others today on these initatives. Second, as fewer hospitals reported sufficient data in the non-ICU areas in the past 10 years, making national estimates after 2000 became unreliable. Therefore, last year we partnered with NCHS to make national estimates using alternative data sources…….
This slide plots historic data from the National Nosocomial Infections Surveillance –or NNIS-system. The prevalenceo – or percent of S. aureus Nosocmial infections caused by methicillin-resistant S. areus is plotted over the past decade. These data are compiled from several of the NNIS reporting components, and in 1995, these data were extrapolated to the U.S. population, estimating that about 207 thousand S. aureus NI occurred annualy in the US—of which 70,000 were MRSA Two additional points should be made regarding these data. First, it is clear that the MRSA prevelance has continued to increase in the ICU setting, passing 50% in 1999. Several new approaches to reducing MRSA among ICU patients have been developed and tested—and you will hear from Others today on these initatives. Second, as fewer hospitals reported sufficient data in the non-ICU areas in the past 10 years, making national estimates after 2000 became unreliable. Therefore, last year we partnered with NCHS to make national estimates using alternative data sources…….