SlideShare une entreprise Scribd logo
1  sur  12
Télécharger pour lire hors ligne
U.S. Department of Justice
Office of Justice Programs


   Bureau of Justice Statistics
   Bulletin
                                                                                                                     December 2008, NCJ 224390

National Crime Victimization Survey

Criminal Victimization, 2007
                        Michael R. Rand                             Table 1. Criminal victimization, numbers, rates, and percent
                        BJS Statistician                            change, by type of crime, 2005 and 2007
In 2007 U.S. residents experienced an estimated 23                                                                                         Percent
                                                                                             Number of victimizations       Ratesa         change
million violent and property victimizations, according to           Type of crime              2005b        2007          2005b   2007     2005-2007c
the National Crime Victimization Survey (NCVS). Crim-
                                                                      All crimes          23,452,100 22,879,700              ~        ~
inal victimizations in 2007 included approximately 5.2
                                                                    Violent crimesd        5,162,400 5,177,100            21.1     20.7      -1.9%
million violent crimes and 17.5 million property crimes.              Rape/sexual assault    190,600    248,300            0.8      1.0      25.0
The rates for every major violent and property crime                  Robbery                630,100    597,300            2.6      2.4      -7.7
measured by the NCVS in 2007 were at or near the                      Assault              4,341,600 4,331,500            17.8     17.3      -2.8
lowest levels recorded since 1973, the first year that                    Aggravated       1,046,500    858,900            4.3      3.4     -20.9*
                                                                          Simple           3,295,200 3,472,600            13.5     13.9       3.0
such data were available.1
                                                                    Personal thefte             229,500      194,100        0.9      0.8    -11.1%
The overall victimization rate in 2007 for violent crimes
was 20.7 per 1,000 persons, which was not signifi-                  Property crimes          18,060,200 17,508,500       154.2    146.5         -5.0%**
                                                                      Household burglary      3,464,500 3,215,100         29.6     26.9         -9.1**
cantly different from the 2005 rate of 21.1 per 1,000
                                                                      Motor vehicle theft       981,900    979,600         8.4      8.2         -2.4
persons (table 1). For property crimes, the overall rate              Theft                  13,613,800 13,313,800       116.3    111.4         -4.2
of 146.5 per 1,000 households in 2007 was somewhat                   Note: Detail may not add to total because of rounding. Total population age 12 or
lower than the rate of 154.2 per 1,000 households in                 older was 244,505,300 in 2005 and 250,344,870 in 2007. Total number of house-
2005. As in previous years, about half of the violent                holds was 117,099,820 in 2005 and 119,503,530 in 2007. Estimates for 2006
                                                                     were not presented because they are not comparable to other years.
crimes and almost two-thirds of the property crimes
                                                                     ~Not applicable.
measured by the NCVS in 2007 were not reported to                    *Difference is significant at the 95%-confidence level.
police.                                                              **Difference is significant at the 90%-confidence level.
                                                                     aEstimates for 2005 have been updated and do not match those presented in
NCVS is an annual data collection conducted by the                   previous editions of this bulletin.
U.S. Census Bureau for the Bureau of Justice Statistics              b
                                                                       Victimization rates are per 1,000 persons age 12 or older or per 1,000
(BJS). This report provides the initial release of data for          households.
2007 from the NCVS.                                                  c
                                                                       Percent change calculated based on unrounded estimates.
                                                                     d
                                                                      Excludes murder because the NCVS is based on interviews with victims and
This bulletin describes the substantial fluctuations in              therefore cannot measure murder.
the survey measure of crime from 2005 through 2007.                  e
                                                                      Includes pocket picking, completed purse snatching, and attempted purse
As discussed in the Technical Notes, these changes do                snatching.
not appear to be due to changes in the rate of criminal
activity during this period. Evaluation of the NCVS esti-
mates suggest that changes in the sample design and                 Changes to the NCVS and their impact upon the survey’s estimates in 2006 are
implementation of the survey account for the fluctua-               discussed in the Criminal Victimization, 2006 Technical Notes. The bulletin and
                                                                    technical notes are available online at: <http://www.ojp.usdoj.gov/bjs/pub/pdf/
tions in crime rates measured from 2005 to 2006 and                 cv06.pdf>.
from 2006 to 2007.
1
  The discussion of victimization rate trends excludes NCVS esti-
mates for 2006 because of the methodological inconsistencies
between the data for that year and the data for other years.
BJS continues to work with the U.S. Census Bureau to bet-                   NCVS collects information from victims of nonfatal
ter understand the impact of these changes upon survey                      violent crimes and property crimes
estimates. Once the research is complete, BJS will publish
                                                                            The NCVS collects information on nonfatal crimes,
a technical report to describe the findings. If adjustments to
                                                                            reported and not reported to the police, against persons
the reported crime rates for 2006 and 2007 are warranted,
                                                                            age 12 or older from a nationally representative sample of
or if other changes to the data are identified, BJS will issue
                                                                            U.S. households. It produces national rates and levels of
a revised report to provide users with a more comparable
                                                                            personal and property victimization. Information on homi-
set of figures. Based on research completed to date, there
                                                                            cide presented in this report was obtained from the Uniform
is a high degree of confidence that survey estimates for
                                                                            Crime Reporting (UCR) program of the Federal Bureau of
2007 are consistent with and comparable to those for 2005
                                                                            Investigation (FBI).
and previous years.
                                                                            Violent crimes measured by the NCVS include rape, sexual
While the estimates for 2007 are close to the levels for
                                                                            assault, robbery, aggravated assault, and simple assault.
2005, they are substantially below the levels for 2006.
                                                                            Property crimes include household burglary, motor vehicle
Changes in 2006 included the introduction of a new sample
                                                                            theft, and theft. The survey also measures personal theft,
based on the 2000 decennial census, a transition from
                                                                            which includes pocket picking and purse snatching.
paper-and-pencil interviewing (PAPI) to computer-assisted
interviewing (CAPI), and the use of first-time interviews in                In 2007, 41,500 households and 73,600 individuals age 12
the new sample areas in the production of survey esti-                      or older were interviewed for the NCVS. Each household
mates.                                                                      was interviewed twice during the year. The response rate
                                                                            was 90.3% of households and 86.2% of eligible individuals.
In 2007, three additional changes were made largely for
budgetary reasons to the NCVS program:
                                                                            Violent and property victimization rates remain at
    • The sample was reduced by 14% in July 2007.                           historic lows in 2007

    • First-time interviews from all sample areas were used in              The 2007 violent crime rate was 43% lower than in 1998
      the production of 2007 estimates.                                     due to a decline in crime between 1998 and 2002 (figure 1).
                                                                            This rate has remained generally stable since 2003. Rates
    • Computer-assisted interviews from centralized tele-                   for robbery and simple assault followed similar patterns
      phone centers were discontinued in July 2007.                         across the 10-year period. The crime rate for rape declined
                                                                            marginally between 1998 and 2007. For aggravated
Analyses of the 2007 estimates indicate that the program                    assault, the crime rate fell during both five-year periods,
changes made in 2007 had relatively small effects on                        between 1998 and 2002 and between 2003 and 2007.
NCVS estimates. As discussed in Criminal Victimization,
2006, the substantial increases in victimization rates from
                                                                            Overall rate of violent crime fell by 43% from 1998 to 2007
2005 to 2006 do not appear to be due to actual changes in
crime during that period. The increases were attributed to                     Victimization rate per 1,000 persons age 12 or older
the impact of the methodological changes in the survey.2                       40
                                                                               35
These effects were reversed in 2007, suggesting that the
2006 findings represent a temporary anomaly in the data.                       30
                                                                                                       Total violent crime
The methodological changes implemented in 2007, their                          25
impact on the survey estimates, and the NCVS method-                           20                                                3
                                                                                                      Simple assault
ological research program are described more fully in the                      15                                                3
Technical Notes on page 7.
                                                                               10
2
                                                                                                    Aggravated assault
 Users are encouraged to focus on the comparison between 2005 and                5                                               3
2007 victimization rates until the changes to the NCVS in 2006 are better                                                        3 Robbery
                                                                                                                                 3 Rape
                                                                                 0
understood.
                                                                                 1998    2000      2002      2004      2006 2007
                                                                                 3Represents 2007. Data for 2006 are not included.

                                                                            Figure 1


2 Criminal Victimization, 2007
From 1998 to 2007, the rate of overall property crime fell by          Property crime rates overall fell by 33% from 1998 to 2007
33% (figure 2). The property crime rate has had a long-
                                                                                   Property crime rate per 1,000 households
term declining trend for most of the survey’s 36-year his-                         250
tory.
                                                                                   200
The overall rates for property crime and theft fell in both the                                        Total property crime
                                                                                                                                  3
first and second half of the 10-year period, with a greater                        150
                                                                                                       Theft
decline from 1998 to 2002 than from 2003 to 2007. The                                                                             3
burglary rate fell from 1998 to 2002 and also declined                             100
slightly from 2003 to 2007. For motor vehicle theft, the rate
                                                                                    50                 Burglary
declined from 1998 to 2002 and has remained stable since                                                                          3
                                                                                                       Motor vehicle theft
2003 (table 2).                                                                      0                                            3
                                                                                     1998      2000     2002       2004       2006 2007
Victimization rates in 2007 were near the levels                                    3Represents 2007. Data for 2006 are not included.
experienced in 2005                                                    Figure 2
The overall violent crime rate in 2007 was not statistically           Table 2. Rates of criminal victimization and percent change,
different from the rate in 2005. In comparison, the 2007               by type of crime, 1998 and 2007
property crime rate was marginally lower than the rate in
2005. Of the violent crimes measured by the NCVS, aggra-                                               Victimization rates (per 1,000 persons age
                                                                                                       12 or older or per 1,000 households)
vated assault was the only crime with a significantly lower
                                                                                                                                 Percent changea
rate in 2007 than in 2005. The rate of victimization for over-         Type of crime                       1998        2007      1998-2007
all property crime and household burglary were somewhat                Violent crimesb                    36.6             20.7       -43.4%*
lower in 2007, compared to 2005.                                         Rape/sexual assault               1.5              1.0       -33.3*
                                                                         Robbery                           4.0              2.4       -40.0*
Comparisons are made between the rates for 2005 and                      Assault                          31.1             17.3       -44.4*
2007 because 2006 was an anomalous year due to the                         Aggravated                      7.5              3.4       -54.7*
impact of the methodological changes introduced to the                     Simple                         23.5             13.9       -40.9*
survey. A new sample introduced in 2006 affected the                   Personal theftc                      1.3             0.8       -38.5%*
NCVS estimates in new areas, especially in non-urban                   Property crimes                   217.4         146.5          -32.6%*
areas. The new sample required hiring and training a large               Household burglary               38.5          26.9          -30.1*
number of new interviewers in the new areas. The variation               Motor vehicle theft              10.8           8.2          -24.1*
in the amount and rates of crime was too extreme to be                   Theft                           168.1         111.4          -33.7*
attributed to actual year-to-year changes. These effects                Note: In 1998 the total population age 12 or older was 221,880,960 and
were reversed in 2007, suggesting that the 2006 findings                250,344,870 in 2007. The total number of households in 1998 was
                                                                        105,322,920 and 119,503,530 in 2007.
represent a temporary anomaly in the data (table 3). See                *Difference is significant at the 95%-confidence level.
Technical Notes on page 7.                                              a
                                                                         Differences between the annual rates shown do not take into account
                                                                        changes that may have occurred during interim years.
                                                                        bExcludes  murder because the NCVS is based on interviews with
                                                                        victims and therefore cannot measure murder.
                                                                        c
                                                                          Includes pocket picking, completed purse snatching, and attempted
                                                                        purse snatching.


  Table 3. National crime victimization rates and percent change in rates, by type of crime, 2005-2007

                                          Rates per 1,000 persons or households             Percent change Percent change Percent change
  Type of crime                            2005            2006           2007              2005-2006      2006-2007      2005-2007
  Violent crime                             21.1           24.7             20.7               17.1%              -16.2%            -1.9%
    Rape/sexual assault                      0.8            1.1              1.0               37.5                -9.1             25.0
    Robbery                                  2.6            2.9              2.4               11.5               -17.2             -7.7
    Assault                                 17.8           20.7             17.3               16.3               -16.4             -2.8
      Aggravated                             4.3            5.4              3.4               25.6               -37.0            -20.9
      Simple                                13.5           15.3             13.9               13.3                -9.2              3.0
  Personal larceny without contact           0.9            0.7              0.8              -22.2%              14.3%            -11.1%
  Property crime                           154.2          160.5         146.5                   4.1%               -8.7%              -5.0%
    Burglary                                29.6           30.2          26.9                   2.0               -10.9               -9.1
    Motor vehicle theft                      8.4            8.4           8.2                   0.0                -2.4               -2.4
    Theft                                  116.3          121.9         111.4                   4.8                -8.6               -4.2
  Populations
    Persons age 12 or older          244,505,300   247,233,100    250,344,900
    Households headed by persons
     age 12 or older                 117,099,800   117,858,400    119,503,500

                                                                                                                   Criminal Victimization, 2007 3
Characteristics of victims of violent crimes in 2007                              Since 2003, survey respondents have been able to report
were similar to previous years                                                    more than one racial identity. In 2007, persons of two or
                                                                                  more races were victims of violence at higher rates than
As in previous years, males, blacks, and persons age 24 or
                                                                                  blacks, whites, and persons of other races.
younger in 2007 continued to experience violent crime vic-
timizations at higher or somewhat higher rates than
                                                                                  Hispanic origin of victim
females, whites, and persons age 25 or older (table 4).
                                                                                  In 2007, there were no significant differences in the rates of
Gender of victims                                                                 victimization for overall violent crime and aggravated
                                                                                  assault between Hispanics and non-Hispanics. Hispanics
Overall, males were victims of violent crime, robbery, and
                                                                                  were more likely than non-Hispanics to be victims of rob-
aggravated and simple assault at rates higher than
                                                                                  bery. Non-Hispanics had a somewhat higher rate of simple
females. Females were more likely than males to be vic-
                                                                                  assault compared to Hispanics.
tims of rape or sexual assault. Differences between male
and female victims of simple assault were not statistically
                                                                                  Age of victim
significant.
                                                                                  As in previous years, a general pattern of decreasing crime
Race of victim                                                                    rates was observed in 2007 for persons in older age
                                                                                  groups. For victims of violent crimes, persons age 12 to 15
Blacks were more likely than whites to be victims of rob-
                                                                                  and age 16 to 19 were victimized at a significantly higher
bery, and somewhat more likely than whites to be victims of
                                                                                  rate than persons in all other groups age 25 or older. Per-
overall violence. Blacks were also more likely than persons
                                                                                  sons age 16 to 19 also experienced higher violent crime
of other races (American Indian, Alaska Native, Asian,
                                                                                  rates than those age 20 to 24. Persons age 50 and older
Native Hawaiian, and other Pacific Islander) to be victims of
                                                                                  were victims of violent crime at lower rates than persons in
overall violence, robbery, and aggravated and simple
                                                                                  younger age groups.
assault.

Table 4. Rates of violent crime and personal theft, by gender, race, Hispanic origin, and age, 2007

                                                                                 Victimizations per 1,000 persons age 12 or older
                                                                                            Violent crimes
                                                                                                               Assault
Demographic characteristic of victim       Population       All    Rape/sexual assault Robbery        Total   Aggravated Simple       Personal thefta
Gender
  Male                                   122,122,700       22.5            0.1^              3.4        19.1         4.5     14.5           0.9
  Female                                 128,222,170       18.9            1.8               1.4        15.6         2.4     13.2           0.7
Race
  White                                  203,470,370       19.9            1.0              1.9         17.0         3.2     13.9           0.6
  Black                                   30,385,460       24.3            0.5^             4.9         18.8         4.4     14.4           1.9
  Other raceb                             13,340,930       11.4            1.2^             1.8^         8.3         2.7      5.7           1.1^
  Two or more races                        3,148,100       73.8            5.5^            10.8         57.5        13.3     44.2           0.6^
Hispanic origin
   Hispanic                               34,423,520       18.6            0.3^              3.9        14.5         3.0     11.4           1.0^
   Non-Hispanic                          215,499,060       21.0            1.1               2.2        17.8         3.5     14.3           0.7
Age
  12-15                                   16,755,440       43.4            1.0^              4.2        38.2         2.8     35.5           0.8
  16-19                                   16,981,750       50.1            2.4               6.4        41.4         7.2     34.2           1.6^
  20-24                                   20,752,030       35.2            2.9               3.5        28.7         7.5     21.2           1.1^
  25-34                                   40,349,730       24.7            1.2               3.4        20.1         4.8     15.3           1.1
  35-49                                   65,636,410       17.7            1.0               1.4        15.3         3.2     12.1           0.6
  50-64                                   53,677,460       11.6            0.3^              1.7         9.5         2.3      7.2           0.3^
  65 or older                             36,192,050        2.5            0.1^              0.6^        1.8         0.3^     1.5           0.8^
 Note: The National Crime Victimization Survey includes as violent crime rape, sexual assault, robbery, aggravated assault, and simple assault.
 Because the NCVS interviews persons about their victimizations, murder and manslaughter cannot be included.
 ^Based upon 10 or fewer sample cases.
 a
     Includes pocket picking, completed purse snatching, and attempted purse snatching.
 b
     Other race includes American Indians, Alaska Natives, Asians, Native Hawaiians, and other Pacific Islanders.


4 Criminal Victimization, 2007
Rates for property crimes were higher in lower income                    Federal Bureau of Investigation, Uniform Crime
households and large households                                          Reports, 2005-2007
Rates of overall property crime were higher for lower                    Violent crime as measured by the FBI through the
income households compared to higher income house-                       Uniform Crime Reports (UCR) includes murder and
holds. Households earning less than $7,500 per year were                 non-negligent manslaughter, forcible rape, robbery,
victims of property crime at a rate that was about 1.5 times             and aggravated assault. Property crime includes
higher than households earning $75,000 per year or more.                 burglary, larceny-theft, and motor vehicle theft. UCR
Households earning less than $15,000 per year had higher                 measures crimes reported to the police, including
property crime rates than households in all other income                 commercial crimes.
categories (table 5).
                                                                         The violent crime rate as measured by the UCR
Patterns in the rates of household burglary and property                 increased by 1% between 2005 and 2006 from 469
theft were similar to that of overall property crime. House-             per 100,000 persons to about 474.
holds in the two lowest income categories—less than
$7,500 per year and $7,500 to $14,999 per year—were vic-                • Between 2006 and 2007, the violent crime rate declined
tims of burglary and theft at higher or marginally higher                 by 1.4% from about 474 per 100,000 persons to about
rates than households in all other income categories. For                 467.
motor vehicle theft, there was no significant difference in
the crime rate across most income categories.                           • In 2007, the FBI reported 16,929 murders and non-
                                                                          negligent manslaughters.
Property crime rates overall were higher for persons living
in larger households than for those living in smaller house-            • Between 2006 and 2007, the homicide rate declined by
holds. Households with six or more persons were about 2.6                 about 1%, from 5.7 per 100,000 persons to 5.6.
times more likely to be victims of property crime than single
person households. For property theft and motor vehicle                 • The property crime rate declined by 2.8% between 2005
theft, patterns across households of different sizes were                 and 2006, from 3,432 per 100,000 persons to 3,335.
similar to that of overall property crime. For household bur-
glary, the rate for households with six or more persons was             • Between 2006 and 2007, the property crime rate
higher than that for households in most other income cate-                declined by 2.1%, from 3,335 per 100,000 persons to
gories.                                                                   3,264.


 Table 5. Property crime rates, by household income and household size, 2007

                                                       Victimizations per 1,000 households
 Characteristics of household   Number of households    Total        Burglary     Motor vehicle theft   Theft
 Household income
   Less than $7,500                  4,381,010          213.1          57.6            11.1             144.4
   $7,500-$14,999                    6,757,910          201.3          51.2            10.8             139.4
   $15,000-$24,999                   9,552,980          167.0          33.5            11.0             122.4
   $25,000-$34,999                  10,084,590          154.6          25.2             9.5             119.8
   $35,000-$49,999                  13,292,780          151.2          28.3             7.6             115.2
   $50,000-$74,999                  14,932,280          144.3          21.8             7.9             114.6
   $75,000 or more                  22,886,490          146.3          17.2             7.1             122.0

 Size of household
   One person                       33,322,630          105.7          26.2             5.4              74.0
   Two or three persons             59,490,690          137.7          25.4             8.2             104.2
   Four or five persons             23,021,800          207.5          29.6            11.2             166.7
   Six or more persons               3,668,420          277.5          40.7            15.1             221.7


                                                                                                           Criminal Victimization, 2007 5
The general character of violent crime was unchanged                     In 2007, 1% of rape or sexual assaults, 5% of assaults, and
in 2007                                                                  25% of robberies were committed by an offender with a
                                                                         firearm.
Historically, females have been most often victimized by
someone they knew, while half or more of the crimes                      Between 1998 and 2007, the overall rate of firearm vio-
against males have been committed by strangers. Those                    lence declined from 3.0 to 1.6 victimizations per 1,000 per-
general patterns continued in 2007.                                      sons age 12 or older. In 2007, firearms were used in 7% of
                                                                         all violent crime incidents. Over the 10-year period, about
In 2007, males were equally likely to be victimized overall
                                                                         7% to 9% of all violent crimes were committed by offenders
by a stranger or a nonstranger (table 6). Male victims of
                                                                         using firearms (not shown in table).
robbery and aggravated assault were more likely to be vic-
timized by strangers. For simple assault, male victims were              Firearm                                        1998       2007
more likely to have been victimized by someone they knew.                   Incidents                                557,200     348,910
                                                                            Victimizations                           670,500     394,580
Females who were victims of violence were more likely to
                                                                         Firearm crime
be victimized by a nonstranger than by a stranger for all
                                                                            Rate per 1,000 persons age 12 or older       3.0           1.6
measured violent crimes, except robbery. Equal percent-
                                                                            Percent of all violent incidents             7.5%          7.1%
ages of women reported that they were victims of robberies
by strangers and nonstrangers (48%).
                                                                         Nearly half of all violent victimizations were reported to
About 623,000 violent crimes—554,000 against female vic-                 the police in 2007
tims and 69,000 against male victims—were committed by
                                                                         During 2007, 46% of all violent victimizations and 37% of
an intimate partner in 2007. The percentage of female vic-
                                                                         all property crimes were reported to the police. The per-
tims (23%) of intimate partner violence was nearly 8 times
                                                                         centage of robberies (66%) reported to the police was
that of male victims (3%).
                                                                         higher than the percentage of rape or sexual assaults
An estimated 20% of all violent crime incidents were com-                (42%) and simple assaults (41%).
mitted by an armed offender (table 7). As in previous years,
the presence of a firearm was related to the type of crime.

Table 6. Victim and offender relationship, 2007

                               Violent crime       Rape/sexual assault      Robbery            Aggravated assault       Simple assault
Relationship to victim       Number     Percent    Number    Percent     Number Percent        Number    Percent      Number    Percent

Male victims
   Total                     2,752,030   100%         11,300    100%      411,450    100%        555,010    100%     1,774,290 100%
 Nonstranger                 1,264,850    46%          6,600     58%^      89,180     22%        227,870     41%       941,200  53%
   Intimate                     69,100     3               0      0^        5,960      1^         16,000      3^        47,140   3
   Other relative              104,810     4               0      0^        5,710      1^         24,120      4^        74,980   4
   Friend/acquaintance       1,090,940    40           6,600     58^       77,510     19         187,760     34        819,080  46

  Stranger                   1,380,230    50%          4,690    42%^      302,520      74%       303,530     55%       769,480   43%

  Relationship unknown        106,960      4%              0     0%^       19,740       5%^       23,610       4%^      63,610   4%

Female victims
   Total                     2,425,100   100%       236,980     100%      185,880    100%        303,930    100%     1,698,310 100%
  Nonstranger                1,677,000    69%       150,830      64%       89,690     48%        186,670     61%     1,249,810  74%
   Intimate                    554,260    23         55,110      23        37,310     20          69,010     23        392,830  23
   Other relative              192,250     8          6,530       3^       14,470      8^         27,340      9^       143,920   9
   Friend/acquaintance         930,480    38         89,190      38        37,910     20          90,320     30        713,060  42

  Stranger                    689,780     28%         72,780    31%        89,760      48%       108,690     36%       418,550   25%

  Relationship unknown          58,330     2%         13,370     6%^        6,430       4%^         8,570      3%^      29,960   2%^
 Note: Percentages may not total to 100% because of rounding.
 ^Based on 10 or fewer sample cases.


6 Criminal Victimization, 2007
Table 7. Presence of weapons in violent incidents, 2007
 Presence of                   Violent crime             Rape/sexual assault                   Robbery            Simple and aggravated assault
 offender's weapon           Number     Percent         Number       Percent               Number    Percent        Number         Percent

    Total                    4,892,000    100%          248,280        100%                566,270      100%         4,077,450       100%

 No weapon                   3,510,330      72%         226,410            91%             230,910       41%         3,053,000        75%

 Weapon                       996,980       20%          13,980^           6%^             265,900       47%           717,100        18%
  Firearm                     348,910        7            2,830^           1^              144,200       25            201,880         5
  Knife                       276,150        6            6,280^           3^               66,670       12            203,190         5
  Other                       319,760        7            4,870^           2^               44,110        8            270,780         7
  Type not ascertained         52,160        1                0^           0^               10,910^       2^            41,250         1

 Don't know                   384,690        8%            7,890^          3%^              69,460       12%           307,350         8%
  Note: Percentage may not total to 100% because of rounding. If the offender was armed with more than one weapon, the crime is classified
  based on the most serious weapon present.
  ^Based upon 10 or fewer sample cases.


Fifty percent of burglaries and 31% of household thefts                          Table 8. Crimes reported to the police, by gender, race, and
were reported to the police. Motor vehicle theft (85%) was                       Hispanic origin, 2007
the property crime most frequently reported to the police.                       Victim gender, race, and      Percent of crime reported to police, 2007
                                                                                 Hispanic origin                    Violent                Property
                               Percent of crime reported to police, 2007
                                                                                   Total                             46.3%                  37.2%
Violent crime                                   46.3%
  Rape/sexual assault                           41.6                             Male                                45.4%                  38.2%
  Robbery                                       65.6                              White                              46.5                   38.1
  Aggravated assault                            57.2                              Black                              43.6                   36.6
  Simple assault                                40.6                              Other*                             53.0                   45.0

                                                                                   Hispanic                          46.0%                  35.7%
Property crime                                  37.2%
                                                                                   Non-Hispanic                      45.4                   38.6
  Burglary                                      50.1
  Motor vehicle theft                           85.3                             Female                              47.3%                  36.2%
  Theft                                         30.6                               White                             45.1                   36.3
                                                                                   Black                             60.2                   38.5
                                                                                   Other*                            35.3                   26.7
Violent crimes against males (45%) and females (47%)
were equally likely to be reported to the police in 2007. The                      Hispanic                          49.8%                  35.2%
same was true for property crimes for households headed                            Non-Hispanic                      46.9                   36.5
by males and those headed by females (table 8).                                   Note: Total includes estimates for persons identifying with two or more
                                                                                  races, not shown separately. Racial categories displayed are for persons
Rates of reporting did not differ for males in different racial                   who identified with one race.
                                                                                  *Other race includes American Indians, Alaska Natives, Asians, Native
groups. Violent crimes against black females were more                            Hawaiians, and other Pacific Islanders.
likely to be reported to the police than such crimes against
white females or females of other races. For both males
and females, there were no differences among Hispanics                            • In July 2007, computer assisted telephone interviews
and non-Hispanics in the likelihood of reporting violent                            (CATI) from centralized interviewing centers were dis-
crime to police.                                                                    continued, and all interviewing was conducted by field
                                                                                    interviewers using computer-assisted personal inter-
Technical Notes                                                                     viewing (CAPI).
                                                                                 The U.S. Census Bureau undertook a number of analyses
Changes implemented in the NCVS in 2007 had minor                                to determine the impact of the changes to the NCVS in
impacts on estimates                                                             2007. Initial reviews of processes and workload data
Three changes were made to the NCVS for budgetary rea-                           uncovered no factors that would explain the overall year-to-
sons in 2007:                                                                    year differences between the victimization rates for 2006
                                                                                 and 2007.
 • The sample was reduced by 14% beginning July 2007.
                                                                                 Further analyses concentrated on three areas: the NCVS
 • To offset the impact of reducing the sample, first-time                       sample reduction implemented in July 2007, the bounding
   interviews (or bounding interviews) were used in the pro-                     adjustment, and the elimination of CATI interviews in July
   duction of 2007 NCVS estimates. Adjustment factors                            2007.
   were applied to the first-time interviews to counteract the
   effect of including unbounded interviews.


                                                                                                                      Criminal Victimization, 2007 7
Victimization estimates in 2007 were relatively                     upward bias in the NCVS estimates in 2007. The adjust-
unaffected by the 14% sample reduction                              ment process was similar to the one used in 2006 to elimi-
                                                                    nate the impact of using first-time interviews in the incom-
The U.S. Census Bureau evaluated whether victimization
                                                                    ing sample associated with the sample redesign.
rates for cases dropped from the NCVS sample in July
were similar to cases that remained in the sample. Victim-          Analyses of the 2007 estimates demonstrate that the
ization rates from January to June 2007 were calculated for         bounding adjustment effectively countered the impact of
cases removed from the sample and for those that                    including unbounded interviews (table 9). Estimates
remained in sample.                                                 adjusted for the bounding or first-time interviews were virtu-
                                                                    ally identical to the estimates produced using the second
The analysis determined that the sample reduction cases
                                                                    through seventh interviews.
had nominally higher personal and property crime rates
than those that remained in the sample. An overall 14%
                                                                    Changes in the survey mode and sample redesign
sample reduction was not large enough to explain the
                                                                    impacted estimates to a greater extent in 2006 than in
observed changes in victimization rates from 2006 to 2007.
                                                                    2007
                            Rate per 1,000 persons or households,
                            January - June 2007                     The NCVS transitioned from a paper-and-pencil interview
                             Personal crimes    Property crimes     (PAPI) to a computer-assisted interview (CAPI) to become
Cases remaining in sample                                           a fully automated data collection in July 2006. Interviews
 after July 2007                 23.6              151.1            were completed by field representatives either by tele-
Cases removed from sample
 in July 2007                    26.6              166.0
                                                                    phone or in person using questionnaires loaded into laptop
                                                                    computers.
Bounding adjustment effectively compensated for the                 Both before and after the transition, a substantial proportion
impact of unbounded interviews                                      of interviews were conducted using computer-assisted-
                                                                    telephone interviews (CATI) from two U.S. Census Bureau
The NCVS uses a rotating panel design in which house-
                                                                    telephone centers. CATI is a telephone survey technique in
holds remain in sample for three years. All residents age 12
                                                                    which the interviewer follows a script provided by a soft-
or older are interviewed at 6-month intervals for a total of
                                                                    ware application. From 2004 through 2006, the percentage
seven interviews. As discussed more fully in the Criminal
                                                                    of sample cases interviewed using CATI declined from
Victimization, 2006, Technical Notes, this panel design pro-
                                                                    about 30% to 15% of all interviews.
duces a time-in-sample effect on survey estimates.
                                                                    Cases assigned to be interviewed by CATI were not ran-
Respondents tend to report more victimizations during first-
                                                                    dom assignments. They were generally selected from pri-
time interviews than in subsequent interviews. In part, this
                                                                    mary sampling units (PSUs) with large numbers of sample
is because respondents new to the survey tend to recall
                                                                    cases. Cases assigned to CATI were considered easier to
events as having taken place at a time that was more
                                                                    enumerate and were usually in urban and suburban areas.
recent than when they actually occurred.
                                                                    If a case could not be completed in CATI, it was returned to
To offset this bias, a bounding procedure in which first-time       a field representative to attempt to complete the interview.
interviews are not included in the production of estimates
has traditionally been used for the NCVS (i.e., seven inter-
view rotations minus the bounding interview). Prior to 2006,         Table 9. Type of crime, with bounding adjustment
victimizations reported during first-time interviews were            and without first interview, 2007
used only to bound future interviews.                                                        Rate per 1,000 persons or households
                                                                                             With bounding       Without first
In July 2007, interviews with first-time households were             Type of crime           adjustment          interview
used in the production of survey estimates to offset the
impact of the 14% sample reduction. During the year, one-            Violent crime                    20.7            20.5
                                                                       Rape/sexual assault             1.0             1.0
seventh of all sampled households were interviewed each                Robbery                         2.4             2.3
month for the first time. Using first-time interviews to calcu-        Assault                        17.3            17.2
late victimization estimates helped to ensure that the over-             Aggravated                    3.4             3.5
all sample size would remain consistent with previous                    Simple                       13.9            13.8
years.                                                               Personal larceny                  0.8             0.7
Without an adjustment for the time-in-sample effects of              Property crime                  146.5           144.9
first-time interviews, including those households would                Burglary                       26.9            26.9
have introduced an upward bias in the survey estimates.                Motor vehicle theft             8.2             8.2
                                                                       Theft                         111.4           109.9
Weighting adjustments were developed to counteract an


8 Criminal Victimization, 2007
In July 2007, CATI as an interview technique was discontin-     Personal crime rates for outgoing sample areas in 2005
ued due to the cost and time involved to transfer cases to      were generally lower than those in areas that continued in
and from the telephone centers. Beginning in the second         sample across the redesign. Incoming or new sample
half of 2007, all NCVS interviewing was conducted using         areas in 2006 generally had higher personal crime rates
CAPI. Analysis by the U.S. Census Bureau indicated that         than continuing areas. Not all differences measured quar-
the transition from PAPI to CAPI affected the 2006 personal     terly—January through March, April through June, July
crime (violent crime and personal theft) rates. Those effects   through September, and October through December—
were reduced in 2007 (figure 3).                                were statistically significant (figure 4).
As standard practice, the U.S. Census Bureau updates its        The transition from PAPI to CAPI as an interview technique
sample areas for ongoing household surveys about mid-           affected the property crime rates in 2006. Those effects
decade. To account for shifts in the population and house-      were reduced in 2007 (figure 5). In 2007, there was little
hold locations that occur over time, a new sample was           evidence that the household crime rates for outgoing or
introduced to the NCVS in 2006. Analysis of personal crime      incoming areas were different than the rates for continuing
rates before and after the sample redesign showed an            areas (figure 6).
extensive effect in 2006 and a reduced effect beginning
April 2007.


Increased rates of victimization for personal crimes were       Transition from PAPI to CAPI in 2006 affected the
observed in 2006 during the transition from PAPI to CAPI        victimization rate reported for property crime
    Crime rate per 1,000 persons                                           Crime rate per 1,000 households
    35                                                                     200
                                            CAPI
    30                                                                                    CATI
                                      Overall                              175
                       CATI                                                                      Overall          CAPI
    25
                                                                           150
    20                                                                                                PAPI
                            PAPI                                           125
    15
                                                                           100
    10
                                                                            75
     5
                                                                            50
     0
                                                                                 1st 2nd 1st 2nd 1st 2nd 1st 2nd
         1st   2nd    1st    2nd    1st    2nd   1st    2nd
                                                                                  2004        2005         2006        2007
            2004         2005           2006         2007
                                                                                  Calendar years shown in 6-month intervals
           Calendar years shown in 6-month intervals
                                                                                  January-June (1st) and July-December (2nd)
           January-June (1st) and July-December (2nd)
                                                                Figure 5
Figure 3

Personal crime rates were generally higher for incoming or      Property crime rates in 2007 were about the same for
new sample areas after CAPI was introduced in July 2006         incoming, continuing, and outgoing sample areas
    Crime rate per 1,000 persons
                                                                       Crime rate per 1,000 households
    35
                                           New                         200
    30                                                                             Continuing        New
                            Overall                                    175
    25
                                                                       150
                                       Continuing
    20                                                                                               Overall
                                                                       125                 Old
                      Old
    15
                                                                       100
    10
                                                                           75
     5
                                                                           50
     0                                                                          1st 2nd 1st 2nd 1st 2nd 1st 2nd
         1st 2nd     1st 2nd      1st 2nd     1st 2nd                             2004      2005        2006       2007
          2004         2005        2006         2007                            Calendar years shown in 6-month intervals
          Calendar years shown in 6-month intervals                             January-June (1st) and July-December (2nd)
          January-June (1st) and July-December (2nd)
Figure 4                                                        Figure 6


                                                                                                       Criminal Victimization, 2007 9
Analysis of the 2006 and 2007 estimates revealed interac-       BJS and the U.S. Census Bureau continue to examine
tions between survey mode and sample type (i.e., old ver-       the impact of methodological changes on survey
sus new versus continuing). When CAPI interviewing was          estimates
introduced in July 2006, interviews conducted in incoming
                                                                Analyses undertaken by BJS and the U.S. Census Bureau
sample areas produced much higher personal crime rates
                                                                established that the year-to-year 2005 to 2006 and 2006 to
than CAPI interviews in continuing areas, an effect attrib-
                                                                2007 NCVS estimates were not comparable as a result of
uted to the impact of new interviewers in the new sample
                                                                the methodological changes introduced to the survey in
areas. This effect appeared to diminish in the second
                                                                2006. The apparent increase in victimization from 2005 to
quarter, April to June 2007. In comparison, no such clear
                                                                2006 has been largely attributed to implementing a new
patterns were evident for property crime rates when
                                                                sample design, training interviewers new to the survey, and
mode—PAPI, CATI, and CAPI—and sample type were
                                                                changing the mode of collecting the data.
examined.
                                                                These changes were most heavily felt in new sample areas
The transition from PAPI to CAPI and the effects of the
                                                                in 2006, which were mainly rural areas. Data collected in
sample redesign resulted in increases in crime rates in
                                                                those areas appeared to coincide with the greatest shifts in
2006 and prevented comparing those NCVS estimates with
                                                                reported crime rates from 2005 to 2006.
earlier years. The effects were primarily in rural areas,
which had a larger percentage than urban and suburban           Urban and suburban areas surveyed in 2006 using both the
areas of incoming or new sample areas and outgoing              old and new sample designs were designated as continu-
areas.                                                          ing areas. Estimates of violent and property crime did not
                                                                change significantly from 2005 to 2006 in those continuing
The observed effects on the 2006 estimates diminished in
                                                                areas. In comparison, violent and property victimization
2007. This decrease was consistent with the explanation
                                                                rates in new areas—areas included in the new sample
that the selection of a new sample requires hiring and train-
                                                                design only—increased greatly, compared to the old areas
ing new interviewers to administer the survey during every
                                                                they replaced.
redesign. Interviewers new to the survey and the training
associated with the redesign resulted in higher victimization   The substantial changes in victimization estimates from
rates being reported.                                           2005 to 2006 and from 2006 to 2007 were too extreme to
                                                                be attributable to actual year-to-year changes. Users
The effects of the sample redesign and changes in the sur-
                                                                should focus on the comparison of the 2005 and 2007 rates
vey administration or mode in 2006 decreased in 2007. The
                                                                until these issues are resolved. It is emphasized that the
NCVS estimates in 2007 are comparable to those in 2005
                                                                impact of the changes is on estimates of the extent and
and earlier years.
                                                                rates of crime, not on the attributes of victims or crime inci-
                                                                dents. Based on research completed to date, the data for
                                                                2007 as presented in this report are comparable with esti-
                                                                mates for 2005 all previous years of the NCVS.


10 Criminal Victimization, 2007
Methodology                                                      personal crimes is the sum of all person weights. The base
                                                                 for the property crime rates is the sum of all household
The National Crime Victimization Survey (NCVS) is an
                                                                 weights. For more detail, see Criminal Victimization in the
annual data collection conducted by the U.S. Census
                                                                 United States, Statistical Tables, Methodology at <http://
Bureau for the Bureau of Justice Statistics (BJS). The
                                                                 www.ojp.usdoj.gov/bjs/abstract/cvusst.htm>.
NCVS collects information on nonfatal crimes, reported and
not reported to the police, against persons age 12 or older      The NCVS sample was reduced by 14% in 2007 based on
from a nationally representative sample of U.S. house-           new budgetary constraints. To offset this reduction begin-
holds. Violent crimes measured by the NCVS include rape          ning with the 2006 NCVS, BJS included the data from the
or sexual assault, robbery, aggravated assault, and simple       first interview in the production of estimates.
assault. Property crimes include household burglary, motor
                                                                 Earlier research conducted during the development of the
vehicle theft, and theft.
                                                                 NCVS found that persons often report crimes that occurred
The survey results in this report are based on data gath-        before the reference period. Prior to 2006, the first of seven
ered from residents living throughout the United States,         interviews was used to bound subsequent interviews and
including persons living in group quarters, such as dormito-     not in the production of NCVS estimates. The second inter-
ries, rooming houses, and religious group dwellings. Armed       view was the first data used in the analysis.
Forces personnel living in military barracks and institutional
                                                                 To reduce costs and leverage more of the data in 2006, and
persons, such as correctional facility inmates, were not
                                                                 to account for the sample reduction in 2007, BJS applied a
included in the scope of this survey.
                                                                 bounding adjustment to the first interview to nullify any
Each housing unit selected for the National Crime Victim-        over-reporting of crime. This allowed BJS to use the sur-
ization Survey (NCVS) remains in the sample for three            vey’s full data collection. Further research showed that the
years, with each of seven interviews taking place at 6-          bounding adjustment had no appreciable effect on the esti-
month intervals. An NCVS field representative’s first con-       mates. This change did not explain the fluctuation in the
tact with a household selected for the survey is in person.      rates observed from 2005 through 2007.
The field representative may conduct subsequent inter-
                                                                 Comparisons of percentages and rates in this report were
views by telephone. To elicit more accurate reporting of
                                                                 tested to determine if observed differences were statisti-
incidents, the NCVS uses a self-respondent method that
                                                                 cally significant. Differences described as higher, lower, or
requires a direct interview with each person 12 years or
                                                                 different passed a test at the 0.05 level of statistical signifi-
older in the household.
                                                                 cance (95%-confidence level). Differences described as
Annual collection year estimates of the levels and rates of      somewhat, slightly, marginally, or some indication passed a
victimization are derived by accumulating estimates quar-        test at the 0.10 level of statistical significance (90%-confi-
terly. The weights of all crimes reported during the inter-      dence level). Caution is required when comparing esti-
views in that year are summed, regardless of when the            mates not explicitly discussed in this bulletin.
crime occurred. The base for the collection year rate for


                                                                                                 Criminal Victimization, 2007 11
U.S. Department of Justice                           *NCJ~224390*                                 PRESORTED STANDARD
                                                                                                   POSTAGE & FEES PAID
Office of Justice Programs                                                                               DOJ/BJS
Bureau of Justice Statistics                                                                          Permit No. G-91


Washington, DC 20531


Official Business
Penalty for Private Use $300


   This report in portable document format and in      The Bureau of Justice Statistics is the statistical agency
   ASCII and its related statistical data are          of the U.S. Department of Justice. Michael D. Sinclair is
   available at the BJS World Wide Web Internet        deputy director.
   site: <http://www. ojp.usdoj.gov/bjs/abstract/
                                                       BJS Bulletins present the first release of findings from
   cv07.htm>
                                                       permanent data collection programs.
                                                       This Bulletin was written by Michael R. Rand.
                                                       Patsy A. Klaus and Cathy T. Maston verified the report.
   Office of Justice Programs
                                                       Georgette Walsh edited the report. Tina Dorsey
   Innovation • Partnerships • Safer Neighborhoods     produced the report and Jayne Robinson prepared
   http://www.ojp.usdoj.gov                            the report for final printing under the supervision of
                                                       Doris J. James.
                                                       December 2008, NCJ 224390


12 Criminal Victimization, 2007

Contenu connexe

Plus de guestc74c5d0

Vincular Pp Ss A La Informalidad En Mexico
Vincular Pp Ss A La Informalidad En MexicoVincular Pp Ss A La Informalidad En Mexico
Vincular Pp Ss A La Informalidad En Mexicoguestc74c5d0
 
Sociologia Juaridica
Sociologia JuaridicaSociologia Juaridica
Sociologia Juaridicaguestc74c5d0
 
Sociologia Del Derecho
Sociologia Del DerechoSociologia Del Derecho
Sociologia Del Derechoguestc74c5d0
 
Poblacion Alvaro Obregon
Poblacion Alvaro ObregonPoblacion Alvaro Obregon
Poblacion Alvaro Obregonguestc74c5d0
 
Programa Poblacion Df 2001 2006
Programa Poblacion Df 2001 2006Programa Poblacion Df 2001 2006
Programa Poblacion Df 2001 2006guestc74c5d0
 
Plan Nacional De Poblacion 2008 2012
Plan Nacional De Poblacion 2008 2012Plan Nacional De Poblacion 2008 2012
Plan Nacional De Poblacion 2008 2012guestc74c5d0
 
Presentacion Maltrato Infantil
Presentacion Maltrato InfantilPresentacion Maltrato Infantil
Presentacion Maltrato Infantilguestc74c5d0
 
Ncvs Incident Report Questionnaire
Ncvs Incident Report QuestionnaireNcvs Incident Report Questionnaire
Ncvs Incident Report Questionnaireguestc74c5d0
 
Perfiles De Los IndíGenas En Ciudades De MéXico
Perfiles De Los IndíGenas En Ciudades De MéXicoPerfiles De Los IndíGenas En Ciudades De MéXico
Perfiles De Los IndíGenas En Ciudades De MéXicoguestc74c5d0
 
Ncvs Questionnaire
Ncvs QuestionnaireNcvs Questionnaire
Ncvs Questionnaireguestc74c5d0
 
Ncvs Incident Report Para Hispanos
Ncvs Incident Report Para HispanosNcvs Incident Report Para Hispanos
Ncvs Incident Report Para Hispanosguestc74c5d0
 
Mercado Laboral Rural En Mexico Cepal
Mercado Laboral Rural En Mexico CepalMercado Laboral Rural En Mexico Cepal
Mercado Laboral Rural En Mexico Cepalguestc74c5d0
 
Ncvs Cuestionario BáSica Para Hispanos
Ncvs Cuestionario BáSica Para HispanosNcvs Cuestionario BáSica Para Hispanos
Ncvs Cuestionario BáSica Para Hispanosguestc74c5d0
 
Mexico Capital Humano E Ingresos
Mexico Capital Humano E IngresosMexico Capital Humano E Ingresos
Mexico Capital Humano E Ingresosguestc74c5d0
 
Las Metas Del Milenio Y La Igualdad De Genero
Las Metas Del Milenio Y La Igualdad De GeneroLas Metas Del Milenio Y La Igualdad De Genero
Las Metas Del Milenio Y La Igualdad De Generoguestc74c5d0
 
La Cultura Del MéXico ContemporáNe2
La Cultura Del MéXico ContemporáNe2La Cultura Del MéXico ContemporáNe2
La Cultura Del MéXico ContemporáNe2guestc74c5d0
 
La Nueva ConstruccióN Del Espacio PúBlico
La Nueva ConstruccióN Del Espacio PúBlicoLa Nueva ConstruccióN Del Espacio PúBlico
La Nueva ConstruccióN Del Espacio PúBlicoguestc74c5d0
 
La Organizacion Del Cuidado De NiñOs Y NiñAs
La Organizacion Del Cuidado De NiñOs Y NiñAsLa Organizacion Del Cuidado De NiñOs Y NiñAs
La Organizacion Del Cuidado De NiñOs Y NiñAsguestc74c5d0
 
La GeometríA De Las Identidades PolíTicas En MéXico
La GeometríA De Las Identidades PolíTicas En MéXicoLa GeometríA De Las Identidades PolíTicas En MéXico
La GeometríA De Las Identidades PolíTicas En MéXicoguestc74c5d0
 

Plus de guestc74c5d0 (20)

Vincular Pp Ss A La Informalidad En Mexico
Vincular Pp Ss A La Informalidad En MexicoVincular Pp Ss A La Informalidad En Mexico
Vincular Pp Ss A La Informalidad En Mexico
 
Sociologia Juaridica
Sociologia JuaridicaSociologia Juaridica
Sociologia Juaridica
 
Sociologia Del Derecho
Sociologia Del DerechoSociologia Del Derecho
Sociologia Del Derecho
 
Poblacion Alvaro Obregon
Poblacion Alvaro ObregonPoblacion Alvaro Obregon
Poblacion Alvaro Obregon
 
Programa Poblacion Df 2001 2006
Programa Poblacion Df 2001 2006Programa Poblacion Df 2001 2006
Programa Poblacion Df 2001 2006
 
Plan Nacional De Poblacion 2008 2012
Plan Nacional De Poblacion 2008 2012Plan Nacional De Poblacion 2008 2012
Plan Nacional De Poblacion 2008 2012
 
Presentacion Maltrato Infantil
Presentacion Maltrato InfantilPresentacion Maltrato Infantil
Presentacion Maltrato Infantil
 
Ncvs Incident Report Questionnaire
Ncvs Incident Report QuestionnaireNcvs Incident Report Questionnaire
Ncvs Incident Report Questionnaire
 
Perfiles De Los IndíGenas En Ciudades De MéXico
Perfiles De Los IndíGenas En Ciudades De MéXicoPerfiles De Los IndíGenas En Ciudades De MéXico
Perfiles De Los IndíGenas En Ciudades De MéXico
 
Ncvs Questionnaire
Ncvs QuestionnaireNcvs Questionnaire
Ncvs Questionnaire
 
Ncvs Incident Report Para Hispanos
Ncvs Incident Report Para HispanosNcvs Incident Report Para Hispanos
Ncvs Incident Report Para Hispanos
 
Mercado Laboral Rural En Mexico Cepal
Mercado Laboral Rural En Mexico CepalMercado Laboral Rural En Mexico Cepal
Mercado Laboral Rural En Mexico Cepal
 
Ncvs Cuestionario BáSica Para Hispanos
Ncvs Cuestionario BáSica Para HispanosNcvs Cuestionario BáSica Para Hispanos
Ncvs Cuestionario BáSica Para Hispanos
 
Mexico Capital Humano E Ingresos
Mexico Capital Humano E IngresosMexico Capital Humano E Ingresos
Mexico Capital Humano E Ingresos
 
Isste
IssteIsste
Isste
 
Las Metas Del Milenio Y La Igualdad De Genero
Las Metas Del Milenio Y La Igualdad De GeneroLas Metas Del Milenio Y La Igualdad De Genero
Las Metas Del Milenio Y La Igualdad De Genero
 
La Cultura Del MéXico ContemporáNe2
La Cultura Del MéXico ContemporáNe2La Cultura Del MéXico ContemporáNe2
La Cultura Del MéXico ContemporáNe2
 
La Nueva ConstruccióN Del Espacio PúBlico
La Nueva ConstruccióN Del Espacio PúBlicoLa Nueva ConstruccióN Del Espacio PúBlico
La Nueva ConstruccióN Del Espacio PúBlico
 
La Organizacion Del Cuidado De NiñOs Y NiñAs
La Organizacion Del Cuidado De NiñOs Y NiñAsLa Organizacion Del Cuidado De NiñOs Y NiñAs
La Organizacion Del Cuidado De NiñOs Y NiñAs
 
La GeometríA De Las Identidades PolíTicas En MéXico
La GeometríA De Las Identidades PolíTicas En MéXicoLa GeometríA De Las Identidades PolíTicas En MéXico
La GeometríA De Las Identidades PolíTicas En MéXico
 

Criminal Victimization Rate Remains Near Historic Low in 2007

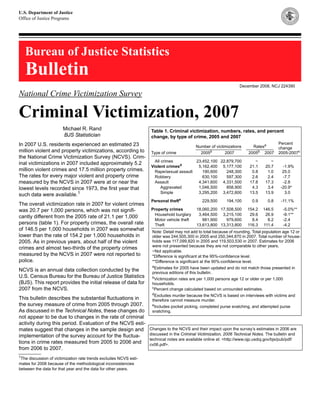
  • 1. U.S. Department of Justice Office of Justice Programs Bureau of Justice Statistics Bulletin December 2008, NCJ 224390 National Crime Victimization Survey Criminal Victimization, 2007 Michael R. Rand Table 1. Criminal victimization, numbers, rates, and percent BJS Statistician change, by type of crime, 2005 and 2007 In 2007 U.S. residents experienced an estimated 23 Percent Number of victimizations Ratesa change million violent and property victimizations, according to Type of crime 2005b 2007 2005b 2007 2005-2007c the National Crime Victimization Survey (NCVS). Crim- All crimes 23,452,100 22,879,700 ~ ~ inal victimizations in 2007 included approximately 5.2 Violent crimesd 5,162,400 5,177,100 21.1 20.7 -1.9% million violent crimes and 17.5 million property crimes. Rape/sexual assault 190,600 248,300 0.8 1.0 25.0 The rates for every major violent and property crime Robbery 630,100 597,300 2.6 2.4 -7.7 measured by the NCVS in 2007 were at or near the Assault 4,341,600 4,331,500 17.8 17.3 -2.8 lowest levels recorded since 1973, the first year that Aggravated 1,046,500 858,900 4.3 3.4 -20.9* Simple 3,295,200 3,472,600 13.5 13.9 3.0 such data were available.1 Personal thefte 229,500 194,100 0.9 0.8 -11.1% The overall victimization rate in 2007 for violent crimes was 20.7 per 1,000 persons, which was not signifi- Property crimes 18,060,200 17,508,500 154.2 146.5 -5.0%** Household burglary 3,464,500 3,215,100 29.6 26.9 -9.1** cantly different from the 2005 rate of 21.1 per 1,000 Motor vehicle theft 981,900 979,600 8.4 8.2 -2.4 persons (table 1). For property crimes, the overall rate Theft 13,613,800 13,313,800 116.3 111.4 -4.2 of 146.5 per 1,000 households in 2007 was somewhat Note: Detail may not add to total because of rounding. Total population age 12 or lower than the rate of 154.2 per 1,000 households in older was 244,505,300 in 2005 and 250,344,870 in 2007. Total number of house- 2005. As in previous years, about half of the violent holds was 117,099,820 in 2005 and 119,503,530 in 2007. Estimates for 2006 were not presented because they are not comparable to other years. crimes and almost two-thirds of the property crimes ~Not applicable. measured by the NCVS in 2007 were not reported to *Difference is significant at the 95%-confidence level. police. **Difference is significant at the 90%-confidence level. aEstimates for 2005 have been updated and do not match those presented in NCVS is an annual data collection conducted by the previous editions of this bulletin. U.S. Census Bureau for the Bureau of Justice Statistics b Victimization rates are per 1,000 persons age 12 or older or per 1,000 (BJS). This report provides the initial release of data for households. 2007 from the NCVS. c Percent change calculated based on unrounded estimates. d Excludes murder because the NCVS is based on interviews with victims and This bulletin describes the substantial fluctuations in therefore cannot measure murder. the survey measure of crime from 2005 through 2007. e Includes pocket picking, completed purse snatching, and attempted purse As discussed in the Technical Notes, these changes do snatching. not appear to be due to changes in the rate of criminal activity during this period. Evaluation of the NCVS esti- mates suggest that changes in the sample design and Changes to the NCVS and their impact upon the survey’s estimates in 2006 are implementation of the survey account for the fluctua- discussed in the Criminal Victimization, 2006 Technical Notes. The bulletin and technical notes are available online at: <http://www.ojp.usdoj.gov/bjs/pub/pdf/ tions in crime rates measured from 2005 to 2006 and cv06.pdf>. from 2006 to 2007. 1 The discussion of victimization rate trends excludes NCVS esti- mates for 2006 because of the methodological inconsistencies between the data for that year and the data for other years.
  • 2. BJS continues to work with the U.S. Census Bureau to bet- NCVS collects information from victims of nonfatal ter understand the impact of these changes upon survey violent crimes and property crimes estimates. Once the research is complete, BJS will publish The NCVS collects information on nonfatal crimes, a technical report to describe the findings. If adjustments to reported and not reported to the police, against persons the reported crime rates for 2006 and 2007 are warranted, age 12 or older from a nationally representative sample of or if other changes to the data are identified, BJS will issue U.S. households. It produces national rates and levels of a revised report to provide users with a more comparable personal and property victimization. Information on homi- set of figures. Based on research completed to date, there cide presented in this report was obtained from the Uniform is a high degree of confidence that survey estimates for Crime Reporting (UCR) program of the Federal Bureau of 2007 are consistent with and comparable to those for 2005 Investigation (FBI). and previous years. Violent crimes measured by the NCVS include rape, sexual While the estimates for 2007 are close to the levels for assault, robbery, aggravated assault, and simple assault. 2005, they are substantially below the levels for 2006. Property crimes include household burglary, motor vehicle Changes in 2006 included the introduction of a new sample theft, and theft. The survey also measures personal theft, based on the 2000 decennial census, a transition from which includes pocket picking and purse snatching. paper-and-pencil interviewing (PAPI) to computer-assisted interviewing (CAPI), and the use of first-time interviews in In 2007, 41,500 households and 73,600 individuals age 12 the new sample areas in the production of survey esti- or older were interviewed for the NCVS. Each household mates. was interviewed twice during the year. The response rate was 90.3% of households and 86.2% of eligible individuals. In 2007, three additional changes were made largely for budgetary reasons to the NCVS program: Violent and property victimization rates remain at • The sample was reduced by 14% in July 2007. historic lows in 2007 • First-time interviews from all sample areas were used in The 2007 violent crime rate was 43% lower than in 1998 the production of 2007 estimates. due to a decline in crime between 1998 and 2002 (figure 1). This rate has remained generally stable since 2003. Rates • Computer-assisted interviews from centralized tele- for robbery and simple assault followed similar patterns phone centers were discontinued in July 2007. across the 10-year period. The crime rate for rape declined marginally between 1998 and 2007. For aggravated Analyses of the 2007 estimates indicate that the program assault, the crime rate fell during both five-year periods, changes made in 2007 had relatively small effects on between 1998 and 2002 and between 2003 and 2007. NCVS estimates. As discussed in Criminal Victimization, 2006, the substantial increases in victimization rates from Overall rate of violent crime fell by 43% from 1998 to 2007 2005 to 2006 do not appear to be due to actual changes in crime during that period. The increases were attributed to Victimization rate per 1,000 persons age 12 or older the impact of the methodological changes in the survey.2 40 35 These effects were reversed in 2007, suggesting that the 2006 findings represent a temporary anomaly in the data. 30 Total violent crime The methodological changes implemented in 2007, their 25 impact on the survey estimates, and the NCVS method- 20 3 Simple assault ological research program are described more fully in the 15 3 Technical Notes on page 7. 10 2 Aggravated assault Users are encouraged to focus on the comparison between 2005 and 5 3 2007 victimization rates until the changes to the NCVS in 2006 are better 3 Robbery 3 Rape 0 understood. 1998 2000 2002 2004 2006 2007 3Represents 2007. Data for 2006 are not included. Figure 1 2 Criminal Victimization, 2007
  • 3. From 1998 to 2007, the rate of overall property crime fell by Property crime rates overall fell by 33% from 1998 to 2007 33% (figure 2). The property crime rate has had a long- Property crime rate per 1,000 households term declining trend for most of the survey’s 36-year his- 250 tory. 200 The overall rates for property crime and theft fell in both the Total property crime 3 first and second half of the 10-year period, with a greater 150 Theft decline from 1998 to 2002 than from 2003 to 2007. The 3 burglary rate fell from 1998 to 2002 and also declined 100 slightly from 2003 to 2007. For motor vehicle theft, the rate 50 Burglary declined from 1998 to 2002 and has remained stable since 3 Motor vehicle theft 2003 (table 2). 0 3 1998 2000 2002 2004 2006 2007 Victimization rates in 2007 were near the levels 3Represents 2007. Data for 2006 are not included. experienced in 2005 Figure 2 The overall violent crime rate in 2007 was not statistically Table 2. Rates of criminal victimization and percent change, different from the rate in 2005. In comparison, the 2007 by type of crime, 1998 and 2007 property crime rate was marginally lower than the rate in 2005. Of the violent crimes measured by the NCVS, aggra- Victimization rates (per 1,000 persons age 12 or older or per 1,000 households) vated assault was the only crime with a significantly lower Percent changea rate in 2007 than in 2005. The rate of victimization for over- Type of crime 1998 2007 1998-2007 all property crime and household burglary were somewhat Violent crimesb 36.6 20.7 -43.4%* lower in 2007, compared to 2005. Rape/sexual assault 1.5 1.0 -33.3* Robbery 4.0 2.4 -40.0* Comparisons are made between the rates for 2005 and Assault 31.1 17.3 -44.4* 2007 because 2006 was an anomalous year due to the Aggravated 7.5 3.4 -54.7* impact of the methodological changes introduced to the Simple 23.5 13.9 -40.9* survey. A new sample introduced in 2006 affected the Personal theftc 1.3 0.8 -38.5%* NCVS estimates in new areas, especially in non-urban Property crimes 217.4 146.5 -32.6%* areas. The new sample required hiring and training a large Household burglary 38.5 26.9 -30.1* number of new interviewers in the new areas. The variation Motor vehicle theft 10.8 8.2 -24.1* in the amount and rates of crime was too extreme to be Theft 168.1 111.4 -33.7* attributed to actual year-to-year changes. These effects Note: In 1998 the total population age 12 or older was 221,880,960 and were reversed in 2007, suggesting that the 2006 findings 250,344,870 in 2007. The total number of households in 1998 was 105,322,920 and 119,503,530 in 2007. represent a temporary anomaly in the data (table 3). See *Difference is significant at the 95%-confidence level. Technical Notes on page 7. a Differences between the annual rates shown do not take into account changes that may have occurred during interim years. bExcludes murder because the NCVS is based on interviews with victims and therefore cannot measure murder. c Includes pocket picking, completed purse snatching, and attempted purse snatching. Table 3. National crime victimization rates and percent change in rates, by type of crime, 2005-2007 Rates per 1,000 persons or households Percent change Percent change Percent change Type of crime 2005 2006 2007 2005-2006 2006-2007 2005-2007 Violent crime 21.1 24.7 20.7 17.1% -16.2% -1.9% Rape/sexual assault 0.8 1.1 1.0 37.5 -9.1 25.0 Robbery 2.6 2.9 2.4 11.5 -17.2 -7.7 Assault 17.8 20.7 17.3 16.3 -16.4 -2.8 Aggravated 4.3 5.4 3.4 25.6 -37.0 -20.9 Simple 13.5 15.3 13.9 13.3 -9.2 3.0 Personal larceny without contact 0.9 0.7 0.8 -22.2% 14.3% -11.1% Property crime 154.2 160.5 146.5 4.1% -8.7% -5.0% Burglary 29.6 30.2 26.9 2.0 -10.9 -9.1 Motor vehicle theft 8.4 8.4 8.2 0.0 -2.4 -2.4 Theft 116.3 121.9 111.4 4.8 -8.6 -4.2 Populations Persons age 12 or older 244,505,300 247,233,100 250,344,900 Households headed by persons age 12 or older 117,099,800 117,858,400 119,503,500 Criminal Victimization, 2007 3
  • 4. Characteristics of victims of violent crimes in 2007 Since 2003, survey respondents have been able to report were similar to previous years more than one racial identity. In 2007, persons of two or more races were victims of violence at higher rates than As in previous years, males, blacks, and persons age 24 or blacks, whites, and persons of other races. younger in 2007 continued to experience violent crime vic- timizations at higher or somewhat higher rates than Hispanic origin of victim females, whites, and persons age 25 or older (table 4). In 2007, there were no significant differences in the rates of Gender of victims victimization for overall violent crime and aggravated assault between Hispanics and non-Hispanics. Hispanics Overall, males were victims of violent crime, robbery, and were more likely than non-Hispanics to be victims of rob- aggravated and simple assault at rates higher than bery. Non-Hispanics had a somewhat higher rate of simple females. Females were more likely than males to be vic- assault compared to Hispanics. tims of rape or sexual assault. Differences between male and female victims of simple assault were not statistically Age of victim significant. As in previous years, a general pattern of decreasing crime Race of victim rates was observed in 2007 for persons in older age groups. For victims of violent crimes, persons age 12 to 15 Blacks were more likely than whites to be victims of rob- and age 16 to 19 were victimized at a significantly higher bery, and somewhat more likely than whites to be victims of rate than persons in all other groups age 25 or older. Per- overall violence. Blacks were also more likely than persons sons age 16 to 19 also experienced higher violent crime of other races (American Indian, Alaska Native, Asian, rates than those age 20 to 24. Persons age 50 and older Native Hawaiian, and other Pacific Islander) to be victims of were victims of violent crime at lower rates than persons in overall violence, robbery, and aggravated and simple younger age groups. assault. Table 4. Rates of violent crime and personal theft, by gender, race, Hispanic origin, and age, 2007 Victimizations per 1,000 persons age 12 or older Violent crimes Assault Demographic characteristic of victim Population All Rape/sexual assault Robbery Total Aggravated Simple Personal thefta Gender Male 122,122,700 22.5 0.1^ 3.4 19.1 4.5 14.5 0.9 Female 128,222,170 18.9 1.8 1.4 15.6 2.4 13.2 0.7 Race White 203,470,370 19.9 1.0 1.9 17.0 3.2 13.9 0.6 Black 30,385,460 24.3 0.5^ 4.9 18.8 4.4 14.4 1.9 Other raceb 13,340,930 11.4 1.2^ 1.8^ 8.3 2.7 5.7 1.1^ Two or more races 3,148,100 73.8 5.5^ 10.8 57.5 13.3 44.2 0.6^ Hispanic origin Hispanic 34,423,520 18.6 0.3^ 3.9 14.5 3.0 11.4 1.0^ Non-Hispanic 215,499,060 21.0 1.1 2.2 17.8 3.5 14.3 0.7 Age 12-15 16,755,440 43.4 1.0^ 4.2 38.2 2.8 35.5 0.8 16-19 16,981,750 50.1 2.4 6.4 41.4 7.2 34.2 1.6^ 20-24 20,752,030 35.2 2.9 3.5 28.7 7.5 21.2 1.1^ 25-34 40,349,730 24.7 1.2 3.4 20.1 4.8 15.3 1.1 35-49 65,636,410 17.7 1.0 1.4 15.3 3.2 12.1 0.6 50-64 53,677,460 11.6 0.3^ 1.7 9.5 2.3 7.2 0.3^ 65 or older 36,192,050 2.5 0.1^ 0.6^ 1.8 0.3^ 1.5 0.8^ Note: The National Crime Victimization Survey includes as violent crime rape, sexual assault, robbery, aggravated assault, and simple assault. Because the NCVS interviews persons about their victimizations, murder and manslaughter cannot be included. ^Based upon 10 or fewer sample cases. a Includes pocket picking, completed purse snatching, and attempted purse snatching. b Other race includes American Indians, Alaska Natives, Asians, Native Hawaiians, and other Pacific Islanders. 4 Criminal Victimization, 2007
  • 5. Rates for property crimes were higher in lower income Federal Bureau of Investigation, Uniform Crime households and large households Reports, 2005-2007 Rates of overall property crime were higher for lower Violent crime as measured by the FBI through the income households compared to higher income house- Uniform Crime Reports (UCR) includes murder and holds. Households earning less than $7,500 per year were non-negligent manslaughter, forcible rape, robbery, victims of property crime at a rate that was about 1.5 times and aggravated assault. Property crime includes higher than households earning $75,000 per year or more. burglary, larceny-theft, and motor vehicle theft. UCR Households earning less than $15,000 per year had higher measures crimes reported to the police, including property crime rates than households in all other income commercial crimes. categories (table 5). The violent crime rate as measured by the UCR Patterns in the rates of household burglary and property increased by 1% between 2005 and 2006 from 469 theft were similar to that of overall property crime. House- per 100,000 persons to about 474. holds in the two lowest income categories—less than $7,500 per year and $7,500 to $14,999 per year—were vic- • Between 2006 and 2007, the violent crime rate declined tims of burglary and theft at higher or marginally higher by 1.4% from about 474 per 100,000 persons to about rates than households in all other income categories. For 467. motor vehicle theft, there was no significant difference in the crime rate across most income categories. • In 2007, the FBI reported 16,929 murders and non- negligent manslaughters. Property crime rates overall were higher for persons living in larger households than for those living in smaller house- • Between 2006 and 2007, the homicide rate declined by holds. Households with six or more persons were about 2.6 about 1%, from 5.7 per 100,000 persons to 5.6. times more likely to be victims of property crime than single person households. For property theft and motor vehicle • The property crime rate declined by 2.8% between 2005 theft, patterns across households of different sizes were and 2006, from 3,432 per 100,000 persons to 3,335. similar to that of overall property crime. For household bur- glary, the rate for households with six or more persons was • Between 2006 and 2007, the property crime rate higher than that for households in most other income cate- declined by 2.1%, from 3,335 per 100,000 persons to gories. 3,264. Table 5. Property crime rates, by household income and household size, 2007 Victimizations per 1,000 households Characteristics of household Number of households Total Burglary Motor vehicle theft Theft Household income Less than $7,500 4,381,010 213.1 57.6 11.1 144.4 $7,500-$14,999 6,757,910 201.3 51.2 10.8 139.4 $15,000-$24,999 9,552,980 167.0 33.5 11.0 122.4 $25,000-$34,999 10,084,590 154.6 25.2 9.5 119.8 $35,000-$49,999 13,292,780 151.2 28.3 7.6 115.2 $50,000-$74,999 14,932,280 144.3 21.8 7.9 114.6 $75,000 or more 22,886,490 146.3 17.2 7.1 122.0 Size of household One person 33,322,630 105.7 26.2 5.4 74.0 Two or three persons 59,490,690 137.7 25.4 8.2 104.2 Four or five persons 23,021,800 207.5 29.6 11.2 166.7 Six or more persons 3,668,420 277.5 40.7 15.1 221.7 Criminal Victimization, 2007 5
  • 6. The general character of violent crime was unchanged In 2007, 1% of rape or sexual assaults, 5% of assaults, and in 2007 25% of robberies were committed by an offender with a firearm. Historically, females have been most often victimized by someone they knew, while half or more of the crimes Between 1998 and 2007, the overall rate of firearm vio- against males have been committed by strangers. Those lence declined from 3.0 to 1.6 victimizations per 1,000 per- general patterns continued in 2007. sons age 12 or older. In 2007, firearms were used in 7% of all violent crime incidents. Over the 10-year period, about In 2007, males were equally likely to be victimized overall 7% to 9% of all violent crimes were committed by offenders by a stranger or a nonstranger (table 6). Male victims of using firearms (not shown in table). robbery and aggravated assault were more likely to be vic- timized by strangers. For simple assault, male victims were Firearm 1998 2007 more likely to have been victimized by someone they knew. Incidents 557,200 348,910 Victimizations 670,500 394,580 Females who were victims of violence were more likely to Firearm crime be victimized by a nonstranger than by a stranger for all Rate per 1,000 persons age 12 or older 3.0 1.6 measured violent crimes, except robbery. Equal percent- Percent of all violent incidents 7.5% 7.1% ages of women reported that they were victims of robberies by strangers and nonstrangers (48%). Nearly half of all violent victimizations were reported to About 623,000 violent crimes—554,000 against female vic- the police in 2007 tims and 69,000 against male victims—were committed by During 2007, 46% of all violent victimizations and 37% of an intimate partner in 2007. The percentage of female vic- all property crimes were reported to the police. The per- tims (23%) of intimate partner violence was nearly 8 times centage of robberies (66%) reported to the police was that of male victims (3%). higher than the percentage of rape or sexual assaults An estimated 20% of all violent crime incidents were com- (42%) and simple assaults (41%). mitted by an armed offender (table 7). As in previous years, the presence of a firearm was related to the type of crime. Table 6. Victim and offender relationship, 2007 Violent crime Rape/sexual assault Robbery Aggravated assault Simple assault Relationship to victim Number Percent Number Percent Number Percent Number Percent Number Percent Male victims Total 2,752,030 100% 11,300 100% 411,450 100% 555,010 100% 1,774,290 100% Nonstranger 1,264,850 46% 6,600 58%^ 89,180 22% 227,870 41% 941,200 53% Intimate 69,100 3 0 0^ 5,960 1^ 16,000 3^ 47,140 3 Other relative 104,810 4 0 0^ 5,710 1^ 24,120 4^ 74,980 4 Friend/acquaintance 1,090,940 40 6,600 58^ 77,510 19 187,760 34 819,080 46 Stranger 1,380,230 50% 4,690 42%^ 302,520 74% 303,530 55% 769,480 43% Relationship unknown 106,960 4% 0 0%^ 19,740 5%^ 23,610 4%^ 63,610 4% Female victims Total 2,425,100 100% 236,980 100% 185,880 100% 303,930 100% 1,698,310 100% Nonstranger 1,677,000 69% 150,830 64% 89,690 48% 186,670 61% 1,249,810 74% Intimate 554,260 23 55,110 23 37,310 20 69,010 23 392,830 23 Other relative 192,250 8 6,530 3^ 14,470 8^ 27,340 9^ 143,920 9 Friend/acquaintance 930,480 38 89,190 38 37,910 20 90,320 30 713,060 42 Stranger 689,780 28% 72,780 31% 89,760 48% 108,690 36% 418,550 25% Relationship unknown 58,330 2% 13,370 6%^ 6,430 4%^ 8,570 3%^ 29,960 2%^ Note: Percentages may not total to 100% because of rounding. ^Based on 10 or fewer sample cases. 6 Criminal Victimization, 2007
  • 7. Table 7. Presence of weapons in violent incidents, 2007 Presence of Violent crime Rape/sexual assault Robbery Simple and aggravated assault offender's weapon Number Percent Number Percent Number Percent Number Percent Total 4,892,000 100% 248,280 100% 566,270 100% 4,077,450 100% No weapon 3,510,330 72% 226,410 91% 230,910 41% 3,053,000 75% Weapon 996,980 20% 13,980^ 6%^ 265,900 47% 717,100 18% Firearm 348,910 7 2,830^ 1^ 144,200 25 201,880 5 Knife 276,150 6 6,280^ 3^ 66,670 12 203,190 5 Other 319,760 7 4,870^ 2^ 44,110 8 270,780 7 Type not ascertained 52,160 1 0^ 0^ 10,910^ 2^ 41,250 1 Don't know 384,690 8% 7,890^ 3%^ 69,460 12% 307,350 8% Note: Percentage may not total to 100% because of rounding. If the offender was armed with more than one weapon, the crime is classified based on the most serious weapon present. ^Based upon 10 or fewer sample cases. Fifty percent of burglaries and 31% of household thefts Table 8. Crimes reported to the police, by gender, race, and were reported to the police. Motor vehicle theft (85%) was Hispanic origin, 2007 the property crime most frequently reported to the police. Victim gender, race, and Percent of crime reported to police, 2007 Hispanic origin Violent Property Percent of crime reported to police, 2007 Total 46.3% 37.2% Violent crime 46.3% Rape/sexual assault 41.6 Male 45.4% 38.2% Robbery 65.6 White 46.5 38.1 Aggravated assault 57.2 Black 43.6 36.6 Simple assault 40.6 Other* 53.0 45.0 Hispanic 46.0% 35.7% Property crime 37.2% Non-Hispanic 45.4 38.6 Burglary 50.1 Motor vehicle theft 85.3 Female 47.3% 36.2% Theft 30.6 White 45.1 36.3 Black 60.2 38.5 Other* 35.3 26.7 Violent crimes against males (45%) and females (47%) were equally likely to be reported to the police in 2007. The Hispanic 49.8% 35.2% same was true for property crimes for households headed Non-Hispanic 46.9 36.5 by males and those headed by females (table 8). Note: Total includes estimates for persons identifying with two or more races, not shown separately. Racial categories displayed are for persons Rates of reporting did not differ for males in different racial who identified with one race. *Other race includes American Indians, Alaska Natives, Asians, Native groups. Violent crimes against black females were more Hawaiians, and other Pacific Islanders. likely to be reported to the police than such crimes against white females or females of other races. For both males and females, there were no differences among Hispanics • In July 2007, computer assisted telephone interviews and non-Hispanics in the likelihood of reporting violent (CATI) from centralized interviewing centers were dis- crime to police. continued, and all interviewing was conducted by field interviewers using computer-assisted personal inter- Technical Notes viewing (CAPI). The U.S. Census Bureau undertook a number of analyses Changes implemented in the NCVS in 2007 had minor to determine the impact of the changes to the NCVS in impacts on estimates 2007. Initial reviews of processes and workload data Three changes were made to the NCVS for budgetary rea- uncovered no factors that would explain the overall year-to- sons in 2007: year differences between the victimization rates for 2006 and 2007. • The sample was reduced by 14% beginning July 2007. Further analyses concentrated on three areas: the NCVS • To offset the impact of reducing the sample, first-time sample reduction implemented in July 2007, the bounding interviews (or bounding interviews) were used in the pro- adjustment, and the elimination of CATI interviews in July duction of 2007 NCVS estimates. Adjustment factors 2007. were applied to the first-time interviews to counteract the effect of including unbounded interviews. Criminal Victimization, 2007 7
  • 8. Victimization estimates in 2007 were relatively upward bias in the NCVS estimates in 2007. The adjust- unaffected by the 14% sample reduction ment process was similar to the one used in 2006 to elimi- nate the impact of using first-time interviews in the incom- The U.S. Census Bureau evaluated whether victimization ing sample associated with the sample redesign. rates for cases dropped from the NCVS sample in July were similar to cases that remained in the sample. Victim- Analyses of the 2007 estimates demonstrate that the ization rates from January to June 2007 were calculated for bounding adjustment effectively countered the impact of cases removed from the sample and for those that including unbounded interviews (table 9). Estimates remained in sample. adjusted for the bounding or first-time interviews were virtu- ally identical to the estimates produced using the second The analysis determined that the sample reduction cases through seventh interviews. had nominally higher personal and property crime rates than those that remained in the sample. An overall 14% Changes in the survey mode and sample redesign sample reduction was not large enough to explain the impacted estimates to a greater extent in 2006 than in observed changes in victimization rates from 2006 to 2007. 2007 Rate per 1,000 persons or households, January - June 2007 The NCVS transitioned from a paper-and-pencil interview Personal crimes Property crimes (PAPI) to a computer-assisted interview (CAPI) to become Cases remaining in sample a fully automated data collection in July 2006. Interviews after July 2007 23.6 151.1 were completed by field representatives either by tele- Cases removed from sample in July 2007 26.6 166.0 phone or in person using questionnaires loaded into laptop computers. Bounding adjustment effectively compensated for the Both before and after the transition, a substantial proportion impact of unbounded interviews of interviews were conducted using computer-assisted- telephone interviews (CATI) from two U.S. Census Bureau The NCVS uses a rotating panel design in which house- telephone centers. CATI is a telephone survey technique in holds remain in sample for three years. All residents age 12 which the interviewer follows a script provided by a soft- or older are interviewed at 6-month intervals for a total of ware application. From 2004 through 2006, the percentage seven interviews. As discussed more fully in the Criminal of sample cases interviewed using CATI declined from Victimization, 2006, Technical Notes, this panel design pro- about 30% to 15% of all interviews. duces a time-in-sample effect on survey estimates. Cases assigned to be interviewed by CATI were not ran- Respondents tend to report more victimizations during first- dom assignments. They were generally selected from pri- time interviews than in subsequent interviews. In part, this mary sampling units (PSUs) with large numbers of sample is because respondents new to the survey tend to recall cases. Cases assigned to CATI were considered easier to events as having taken place at a time that was more enumerate and were usually in urban and suburban areas. recent than when they actually occurred. If a case could not be completed in CATI, it was returned to To offset this bias, a bounding procedure in which first-time a field representative to attempt to complete the interview. interviews are not included in the production of estimates has traditionally been used for the NCVS (i.e., seven inter- view rotations minus the bounding interview). Prior to 2006, Table 9. Type of crime, with bounding adjustment victimizations reported during first-time interviews were and without first interview, 2007 used only to bound future interviews. Rate per 1,000 persons or households With bounding Without first In July 2007, interviews with first-time households were Type of crime adjustment interview used in the production of survey estimates to offset the impact of the 14% sample reduction. During the year, one- Violent crime 20.7 20.5 Rape/sexual assault 1.0 1.0 seventh of all sampled households were interviewed each Robbery 2.4 2.3 month for the first time. Using first-time interviews to calcu- Assault 17.3 17.2 late victimization estimates helped to ensure that the over- Aggravated 3.4 3.5 all sample size would remain consistent with previous Simple 13.9 13.8 years. Personal larceny 0.8 0.7 Without an adjustment for the time-in-sample effects of Property crime 146.5 144.9 first-time interviews, including those households would Burglary 26.9 26.9 have introduced an upward bias in the survey estimates. Motor vehicle theft 8.2 8.2 Theft 111.4 109.9 Weighting adjustments were developed to counteract an 8 Criminal Victimization, 2007
  • 9. In July 2007, CATI as an interview technique was discontin- Personal crime rates for outgoing sample areas in 2005 ued due to the cost and time involved to transfer cases to were generally lower than those in areas that continued in and from the telephone centers. Beginning in the second sample across the redesign. Incoming or new sample half of 2007, all NCVS interviewing was conducted using areas in 2006 generally had higher personal crime rates CAPI. Analysis by the U.S. Census Bureau indicated that than continuing areas. Not all differences measured quar- the transition from PAPI to CAPI affected the 2006 personal terly—January through March, April through June, July crime (violent crime and personal theft) rates. Those effects through September, and October through December— were reduced in 2007 (figure 3). were statistically significant (figure 4). As standard practice, the U.S. Census Bureau updates its The transition from PAPI to CAPI as an interview technique sample areas for ongoing household surveys about mid- affected the property crime rates in 2006. Those effects decade. To account for shifts in the population and house- were reduced in 2007 (figure 5). In 2007, there was little hold locations that occur over time, a new sample was evidence that the household crime rates for outgoing or introduced to the NCVS in 2006. Analysis of personal crime incoming areas were different than the rates for continuing rates before and after the sample redesign showed an areas (figure 6). extensive effect in 2006 and a reduced effect beginning April 2007. Increased rates of victimization for personal crimes were Transition from PAPI to CAPI in 2006 affected the observed in 2006 during the transition from PAPI to CAPI victimization rate reported for property crime Crime rate per 1,000 persons Crime rate per 1,000 households 35 200 CAPI 30 CATI Overall 175 CATI Overall CAPI 25 150 20 PAPI PAPI 125 15 100 10 75 5 50 0 1st 2nd 1st 2nd 1st 2nd 1st 2nd 1st 2nd 1st 2nd 1st 2nd 1st 2nd 2004 2005 2006 2007 2004 2005 2006 2007 Calendar years shown in 6-month intervals Calendar years shown in 6-month intervals January-June (1st) and July-December (2nd) January-June (1st) and July-December (2nd) Figure 5 Figure 3 Personal crime rates were generally higher for incoming or Property crime rates in 2007 were about the same for new sample areas after CAPI was introduced in July 2006 incoming, continuing, and outgoing sample areas Crime rate per 1,000 persons Crime rate per 1,000 households 35 New 200 30 Continuing New Overall 175 25 150 Continuing 20 Overall 125 Old Old 15 100 10 75 5 50 0 1st 2nd 1st 2nd 1st 2nd 1st 2nd 1st 2nd 1st 2nd 1st 2nd 1st 2nd 2004 2005 2006 2007 2004 2005 2006 2007 Calendar years shown in 6-month intervals Calendar years shown in 6-month intervals January-June (1st) and July-December (2nd) January-June (1st) and July-December (2nd) Figure 4 Figure 6 Criminal Victimization, 2007 9
  • 10. Analysis of the 2006 and 2007 estimates revealed interac- BJS and the U.S. Census Bureau continue to examine tions between survey mode and sample type (i.e., old ver- the impact of methodological changes on survey sus new versus continuing). When CAPI interviewing was estimates introduced in July 2006, interviews conducted in incoming Analyses undertaken by BJS and the U.S. Census Bureau sample areas produced much higher personal crime rates established that the year-to-year 2005 to 2006 and 2006 to than CAPI interviews in continuing areas, an effect attrib- 2007 NCVS estimates were not comparable as a result of uted to the impact of new interviewers in the new sample the methodological changes introduced to the survey in areas. This effect appeared to diminish in the second 2006. The apparent increase in victimization from 2005 to quarter, April to June 2007. In comparison, no such clear 2006 has been largely attributed to implementing a new patterns were evident for property crime rates when sample design, training interviewers new to the survey, and mode—PAPI, CATI, and CAPI—and sample type were changing the mode of collecting the data. examined. These changes were most heavily felt in new sample areas The transition from PAPI to CAPI and the effects of the in 2006, which were mainly rural areas. Data collected in sample redesign resulted in increases in crime rates in those areas appeared to coincide with the greatest shifts in 2006 and prevented comparing those NCVS estimates with reported crime rates from 2005 to 2006. earlier years. The effects were primarily in rural areas, which had a larger percentage than urban and suburban Urban and suburban areas surveyed in 2006 using both the areas of incoming or new sample areas and outgoing old and new sample designs were designated as continu- areas. ing areas. Estimates of violent and property crime did not change significantly from 2005 to 2006 in those continuing The observed effects on the 2006 estimates diminished in areas. In comparison, violent and property victimization 2007. This decrease was consistent with the explanation rates in new areas—areas included in the new sample that the selection of a new sample requires hiring and train- design only—increased greatly, compared to the old areas ing new interviewers to administer the survey during every they replaced. redesign. Interviewers new to the survey and the training associated with the redesign resulted in higher victimization The substantial changes in victimization estimates from rates being reported. 2005 to 2006 and from 2006 to 2007 were too extreme to be attributable to actual year-to-year changes. Users The effects of the sample redesign and changes in the sur- should focus on the comparison of the 2005 and 2007 rates vey administration or mode in 2006 decreased in 2007. The until these issues are resolved. It is emphasized that the NCVS estimates in 2007 are comparable to those in 2005 impact of the changes is on estimates of the extent and and earlier years. rates of crime, not on the attributes of victims or crime inci- dents. Based on research completed to date, the data for 2007 as presented in this report are comparable with esti- mates for 2005 all previous years of the NCVS. 10 Criminal Victimization, 2007
  • 11. Methodology personal crimes is the sum of all person weights. The base for the property crime rates is the sum of all household The National Crime Victimization Survey (NCVS) is an weights. For more detail, see Criminal Victimization in the annual data collection conducted by the U.S. Census United States, Statistical Tables, Methodology at <http:// Bureau for the Bureau of Justice Statistics (BJS). The www.ojp.usdoj.gov/bjs/abstract/cvusst.htm>. NCVS collects information on nonfatal crimes, reported and not reported to the police, against persons age 12 or older The NCVS sample was reduced by 14% in 2007 based on from a nationally representative sample of U.S. house- new budgetary constraints. To offset this reduction begin- holds. Violent crimes measured by the NCVS include rape ning with the 2006 NCVS, BJS included the data from the or sexual assault, robbery, aggravated assault, and simple first interview in the production of estimates. assault. Property crimes include household burglary, motor Earlier research conducted during the development of the vehicle theft, and theft. NCVS found that persons often report crimes that occurred The survey results in this report are based on data gath- before the reference period. Prior to 2006, the first of seven ered from residents living throughout the United States, interviews was used to bound subsequent interviews and including persons living in group quarters, such as dormito- not in the production of NCVS estimates. The second inter- ries, rooming houses, and religious group dwellings. Armed view was the first data used in the analysis. Forces personnel living in military barracks and institutional To reduce costs and leverage more of the data in 2006, and persons, such as correctional facility inmates, were not to account for the sample reduction in 2007, BJS applied a included in the scope of this survey. bounding adjustment to the first interview to nullify any Each housing unit selected for the National Crime Victim- over-reporting of crime. This allowed BJS to use the sur- ization Survey (NCVS) remains in the sample for three vey’s full data collection. Further research showed that the years, with each of seven interviews taking place at 6- bounding adjustment had no appreciable effect on the esti- month intervals. An NCVS field representative’s first con- mates. This change did not explain the fluctuation in the tact with a household selected for the survey is in person. rates observed from 2005 through 2007. The field representative may conduct subsequent inter- Comparisons of percentages and rates in this report were views by telephone. To elicit more accurate reporting of tested to determine if observed differences were statisti- incidents, the NCVS uses a self-respondent method that cally significant. Differences described as higher, lower, or requires a direct interview with each person 12 years or different passed a test at the 0.05 level of statistical signifi- older in the household. cance (95%-confidence level). Differences described as Annual collection year estimates of the levels and rates of somewhat, slightly, marginally, or some indication passed a victimization are derived by accumulating estimates quar- test at the 0.10 level of statistical significance (90%-confi- terly. The weights of all crimes reported during the inter- dence level). Caution is required when comparing esti- views in that year are summed, regardless of when the mates not explicitly discussed in this bulletin. crime occurred. The base for the collection year rate for Criminal Victimization, 2007 11
  • 12. U.S. Department of Justice *NCJ~224390* PRESORTED STANDARD POSTAGE & FEES PAID Office of Justice Programs DOJ/BJS Bureau of Justice Statistics Permit No. G-91 Washington, DC 20531 Official Business Penalty for Private Use $300 This report in portable document format and in The Bureau of Justice Statistics is the statistical agency ASCII and its related statistical data are of the U.S. Department of Justice. Michael D. Sinclair is available at the BJS World Wide Web Internet deputy director. site: <http://www. ojp.usdoj.gov/bjs/abstract/ BJS Bulletins present the first release of findings from cv07.htm> permanent data collection programs. This Bulletin was written by Michael R. Rand. Patsy A. Klaus and Cathy T. Maston verified the report. Office of Justice Programs Georgette Walsh edited the report. Tina Dorsey Innovation • Partnerships • Safer Neighborhoods produced the report and Jayne Robinson prepared http://www.ojp.usdoj.gov the report for final printing under the supervision of Doris J. James. December 2008, NCJ 224390 12 Criminal Victimization, 2007