2. DESK",N ON A M A T H F M A T I C A I . MtlDEL 37
1 1 1
Months JAN ; FEE MAK APK MAY : .HINE i JULY AUG iSEPTi OCT 1 HOV CKC
Peak
1
u1 y
2
L' U
a 4 E
1^i •: 7
djii -.
1
9
11 Rating Descriptor
1- ChBini.-Ji.pBn Inici.! Tisili CanpetiUcti T Fukushima Champiornhipa 0 Rest
Schedule 3ThtjhofcuSludBntC«npstititjn 8' 9th Wstlii ChsmpionEhip^iti ALhlatBi
i Mjto InUtnati'MiJC^mpstiUon ff Habanal Chsmpionships 1 Very Easy
4 Th^hsku intetc^llaguUChanipiaiKhips S Kalisnal UiiinUuning';Bmps l'^-S 2 Easy
3 Moderate
Macro Preparation C DID petition R 4 Somewhat Hard
3 4 5 6 7 fl 9 1 lo: 11 12 13 1 2
5 Hard
! ! 1 6
Technique Arm dri-v/RvJJtrrt Aonad/FiTn/[>riva
7 Very Hard
Physical 8
g Very, Very Hard
10 Maximal
FIGURE 1. Program design in 2003.
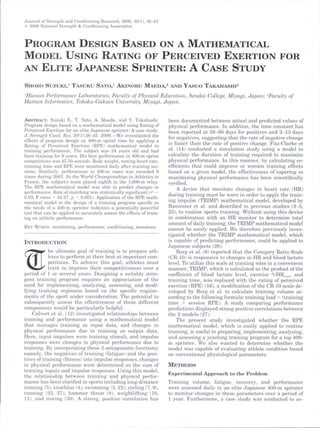
FKJURE 2. Tbe subject's rating nf perceived exertion I RPE)
was obtained with the use of a modified Borg scale (16). The
certain wbetber a performance-peaking program de- suhject was shown the scale approximately 30 minutes follow-
signed hased on an RPE mathematical model would he ing the conclusion of the training hout and asked "How was
our training today?"
effective in actual competition. Tbe training program de-
signed in 2003 for tbe subject by his coach comprised sev-
eral macrocycles (rests, preparations, and competitions)
and 13 mesocycles (Figure 1). In 2003, tbe subject com- mediately weighed bimself to an accuracy of 50 g using
peted in the following competitions: China-Japan Indoor UC-300 scales (Measurement Specialists, Huntsville, AL).
Track Competition {Fehruary 22). Toboku Student Com- To assess the effects of training on tbe body, the sub-
petition (April 12), Mito International Competition (May ject was asked RPE following tbe completion of each
5), Toboku Intercollegiate Cbampionships (May 18), Jap- training session using tbe session RPE scale developed
anese Track and Field Cbampionsbips (June 8), Japanese by Foster and Lebmann (16; Figure 2). Subjective muscle
Intercollegiate Cbampionships (July 4), Fukusbima pain was assessed using the CPS scale developed by Ar-
Cbampionships (July 13), Ninth World Championships in vidsson et al. (2; Figure 3). To assess RPE and CPS dur-
Athletics (August 23-31), and National Cbampionsbips ing exercise sessions, standard instruction and anchoring
(October 28). For a period of almost 1 year, from January procedures were explained during a familiarization ses-
7 to December 20, 2003, the suhject was instructed to sion (25). At 30 minutes after the end of eacb training
keep a training journal recording morning HR, body session, the subject was asked, "How was your training
weight, RPE, category ratio pain scale (CPS), and total today?" to determine RPE score, and "How are your mus-
quality recovery (TQR). Whether tbe RPE matbematical cles?" to determine CPS. Tbe suhject tben stated scores
model could predict actual performance was ascertained for all activities during tbe training session. Similarly, to
in four competitions up to May 2003. Because the model determine recovery from the training ofthe previous day,
was shown to he able to predict performance, a perfor- subjective recovery was assessed every morning using tbe
mance-peaking training program was designed using tbe TQR scale developed hy Kentta and Hassmen (21; Figure
model in an attempt to yield optimal performance during 4) and the CPS scale.
subsequent important competitions.
The TQR scale was used in the same manner as the
All data were analyzed using Excel software (Excel RPE and CPS scales. The subject was shown tbe scale
Software, Placitas, NM) and were available to the sports before breakfast and was asked "How is your condition
scientist, coacb, strengtb-and-conditioning specialist, and now?" to determine his TQR score.
athlete so tbat they could visually ohserve daily changes Table 1 sbows tbe contents of microcycle training and
in the ahove-mentioned parameters. assessment of tbe training progi'am in terms of load, mo-
notony, and strain, whicb were quantified according to
Subject tbe metbods reported by Foster and Lehmann (15, 16).
The suhject was a 24-year-old track athlete (height, 174.5 The subject was required to record in bis training
cm; weight, 63 kg) witb a 9-year background in training journal tbe duration of training and RPE las subjective
wbo won the 400-m sprint in tbe Japanese Track and exertion) 30 minutes after the end of daily training.
Field Championship in 2003 and 2004, was in tbe team Training load was calculated by multiplying duration of
that finisbed eighth in tbe 1,600-m relay at the Ninth training by RPE. For example, the suhject performed rep-
World Cbampionsbips in Atbletics in 2003, and was se- etition training on Tuesdays, so tbe load for Tuesdays was
lected to represent Japan in the 2004 Athens Olympics. 180 X 6 = 1,080 units. Mean (± SD} weekly load was
Informed consent was obtained after thorough explana- calculated as 686 ± 661 units.
tion ofthe study objectives and methods. Study protocols Monotony was calculated by dividing the weekly av-
were approved by the Ethics Review Board of Sendai Col- erage by the standard deviation (1.04). In other words,
lege, Japan. training monotony resulted in a small standard deviation
and a high monotony value. A small monotony value in-
Parameters Measured dicated a high degree of training variation.
Tbe subject measured HR hy palpation ofthe radial pulse Strain was calculated by multiplying the mean weekly
for 1 minute while still in bed in the morning, then im- load hy monotony (4,994). In otber words, training with
3. 38 SUZUKI, SATO, MAEDA ET AL.
Rating Descriptor Rating Descriptor
20 = Extremely strong 6
151 7 Very, Very Poor Recovery
8
121 Very strong
10- 9 Very Poor Recovery
9- 10
8- 11 Poor Recovery
7- 12
6 - Strong
5~ 13 Reasonable Recovery
14
4— 15 Good Recovery
3 - Moderate 16
17 Very Good Recovery
Q
18
19 Very, Very Good Recovery
Light 20
1.0- FIGURE 4. Subjective recovery was assessed using Kentta
and Hassmen's total quality recovery scale 121), The subject
was shown the scale hefore hreakfa.st and was asked, "How is
Very light your condition now?"
0.5- (1, 15). If long, low-intensity training was performed the
day after short, high-intensity training to reduce fatigue,
Extremely light training load would be consistently comparable, increas-
ing monotony. If this type of training monotony continued
for periods of weeks, months, and years, the degree of
oJ —No pain physical stress would increase, diminishing training ef-
fects and increasing the risk of overtraining (19).
FKiUKK 3. Subjective muscle pain was assessed using the Mathematical Model Using Rating of Perceived
category ratio pain scale (CPS) developed by Arvidsson 12). At Exertion
30 minutes after the end of each training session and hefore
breakfast, the subject was asked "How are your muscles?" to Recorded training parameters were used for a system
determine the CPS score. model adapted from the model developed hy Morton et al.
(23). Levels of fitness and fatigue, p(t) and f(t), were ob-
tained by convolving training load (w(t) ^ training time
a high degree of" variation resulted in a low monotony X session RPE), with training responses g(t) and h(t), as
value and thus low strain. described by Banister and Hamilton (5). The value w(t)
Even if total weekly load was low, repeated training is expressed in arbitrary units; so that:
monotony (long, low-intensity training! performed on a
daily basis would increase the level of monotony and pit) = w(t)-g(t), and (1)
strain and could result in overtraining and sports injury fit) - wi.t)-h(t). (2)
TABLE 1. Evaluation of the load, monotony, and strain associated with a training program.
Duration
Day Training session Load
(min)
Monday Rest 0 0 0
Tuesday High-tempo training 180 6 1080
Wednesday Short interval. Resistance training 120 6 720
Thursday Rest 0 0 0
Friday Up-and-down hill training 180 9 1620
Saturday Jump training 180 7 1260
Sunday Jog 5 km, easy 30 4 120
Mean weekly load 686
Standard deviation of mean weekly load 661
Monotony (mean weekly load/standard deviation of mean weekly load) 1.04
Total weekly load (mean weekly load x 7) 4802
Strain (total weekly load X monotony) 4994
* RPE = rating of perceived exertion.
4. Pi«x~,KAM DFSICN BASFD ON A MATKFMATICAL MOD[-:I_ 39
300 r RPE -a-CPSl 1 Competitions 20
1(12 a i K •.il]3 * 1 2 6112 7/12 8IIZ 9/12 10/12 11/12 12/12
Date inv, 2/lK 3/12 A/2 6112 6/12 7/12 B/12 9/lE 10/lZ ll/lf. 12/12
Date
FICURE 5. Weekly changes in training time, rating of per-
ceived exertion (RPE), and category ratio pain scale (CPS). FIGURE 6. Weekly changes in morning category ratio pain
scale (CPS) and total quality recovery (TQRl including the
peaking periods.
In the description by Banister and Hamilton (5), the
mathematical form of the functions g(t) and hit) were as
follows:
•W.>Bht-»-R.=t-HR [ I Competitions
git) = e "'•'., and (3)
h(t) - e "^^ (4)
I . M U 11 i I
where T, and T,^ represent decay time constants for fitness
and fatigue (first estimated as 45 days and 15 days, re-
spectively, then refined by iteration), and t is time. ANiu i
An index of performance was obtained from difference
hetween levels of fitness and fatigue weighted by a coef-
ficient k:
ail) = k,-p(t^ - ^2-/f^) 'fj)
1/12 2IIZ HII7. 4/12 fiil2 6/12 H/IH 9(12 I(V12 11/12 !2/IK
where fe, and k.^ represent the proportionality factors of
Date
fitness and fatigue (first estimated as /;, = 1 and k.^ = 2,
then refined by iteration). FIGURE 7. Weekly changes in morning pulse rate and weight.
In our apphcation, the mathematical form of response
functions were as follows:
gU) = and (6) RPE, and CPS decreased hefore the Japanese and World
Championships in 2003. Mean annual RPE and CPS were
hit) = (7) high at 5.6 and 6.6, respectively, indicating that the sub-
ject underwent physically demanding training during the
Performance ait) was determined as the difference be- training season. In addition, during these 2 major cham-
tween fatigue and fitness levels, as such: pionships, CPS was 0 (no pain) and TQR was 17 to 20
ait) - pit) - fit) (8) (favorable recovery), indicating that the subject competed
in the 2 major championships after having sufficiently
By recurrence, p(t), f(t), and thus a(t) could be calculated recovered from muscle pain and fatigue (Figure 6).
using previous successive training loads and individual
parameters T,, T^, ^i, and k.^. Morning Heart Rate and Body Weight
Model parameters were determined by fitting model
performances to the 400-m races during the 9 competition Figure 7 shows weekly changes in morning HR and body
periods. These parameters were obtained by minimizing weigbt, which decreased as the subject prepared for the
the residual sum of squares (RSS) hetween modeled and 2 major championships. Morning HR and body weight on
actual performances. A multiple linear regression method the day of the 2 major championships were 58 b-min '
was used after decay time constants were fixed. and 61.8 kg, respectively. In 2003, the degree of daily fiuc-
tuation in morning HR and body weight in 2003 was 10
Statistical Analyses b-min ' and 3.1 kg, respectively.
Indicators of goodness-of-fit were estimated for the levels
of model. Coefficients of determination ir') hetween mod- Load, Monotony, and Strain
eled and actual performances were calculated. Statistical Figure 8 shows weekly changes in load, monotony, and
significance of fit was tested using analysis of variance strain in 2003. As an indicator of total amount of training,
on the RSS. The statistical F test was used to estimate load decreased as the subject prepared for the 2 major
level of significance for model fit. championships. Monotony, indicating training variation,
decreased from 1.02 to 0.8 hefore the national champi-
RESULTS onships and from 1.4 to 0.8 before tbe world champion-
Training Time and Subjective Parameters ships. Furthermore, strain also decreased before both ma-
Figure 5 shows weekly changes in training time, RPE 30 jor championships.
minutes after training, and CPS for 2003. Training time, Mean monotony was 0.74 ± 0.4, suggesting that the
5. 40 SUZUKI, SATO, MAEDA ET AL.
15000 r
FaUgue
^ 80000
10000
5000
1112 Sn2 3112 Alls SI12 ll2 8fia 9(12 ions 11112 1211?.
1(13 3(ia 3(13 1(13 5(13 «(13 1112 BII3 9(13 10(13 11
§ 30000
g - 44
3
o 46
B
o
s - I 48 J
I ! T(13 8(13 9tl3 1(U13 11(13
1(18 2(12 3(12 4(ia 5(12 «1S 7(12 WIK 9(12 10(12 11(12 12(18 Date
20000 FiGURK 9. Changes in actual and predicted performance.
16000
championships. According to introspective reports on per-
I 12000 formance, the subject wrote that he could win the 400-m
sprint at the Japanese championships, his most impor-
W 8000 tant competition in 2003, and achieved this in a time of
40O0 45.63 seconds. In the preliminary race, his time was 0.13
0
[•-"-AAAA ; seconds faster than in the final race, and satisfied the A
standard (45.55 seconds) for the World Championships in
1(12 2(12 3(12 4(12 5(12 «12 7(12 8112 9(12 10(12 11(12 12(12
Athletics. Based on results from the Japanese champi-
Date onships, his coach redesigned the training program to
FicuRE 8. Weekly changes in load monotony and strain. prepare him for the Ninth World Championships in Ath-
letics in August. With a time of 46.53 seconds, approxi-
mately 1 second slower than his personal best, the suhject
subject underwent training with a high degree of varia- failed to make the 400-m final in the world champion-
tion. ships. However, in the 1,600-m relay, he ran anchor leg
and finished eighth with a time of 3 minutes 2.35 seconds.
Actual and Predicted Performance Thayer (31) found that stimulation, overloading, ad-
Figure 9 shows the relationship between actual perfor- aptation, and training effects correlated with fast recov-
mance and the performance curve derived using the RPE ery, stating that alternating periods of training and rest
model and times for 400-m sprints in the 9 competitions. are important to maximize cyclic training. This is partic-
The mathematical model was prepared using the follow- ularly important when designing a yearlong training
ing coefficients and time constants for fatigue and fitness plan. Thayer also stated that a yearlong training program
in the subject: with a high degree of variation can maintain a low mo-
notony level. Regarding the yearlong training program
FitU) = l-w(t}-e "^ and designed for the present subject, a 5-mesocycle block was
scheduled before each important competition. In other
Failt) = 2-w(t)-e "^''. words, the program specified the amount of training
These coefficients were calculated to achieve minimal (load) to be tapered before each important competition.
RSS between actual and predicted values. While predict- As to changes in monotony and strain, these parameters
ed value was lower than the actual value for the first were low before the national and world championships,
indoor competition, actual and predicted values were sim- enabling the subject to enter while undergoing training
ilar for outdoor competitions (r- = 0.83; F ratio = 34.27, with a high degree of variation, to reduce the amount of
p < 0.0011. physical stress. Foster and Lehman (15, 16) followed the
load, monotony, and strain of elite long-distance runners
DISCUSSION for 2 years and reported that training with a high degree
The 2003 training plan for the subject, comprising several of variation and low level of monotony improved compet-
macrocycles containing rests, preparations, competitions, itive performance. As a result, they designed the second
and 13 distinct mesocycles, was designed to ensure that year of the training program to minimize training mo-
the condition of the subject would peak at the major notony. In our previous research on competitive rowers,
6. DI;SIC;N ON A MAIHrMATICAL MODFl. 41
level of monotony was >3 before a competition, and per- designed utilizing tbe RPE matbematical model can sim-
formance was not observed to peak at tbe competition (26, ulate performance fluctuations in terms of intensity, du-
29). Mean monotony for tbe present subject was much ration, and frequency. Overtraining can tbus be prevent-
lower, at 0.74, indicating tbat tbe yearlong training pro- ed and periodization used to maximize performance at a
gram incorporated a bigb degree of variation. particular competition. Furtbermore, maximization of
Morning HR, serving as an objective physiological pa- performance at a particular competition requires not only
rameter, decreased before tbe 2 major cbampionsbips. On utilization of tbe RPE mathematical model, but also tbe
tbe day of tbe cbampionsbips, morning HR was 58 combination of objective and subjective parameters sucb
b-min ', lower tban tbe mean morning HR of 60 b min '. as morning HR, CPS, TQR, and monotony. Program de-
Dressendorfer et al. (13) reported tbat wben fatigue sign accounting for these parameters sbould prove useful
symptoms worsened, morning HR increased by more tban in routine training for top atbletes.
10 b min '. Wbile morning HR did not increase by more For a program such as the described model to function
tban 10 b-min ' for our subject before any of tbe impor- optimally, tbe sport scientist, sport coach, and strengtb-
tant competitions, subjective and objective parameters of and-conditioning professional must plan the program to-
monotony, strain, TQR, and CPS were poor at times wben gether and share goals and strategies.
morning HR did increase by >10 b-min '. Tbese findings
suggest tbat wben planning and assessing yearlong train- PRACTICAL APPLICATIONS
ing programs, monitoring basic pbysical parameters is
important for determining pbysicai conditioning of atb- In practical terms, program design involves manipulating
letes. training intensity and volume wbile being respectful of
Fry et al. (17, 18) reported tbat tbe major objectives the seasonal demands of the specific sport and athlete.
of periodization, wbicb is at the core of training program Many coaches prepare training programs to peak atbletic
design, are to prevent overtraining and to ensure peak or performance during important competitions. To maximize
maximized performance at appropriate times. Further- performance during important competitions, the quality
more, tbe key for successful program design is to ensure of training programs must be improved. An RPE mathe-
recovery from fatigue (18, 22). matical model was used as a tool for designing training
programs, and combined witb sucb subjective and objec-
Loren et al. (20) suggested tbat training effects will tive parameters sucb as CPS, TQH, and monotony, tbe
be maximized wben tbe fitness-fatigue model is effective- model was sbown to function as an effective tool in tbe
ly utilized witbin any yearlong program design. field.
In the present study, the RPE model, wbicb reflected This system comprising a mathematical model and
tbe aftereffects of fatigue and fitness, was used to predict pbysical condition assessments runs on Excel, and daily
performance in 400-m sprints, and predicted and actual changes in performance can be visually cbecked in the
performances were compared in 4 competitions up to form of figures and charts. In addition, maximal perfor-
May. The results showed that the model could predict mance during important competitions can be simulated
performance ir^ = 0.88; F ratio = 52.04; p < 0.001}. Fur- by adjusting training time, intensity, and frequency. The
thermore, the sports scientist, coach, and strength-and- present results show that by adding performance predic-
conditioning specialist each comprehensively examined tions based on a matbematical model to tbe existing pe-
the performance curve derived from tbe matbematical riodization metbod, optimal performance can be targeted
model and cbanges in various parameters, sucb as morn- during important competitions while preventing over-
ing HR, CPS, TQR, and monotony, and concluded tbat tbe training. In addition, by collecting more data, tbe present
RPE mathematical model could be utilized as a tool for system sbould contribute to improving tbe quality of
aiding tbe design of training progi'ams. Next, the sports training programs designed by coaches.
scientist performed a simulation study using the RPE
mathematical model to maximize subject performance
during tbe Japanese Track and Field Cbampionships by REFERENCES
altering training volume, and tben tbe idea of preparing 1. ANI)KI{.S()N, L., T. TRTPLETT-MrBmnE, C. FOSTER, S. DOGER-
a microcycle peaking program was provided as feedback STEIN, AND G. BKK'E. Impact of training patterns on incidence
to tbe field. Based on tbese data, tbe coacb prepared the of illness and injury during a women's c-ollegiate basketball
final program. During training, the sports scientist and season. J, Strength Cond. Res. 17:734-738. 2003.
strength-and-conditioning specialist analyzed and as- 2. AjiViiissoN, I. Rehabilitation of athlete's knee. Med. Sport Sci.
sessed changes in various parameters and reported tbe 26:238-246. 1987.
results back to tbe coacb. Based on tbis feedback, tbe 3. BANISTER, E.W.. AND T.W. CALVEKT. Planning for future per-
coacb readjusted tbe training volume. Subsequently, at formance: Implication for long term training. Can. J. Appl.
the Japanese Track and Field Championships, the suhject Sport Sci. 5131:170-176. 1980.
4. BANISTKK, E>.W., J . B . CARTF.K, AND P . C . ZAEKADSA. Training
was able to run bis personal best at 45.50 seconds. Tbe theory and taper: Validation in triathlon athletes. Eur. J. Appl,
RPE mathematical model was used again to prepare for Physiol. 79:182-191. 1985.
tbe Nintb World Cbampionsbips in Athletics. However, 5. BANISTKR, E.W., A D C.L. HAMILTON. Variations in iron status
N
because training volume was adjusted by tbe bead coach with fatigue modeled from training in female distance runners.
of the national team during tbe 3-week overseas camp, Ear. J Appl. Physiot. 54:16-23. 1985.
tbe present system could not be effectively implemented fi. BoRU, G.A.. P. Pi.AsswK.Mi., AND M. LANCERSTROM. Perceived
in the subject. Using data collected during tbe camp, the exertion related to heart rate and blood lactate during arm and
RPE mathematical model showed tbat tbe subject en- leg exercise. Eur. J. Appl, Physiol. 65:679-685. 1987.
tered the World Championships during a low point of his 7. Biisso. T., H. BENOIT, R. BONNEFOY, ., FKASSON, AND J.R. LA-
performance curve. COUR. El!'[>cts of training frequency on the dynamics of perfor-
mance response to a single training bout. -J. Appl. Physiol. 92:
Tbe present findings suggest tbat yearlong programs 572-580. 2002.
7. 42 SUZUKI, SATO, MAEDA ET AL.
8. BL-SKO, T., R. CANDAU. AND J.R. LACOUH. Fatigue and fitness 20. LOKEN, Z.F.C., AND L,B, JACQE. The fitness-fatigue model re-
modelled from the effects of training on performance. Eur. J. visited implications for planning short- and long-term training,
Appl. Physiol. 69:50-54. 1994. J. Strength Cond. Res. 25(6):42-51. 2003.
9. Birss(J, T., C. CARASSO, AND J.R. LACOUK. Adequacy of a sys- 21. KJ-;N'ITA, G., AND P. HASSME.N. Overtraining and recovery.
tems structure in the modeling of training effects on perfor- Sports Med. 26{1):9-16. 1998.
mances. J. Appl. Physiol. 7:2044-2049. 1991. 22. MORTON, R.H. Modelling training and overtraining. J. Sports
10. Bussd, T., K. HAKKINEN, A. PAKARTNEN, C. CAHASSO, J.R. LA- Sci. 15:335-340, 1996.
COUK, P.V. KOMI, AND H. KAUHANKK, A systems model of train- 23. MORTON, R.H., J,R, FITZ-CLARKE, AND E.W. BANISTER. Mod-
ing responses and its relationship to hormonal in elite weight- eling human performance in running. J. Appl. Physiol. 69:
lifters. Eur. J. Appl. Physiol. 61:48-54. 1990, 1171-1177. 1990.
11. Busso, T., K. HAKKINEN, A. PAKARiNi':N, H. KAUHANEN, P.V. 24. MujiKA, L, T. Bosso, L. LACOSTE, F . BARALK, A. GEYSSANT,
KOMI, AND J.R. LACOUR. Hormonal adaptations and modeled AND J.C. CHATARF), Modeled responses to training and taper in
responses in elite weight-lifLers during 6 weeks of training. competitive swimmers. Med. Sci. Sports EUTC. 28(2):251-258.
Eur J. Appl. Phy.^iol. 64:381-386. 1992. 1996,
12. CALVERT, T.W., E.W. BANISTER, M.V. SAVAGE, AND T. BACH. A 25. NOBLE, B,J., ANH K.J. RORERTSON. Perceived Extortion. Cham-
systems mode! of the effects of training on physical perfor- paign, IL: Human Kinetics, 1996.
mance. IEEE Tranfiadionti on Svslerii.s, Man. and Cybernetics. 26. SUZUKI, K., A. MAEDA, AND Y. TAKAHASHI. Attempt of monot-
6:94-102, 1976. ony analysis to a result of the boat race as.sociated with the
13. DKE-SSENHOREEK, R.H., C.E, WAIIA, AND J . H . SCAEE, JR. In- training program for the Japanese rower. J. Hum. Info. 9:39-
creased morning heart rate in runners: A valid sign of over- 48. 2003,
training? P/i.y,s. Sportsmed. I3(8):77-86. 1985. 27. Si.-zuKi, S,, T. SATO, AND Y. TAKAHASHI. A typical example of
14. FITZ-CLAKKE, J.R., R.H. MORTON, AND E.W. BANISTER. Opti- modeling human performance in 5000 m running time. Can. J.
mizing athletic performance hy influence curves, J. Appl. Phy- Appl. Physiol. 27lSuppl.):47-48, 2002.
siol. 71(31:1151-1158, 1991. 28. SUZUKI, S., T. SATO, AND Y. TAKAHASHL The effects of total
15. FOSTER, C. Monitoring training in athletes with reference to training volume on 5,000 m running time. Hiro Kyuyo. 18(1):
overtraining syndrome. Med. Sci. Sports Exerc. 30:1164-1168. 31-42. 2002,
1997. 29. SUZUKI, S., T, SATO, AND Y. TAKAHASHI. Diagnosis of training
16. Fos-!'ER, C. AND M. LEHMAN. Overtraining syndrome. In: Run- program for a Japanese rower by using the index of monotony.
ning Injuries, G.N. Guten, ed. Philadelphia: W.B. Saunders. Can. ,). Appl Physiol. 28lSuppl.1:105-106. 2003,
1996. pp. 173-188. 30. SUZUKI, S., T. SATO, AND Y, TAKAHAKHI. Estimation of a train-
17. FRY, R.W., A,R. MORTON, AND D. KEAST. Periodisation of train- ing program for one Japanese rower hy using tbe index of mo-
ing stress—A review. Can. J. Sport Sci. 17(3):234-240. 1992. notony and the mathematical model. Hiro Kyuyo. 19(l):75-84.
18. FRY, R.W., A,R. MORTON, AND D. KEAST. Periodisation and the 2003.
prevention of overtraining. Can. J. Sport Sci. 17(3):241-248. 31. THAYER, R. A systematic approach to training an athlete.
1992. Coaching Rev. 17:29-33. 1980.
19. LEHMAN, M., C. FOSTER, AND J, KEUL. Overtraining in endur-
ance athletes: A hrief review. Med. Sci. Sports Exerc. 25:854- Address correspondence to Shozo Suzuki, sz-suzuki@scn,
862. 1993. ac.jp.