

Recommandé
Contenu connexe
Tendances
Tendances (20)
Similaire à Remote sensing 311
Similaire à Remote sensing 311 (20)
Plus de Hafez Ahmad
Plus de Hafez Ahmad (20)
Dernier
Dernier (20)
Remote sensing 311
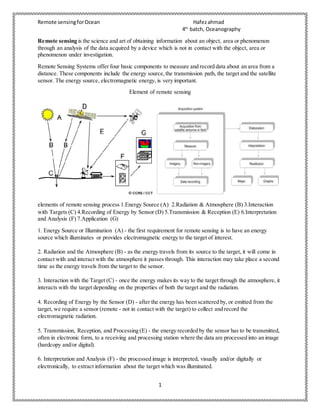
- 1. Remote sensingforOcean Hafezahmad 4th batch, Oceanography 1 Remote sensing is the science and art of obtaining information about an object, area or phenomenon through an analysis of the data acquired by a device which is not in contact with the object, area or phenomenon under investigation. Remote Sensing Systems offer four basic components to measure and record data about an area from a distance. These components include the energy source,the transmission path, the target and the satellite sensor. The energy source, electromagnetic energy, is very important. Element of remote sensing elements of remote sensing process 1.Energy Source (A) 2.Radiation & Atmosphere (B) 3.Interaction with Targets (C) 4.Recording of Energy by Sensor (D) 5.Transmission & Reception (E) 6.Interpretation and Analysis (F) 7.Application (G) 1. Energy Source or Illumination (A) - the first requirement for remote sensing is to have an energy source which illuminates or provides electromagnetic energy to the target of interest. 2. Radiation and the Atmosphere (B) - as the energy travels from its source to the target, it will come in contact with and interact with the atmosphere it passes through. This interaction may take place a second time as the energy travels from the target to the sensor. 3. Interaction with the Target (C) - once the energy makes its way to the target through the atmosphere, it interacts with the target depending on the properties of both the target and the radiation. 4. Recording of Energy by the Sensor (D) - after the energy has been scattered by, or emitted from the target, we require a sensor (remote - not in contact with the target) to collect and record the electromagnetic radiation. 5. Transmission, Reception, and Processing (E) - the energy recorded by the sensor has to be transmitted, often in electronic form, to a receiving and processing station where the data are processed into an image (hardcopy and/or digital). 6. Interpretation and Analysis (F) - the processed image is interpreted, visually and/or digitally or electronically, to extract information about the target which was illuminated.
- 2. Remote sensingforOcean Hafezahmad 4th batch, Oceanography 2 7. Application (G) - the final element of the remote sensing process is achieved when we apply the information we have been able to extract from the imagery about the target in order to better understand it, reveal some new information, or assist in solving a particular problem. Land Use/Land Cover data refers to data that is a result of classifying raw satellite data into "land use and land cover" (lulc) categories based on the return value of the satellite image. Training area : the areas are selected from the examined area and mapped in a site exploration. The exemplary regions for each class will be defined (for example land use classes such as coniferous forest, water areas,etc.) and will be made available as a reference for the classifier. Energy source in remote sensing: 1: Passive Remote Sensing depends on a natural source to provide energy. The sun is the most commonly used source of energy for passive remote sensing. 2: Active Remote Sensing uses an artificial source for energy. For example the satellite itself can send a pulse of energy which can interact with the target. In active remote sensing, humans can control the nature (wavelength, power, duration) of the source energy. Remote sensing in the microwave region of the electromagnetic spectrum (radar remote sensing) is an example of active remote sensing. Active remote sensing can be carried out during day and night and in all weather conditions. Data collection techniques in remote sensing Remote sensing utilizes satellite and/or airborne based sensors to collect information about a given object or area. Remote sensing data collection methods can be passive or active. Passive sensors (e.g.,spectral imagers) detect natural radiation that is emitted or reflected by the object or area being observed. Maps that can be created via passive remote sensing methods are geologic maps, mineral maps, thermal maps, and surface water maps Passive techniques : Geodetic Survey , HyperspectralImaging , Multispectral Imaging ,Near Infrared Surveys ,Oblique Aerial & Ground Visible Band & Thermographic Imaging, Radiometrics, SWIR, Stereo Satellite Imagery In active remote sensing (e.g.,radar) energy is emitted and the resultant signal that is reflected back is measured. Radar and LiDAR are the most commonly used active remote sensing techniques. Light Detection and Ranging (LiDAR) is an active remote sensing technology that uses optical measurements ofscattered light to find range (Young, 2006). Measurements can be made from aircraft- or land-based sensors. LiDAR data has been used in geothermal exploration in the creation of high-resolution Digital Elevation Models DEMs,in delineating faults, detecting and quantifying fault kinematics and in the development oflineament maps. Radar is an active-sensor remote sensing tool used to detect small changes in ground movement at geothermal locations. Radar methods have become a useful tool for geothermal reservoir monitoring and exploration. Remote sensing Raster Vector
- 3. Remote sensingforOcean Hafezahmad 4th batch, Oceanography 3 Primary Digital remote sensing images from SPOT and IKONOS ,Landsat satellites and aerial photograph Digital aerial photographs, GPS measurement Survey measurement Secondary Scanned map Dem from maps Topography survey Digitizing from map GIS: Geographic information system (GIS) is a system designed to capture,store, manipulate, analyze, manage, and present spatial or geographic data. Components /Parts of GIS: A GIS has five components that make it effective. 1. Hardware consists of the technical equipment needed to run a GIS efficiently. It includes computer/s (standalone / networked) with good configuration – good processing capability to run the GIS software,enough hard disk space to store large spatial data, and input and output devices such as scanners,printers, etc. 2. GIS software helps to store, analyze, and display geographic information in the form of maps and reports. It provides t a Graphical User Interface (GUI) for easy display and access to tools for input, visualizing, processing, editing, analyzing and querying geographic data. Data is accessed and managed through Data Base Management System (DBMS). Few GIS software list: ArcGis, ArcView 3.2, QGIS, SAGA GIS. 3. The most important and expensive component of the Geographic Information System is Data which is generally known as fuel for GIS. GIS data is combination of graphic and tabular data. Graphic can be vector or raster. 4. The methods are the procedure followed to answer the question need to be resolved. Method in GIS includes how the data will be accessed,stored,managed, processed,analyzed, and finally presented as output for particular application. 5. People in GIS are technical persons (GIS managers,database administrators, specialists, analysts, and programmers) who design and maintain the GIS work and those who use it. People in GIS can be categorized into: general users – who use GIS for business, services, and making decisions such as planners, scientists, engineers, etc. GIS specialists: who are the backbone of GIS. GIS related technologies:
- 4. Remote sensingforOcean Hafezahmad 4th batch, Oceanography 4 1 .remote sensing, the Global Positioning System (GPS): Remote sensing is the art and science of making measurements of the earth using sensors such as cameras carried on airplanes, GPS receivers, or other devices. These sensors collect data in the form of images and provide specialized capabilities for manipulating, analyzing, and visualizing those images 2: computer-aided design (CAD) :CAD systems evolved to create designs and plans of buildings and infrastructure. 3. Database management systems (DBMS):specialize in the storage and management of all types of data including geographic data. DBMSs are optimized to store and retrieve data and many GISs rely on them for this purpose. 4. spatio-temporal statistics: Spatiotemporal models arise when data are collected across time as well as space and has at least one spatial and one temporal property. An event in a spatiotemporal dataset describes a spatial and temporal phenomenon that exists at a certain time t and location x. Some other are computational geometry, computer graphics, digital image processing. GIS offers more than maps, and the following list includes other outputs AND usefulness: 1. Maps: Everyone recognizes this most common output from a GIS. 2. Cartograms: These special maps that distort geographic features based on their output values rather than their size. 3. Charts: GIS can produce pie charts,histograms (bar charts), line charts, and even pictures in addition to maps. 4. Directions: Another common output, directions show you how to get from one place to another. 5. Customer lists: Business GIS applications often produce customer lists, sometimes with printed mailing labels. 5.3D diagrams and movies: These forms of GIS output help you see the results of your work realistically and dramatically. Applications of GIS in Coastal zone The ability of a geographic information system (GIS) to integrate physical, ecological, socioeconomic, and hazardous information makes it an ideal assessment toolto support management efforts in the coastalzone. Through the use of GIS, researchers are able to model vulnerability to sea-level rise, coastal erosion, and other hazards so that decision makers have the necessary tools to protect communities and effectively manage coastal resources. 1: GIS has The ability to handle much larger databases 2: GIS encourages the development and use of standards for coastaldata. 3: GIS has been used to assist in the development of new or improved infrastructure including development of new shore-based facilities such as marinas, and the management of recreation activities in the areas of fragile coastal dune systems. 4: In the fishing and aquaculture industries, GIS may be used to find optimal locations for fish-farms, through the analysis of salinity, bathymetry, shelter, land uses,proximity to other facilities, etc. 5: GIS is also a major technology within the mining and oil exploration industries, where it is harnessed to assist in the discovery, assessment and exploration of new mineral wealth
- 5. Remote sensingforOcean Hafezahmad 4th batch, Oceanography 5 6: GIS helps to measure Sea level rise, make Sea-floor mapping, which can help for nautical directions 7: Analysis of erosion and shoreline changes • Assessment of potential and actualflood hazard and damage • Monitoring the changes of land use in the coastallands, in particular the growing urbanization of the coastalareas • Monitoring the behavior of oil spillages in coastalenvironments Integration of remote sensing and GIS The volume of Remote Sensing is so large, its associated powerful image processing technology is used to manage geo-information with preprocessing analysis, accuracy assessment and information distribution. GIS are more and more being used for the storage and analysis of geo- referenced data and also it handles the linkages between spatial entities and their discrete attributes. GIS system have become accepted as a standard way of handling geographic data and performing analysis on those data for a number of earth related disciplines. GIS when combine with upto date remote sensing data could assist in the automated interpretation. change detection and map revision processes. Image Image: A representation or description of a scene,typically produced by an optical or electronic device, such as a camera or a scanning radiometer. Pixel: The smallest unit of information in an image or raster map, usually square or rectangular. Pixel is often used synonymously with cell. A pixel is represented in a remotely sensed image as a cell in an array of data values.
- 6. Remote sensingforOcean Hafezahmad 4th batch, Oceanography 6 Resolution refers to the number of pixels in an image. Resolution is sometimes identified by the width and height of the image as well as the total number of pixels in the image. For example, an image that is 2048 pixels wide and 1536 pixels high (2048X1536) contains (multiply) 3,145,728 pixels (or 3.1 Megapixels. Spectral resolution: It is the width of the spectralband and the number of spectral bands in which the image is taken. Narrow band widths in certain regions of the electromagnetic spectrum allow us to discriminate between the various features more easily. Radiometric resolution: It is the capability to differentiate the spectralreflectance / emittance between various targets. This depends on the number of quantisation levels within the spectralband. Temporal resolution : Temporal resolution (TR) refers to the precision of a measurement with respect to time. Pixel resolution – refers to the pixel count in a digital image. Difference between Pixel and resolution Pixel Resolution 1 A pixel is a unit of information displayed on a monitor. Resolution is determined by the size of the unit of information representing an image. 2 Pixelscollectivelycreate image. Resolutiondescribesthe crispnessand detail of an image. 3 Increase the numberof pixels,the imagesize will increase. Increase the pixel resolution,the qualityof image will increase. 4 Bitsper pixels (bpp). Resolution can be measured in 3 ways: Sample per inch (spi, scanners) Pixel per inch (ppi, monitors) Dots per inch (dpi, printers) 5 The resolution of digital images can be described in many ways including pixel resolution, spatial resolution, spectral resolution, temporal resolution and radiometric resolution.
- 7. Remote sensingforOcean Hafezahmad 4th batch, Oceanography 7 GIS data 1: spatial data : Also known as geospatial data or geographic information it is the data or information that identifies the geographic location of features and boundaries on Earth, such as natural or constructed features,oceans,and more. Spatial data is usually stored as coordinates and topology, and is data that can be mapped. A: point : Point data is most commonly used to represent nonadjacent features and to represent discrete data points. Points have zero dimensions. Examples would be schools, points of interest, and in the example below, bridge and culvert locations. B: line : Line (or arc) data is used to represent linear features. Common examples would be rivers, trails, and streets. Line features only have one dimension and therefore can only be used to measure length. Line features have a starting and ending point. C: polygon: Polygons are used to represent areas such as the boundary of a city (on a large scale map), lake, or forest. Polygon features are two dimensional and therefore can be used to measure the area and perimeter of a geographic feature. D: raster : Raster data is cell-based and this data category also includes aerial and satellite imagery. There are two types of raster data:continuous and discrete. An example of discrete raster data is population density. Continuous data examples are temperature and elevation measurements. There are also three types of raster datasets:thematic data, spectraldata, and pictures (imagery). 2: attribute data : Attribute data is information appended in tabular format to spatial features. Attribute data can be store as one of five different field types in a table or database:character,integer, floating, date, and BLOB. GIS data source 1: analog map 2: aerial photographs 3: satellite image 4: ground survey with GPS 5 : report and publication 6: web sources :Natural earth data , USGS Earth explorer , openstreetmap, FAO GeoNetwork , NASA Earth observations , UNEP Environment Data explorer etc. 7. LIDAR and RADAR A thematic map is a map that emphasizes a particular theme or special topic such as the average distribution of rainfall in an area. A thematic map shows the spatial distribution of one or more specific data themes for selected geographic areas. The map may be qualitative in nature (e.g., predominant farm types) or quantitative (e.g., percentage population change).
- 8. Remote sensingforOcean Hafezahmad 4th batch, Oceanography 8 Characteristics of Landsat, row and path of Landsat satellite Land” mean earth and “Sat” means satellite So, Landsat means earth satellite or earth observing satellite. Landsat was designed in 1960s by the combined effort of NASA and US. Launched in 1972 specifically for broad scale observation of the Earth’s Land areas. Six satellite have beenlaunched successfully, namely Landsat-1 to -5 and Landsat-7, landsat-8. Landsat-6suffereda launch failure. Five different types of sensor used namely RBV,MSS, TM, ETM and ETM+. Characteristics of Landsat: 1. sun synchronous 2. Orbit cycle is 99 degree 3. Altitude 919 m 4. cross the equator at a time 9.30 to 10. Am 5. 14 orbits per day Row and path of Landsat satellite: The Worldwide Reference System (WRS) is a global notation system for Landsat data. It enables a user to inquire about satellite imagery over any portion of the world by specifying a nominal scene center designated by PATH and ROW numbers. Landsat 8 and Landsat 7 fo
- 9. Remote sensingforOcean Hafezahmad 4th batch, Oceanography 9
- 10. Remote sensingforOcean Hafezahmad 4th batch, Oceanography 10 llow the WRS-2, as did Landsat 5 and Landsat 4. Landsat 1, Landsat 2, and Landsat 3 followed WRS-1. 6: A map is a visual representation of an entire area or a part of an area,typically represented on a flat surface.Maps attempt to represent various things, like political boundaries, physical features,roads, topography, population, climates, natural resources and economic activities. The study and practice of the many facets of maps and map making is called Cartography. It can be described as the art and science of map making. A globe is a three dimensional representation of the earth that does not distort the shape or size of earth's geographical features. A map projection is one of many methods used to represent the 3-dimensional surface of the earth or other round body on a 2-dimensional plane. Projection Types 1. Cylindrical Projection 2. Conical Projection. 3. Planer Projection/ azimuthal
- 11. Remote sensingforOcean Hafezahmad 4th batch, Oceanography 11 Properties of map Properties or a map are area shape direction distance scale Types of map: There are many kinds of maps; static, two-dimensional, three-dimensional, dynamic and even interactive. 1. Topographic map 2. Thematic map 3. Geologic map 4. Resource map 5. Biogeographic map 6. Environmental map 7. Meteorological map Map scale : Map scale refers to the relationship (or ratio) between distance on a map and the corresponding distance on the ground. For example, on a 1:100000 scale map, 1cm on the map equals 1km on the ground. Vector and raster model A representation of the world using points, lines, and polygons. Vector models are useful for storing data that has discrete boundaries, such as country borders, land parcels, and streets. A representation of the world as a surface divided into a regular grid of cells. Raster models are useful for storing data that varies continuously, as in an aerial photograph, a satellite image, a surface of chemical concentrations, or an elevation surface. Point: A location depicted by a single set of (x, y) coordinates at the scale of abstraction. Points represent discrete locations on the ground.
- 12. Remote sensingforOcean Hafezahmad 4th batch, Oceanography 12 Lines are used to represent the shape and location of geographic objects, such as street. Lines are also used to represent features that have length but no area,such as contour lines and boundaries. A line is formed by connecting two data points. a closed shape defined by a connected sequence of x,y coordinate pairs, where the first and last coordinate pair are the same and all other pairs are unique. Vector model and raster model Raster model Vector model Advantages 1 Simple data structure Smaller file size 2 Easy and efficient overlaying Individual identity for discrete objects like line , polygon etc. 3 Compatible with remote sensing imagery Efficient projection transformation and topological relationship 4 High spatial variability is efficiently represented Accurate map output 5 Efficient to represent continuous data Easy to edit disadvantages 1 Large file Complex data structure 2 Difficult to edit Not appropriate to represent continuous data 3 No identity for discrete objects other than points /pixels Difficult overlay operations 4 Inefficient projection transformation and difficult to build topological relationship Not compatible with remote sensing imagery Elements of Visual Interpretation Identifying targets –Based on how they reflect/emit radiation Based on; –Visual elements – tone, shape,pattern, texture, shadow, association. Tone refers to the relative brightness or colour of objects in an image. Generally, tone is the fundamental element for distinguishing between different targets or features. Variations in tone also allows the elements of shape,texture, and pattern of objects to be distinguished.
- 13. Remote sensingforOcean Hafezahmad 4th batch, Oceanography 13 Texture refers to the arrangement and frequency of tonal variation in particular areas of an image. Rough textures would consist of a mottled tone where the grey levels change abruptly in a small area,whereas smooth textures would have very little tonal variation Shape refers to the general form, structure, or outline of individual objects. Shape can be a very distinctive clue for interpretation. Straight edge shapes typically represent urban or agricultural (field) targets,while natural features,such as forest edges, are generally more irregular in shape. Size of objects in an image is a function of scale. It is important to assess the size of a target relative to other objects in a scene,as well as the absolute size, to aid in the interpretation of that target. Pattern refers to the spatial arrangement of visibly discernible objects. Typically an orderly repetition of similar tones and textures will produce a distinctive and ultimately recognizable pattern. Digital Image Processing Common image processing image analysis functions: A. Preprocessing B. Image Enhancement C. Image Transformation D. Image Classification and Analysis 1: Pre-Processing (Image Rectification) Initial processing of raw data prior for analysis Correct for distortion due to characteristics of imaging system & imaging conditions. 2: Pre-Processing (Image Rectification) Procedures include: a. geometric correction - correct for geometric distortion due to Earth's rotation, curvature, platform motion, relief displacement, (such as oblique viewing). b. radiometric correction - correct for uneven sensor response over image, random noise, atmosphere. c. geo-referencing - ground control points (GCP's) used to register image to a precise map. 3: Image Enhancement Solely to improve appearance of imagery. Increasing visual distinction Un- enhanced images usually appear very dark - little contrast - difficult to visually interpret. Various procedures applied to image data in order to more effectively display data for visual interpretation. 4: Image transformations typically involve the manipulation of multiple bands of data, whether from a single multispectral image or from two or more images of the same area acquired at different times. Basic image transformations apply simple arithmetic operations to the image data. Image subtraction is often used to identify changes. Image classification and steps of image classification ,types of image classification Image classification Image classification is the process of assigning land cover classes to pixels. Normally, multispectral data are used to perform the classification of the spectral pattern present within the data for each pixel is used as the numerical basis for categorization. Depending on the interaction between the analyst and the computer during classification, there are two types of classification: 1. Supervised classification: Supervised classification uses the spectral signatures obtained from training samples to classify an image. 2. Unsupervised classification: Unsupervised classification finds spectral classes (or clusters) in a multiband image without the analyst’s intervention.
- 14. Remote sensingforOcean Hafezahmad 4th batch, Oceanography 14 Object-Based Nearest Neighbor Classification Steps: Perform multiresolution segmentation:-Select training areas:- Define statistics:- and Classify 7: Applications of remote sensing in Oceanography: many dynamics , features and facts can be mapped , monitored, observed and detected by using remote sensing technologies. Such as 1. Ocean pattern identification a. Current , regional circulation pattern and shears. b. Frontal zone , internal wave , gravity wave ,eddies , upwelling , shallow water bathymetry 2. Storm forecasting a. Wind and wave retrieval b. Fish stock and marine mammal assessment c. Water quality (temperature , color ,pollution) d. Ocean productivity , phytoplankton concentration and drift . 3. Oil spill a. Mapping and predicting oil spill extend and drift b. Strategic support for oil spill emergency response decisions c. Identification of natural oil seepage areas for esploration 4. Shipping a. Navigation routing b. Traffic density studies c. Operational fisheries surveillance d. Near shore bathymetry
- 15. Remote sensingforOcean Hafezahmad 4th batch, Oceanography 15 5. Inter tidal zone a. Tidal and storm effects b. Delineation of land /water interface c. Mapping shoreline and beach dynamics d. Coastal vegetation e. Human activity /impact f. Coastal erosion g. Loss of habitat Applications of remote sensing fisheries oceanography To exploit fisheries resources more effectively, fishermen must catch the most fish possible at the same time, minimizing costs and optimizing the scheduling of their operations. Remote observations of the sea surface can provide a significant part of the information needed to assess and improve the potential yield of the fishing grounds. Remote sensing techniques can be utilized directly, indirectly or as generalaids in the detection and assessment of fishery resources. Applications ofRemote Sensing in fisheries : 1) Remote sensing data help in regular management of water resources,ecosystem-based fisheries management, fisheries models, 2) Remote sensing techniques are useful in finding different types of bioresources. 3) Remote sensing plays potential role in research on the effects of climate on fisheries, and Management of coastal zones and fisheries. 4) For detection and monitoring of the water pollution, remote sensing prove useful. 5) Remote sensing is applicable in acquiring information regarding offshore engineering activities, fisheries surveillance, ocean features,coastalregions and storm forecast operations. 6) Remotely sensed data provides the necessary spatial data on suspended sediments, dissolved organic matter, phytoplankton, algal blooms & oil slicks etc which will useful in management of fish stocks, monitor the water quality & natural water pollution such as oil or algal blooms, which are harmful to aquatic life. 7) Remote sensing techniques are giving necessary data needed for monitoring changes on coastal erosion, shoreline monitoring & management, loss of natural habitat, sea level rise, wetland mapping urbanization, sewage disposal and aquatic population etc. 8) Remote sensing is very useful in identifying Potential Fishing Zones (PFZ). This data is very useful for fishermen because they came to know likely occurrence of fish shoals which helps them for getting more catch. 9) Continuous monitoring of land use or land cover with remote sensing imageries have been of immense use in providing information on temporal & spatial changes in area under aquaculture, mangrove areas,coral reef mapping & other land use patterns. 10: Direct Methods of Fish Detection: The most direct and simple method of remote sensing in fisheries is visual fish spotting 11: Indirect Methods of Fishery Assessment:-Estimation of a fishery resource can be assisted by the measurement of parameters which affect its distribution and abundance.
- 16. Remote sensingforOcean Hafezahmad 4th batch, Oceanography 16 Applications ofGIS in Fisheries : ¯ Identification of suitable sites for freshwater & brackishwater aquaculture. ¯ Management of marine fisheries & coastal regulation zone. ¯ Study of land-use pattern including mangroves & forest cover of a particular area. ¯ Planning for water body resource zonation & mapping of aquatic species. ¯ Fish disease modeling & management. ¯ Study of temporal/spatial changes in fish production & consumption. ¯ Environmental Impact Assessment. ¯ Distribution of different fish species in relation to physical habitat characteristics. ¯ Study of spatial variations in demand / supply balance. Digital elevation model Digital Elevation Model (DEM) is the digital model or 3D representation of the terrain surface, created from terrain elevation data with respect to any reference datum. There are three similar names as digital elevation model (DEM), digital terrain model (DTM) and digital surface model (DSM). DEM is a subset of the DTM, which also represents Other morphological elements. A DEM can be represented as a raster (a grid of squares when representing elevation) or as a vector-based triangular irregular network (TIN). DEM is frequently used to refer to any digital representation of a topographic surface. DEM is the simplest form of digital representation of topography .DEMs are used to determine terrain attributes such as elevation at any point, slope and aspect. Terrain features like drainage basins and channel networks can also be identified from the DEMs. DEMs are widely used in hydrologic and geologic analyses, hazard monitoring, natural resources exploration, agricultural management etc. Common uses of DEMs :Extracting terrain parameters. Modeling water flow or mass movement (for example, landslides). Creation of relief maps. Rendering of 3D visualizations Creation of physical models (including raised-relief maps). Rectification of aerial photography or satellite imagery. Ocean observation satellites Satellites that detect and observe different characteristics and features of the Earth's atmosphere, lands, and oceansare often referredto asenvironmental satellites. Most environmental satellites have one of two types of orbits: geosynchronous or sun-synchronous. Geo-synchronous satellites orbit the Earth at a speed
- 17. Remote sensingforOcean Hafezahmad 4th batch, Oceanography 17 matching the Earth's rotation. Geo-synchronous environmental satellites are used primarily for weather forecasting. Satellites can tell us about ocean bathymetry, sea surface temperature,ocean color,coral reefs,and sea and lake ice. SeaWiFS (Sea-viewing Wide-Field-of View Sensor) ,IKONOS,cartosat 2, Marine Observation Satellite (MOS-1), insat 3D, resorcesat , aqua modis , insat-3DR,AQUARIUS , QUCIKBIRD, Nimbus-7 satellite Row refers to the latitudinal center line of a frame of imagery. As the satellite moves along its path, IKONOS is a commercial Earth observation satellite, and was the first to collect publicly available high- resolution imagery at 1- and 4-meter resolution. It collected multispectral and panchromatic imagery. Its capabilities include capturing a 3.2m multispectral, Near-Infrared (NIR)/0.82mpanchromatic resolution at nadir. Its applications include both urban and rural mapping of natural resources and of natural disasters, tax mapping, agriculture and forestry analysis, mining, engineering, construction, and change detection. Geographic vs spatial Spatial data refers the geographic location of features and boundaries on Earth, such as natural or constructed features, oceans, and more. Spatial data is usually stored as coordinates and topology, and is data that can be mapped. So Spatial Data is a mixture of Geometrical data and Geographical data. Geographic data is simply a collection of information that can describe objects and things with relation to space (Here space standsforposition). Oftenthis is done with x,y coordinates or longitudes and latitudes.So Geographical Data is simply Longitude and Latitude.
- 18. Remote sensingforOcean Hafezahmad 4th batch, Oceanography 18 GPS(Global Positioning System) GPS: The Global Positioning System (GPS) is a satellite-based navigation system made up of at least 24 satellites. GPS The system is divided into:a. The spatial segment: is formed by 24 satellites in near circular orbit around the Earth at a height of about 20,200 kms.T he satellites have the followings functions: • To transmit information to users through a radio signal; • To maintain an accurate reference time due to the high degree of accuracy (from 10-12 to 10-14 sec) of the caesium and rubidium atomic clocks on board; • To receive and to store information from the control segment; • To make corrections to orbits. b. Control segment: comprises 5 monitoring stations and an additional sixth at Sunnyvale, USA. To continuously track the satellites and to process the received data for the calculation of the timing-space position (Ephemeris);• To check the general state of the system, in particular the satellite clocks; • To implement orbit corrections;• To upload new data to the satellites. c. The user segment: is made up of users equipped with receivers with GPS antennas. These are passive systems in that they are able to acquire data without emitting some signal. Multiple band image : A multi-spectral image is a collection of several monochrome images of the same scene,each of them taken with a different sensor. Each image is referred to as a band. A well known multi- spectral(or multi-band image) is a RGB color image, consisting of a red,a green and a blue image, each of them taken with a sensor sensitive to a different wavelength. In image processing, multi-spectral images are most commonly used for Remote Sensing applications. Satellites usually take several images from frequency bands in the visual and non-visual range. Landsat 5, for example, produces 7 band images with the wavelength of the bands being between 450 and 1250 nm.