Power sector in india
•Télécharger en tant que PPTX, PDF•
4 j'aime•3,258 vues

Power Sector in India

Recommandé
Contenu connexe
Tendances
Tendances (20)
En vedette
En vedette (20)
Similaire à Power sector in india
Similaire à Power sector in india (20)
Plus de Harshit Garg
Plus de Harshit Garg (8)
Dernier
Dernier (20)
Power sector in india
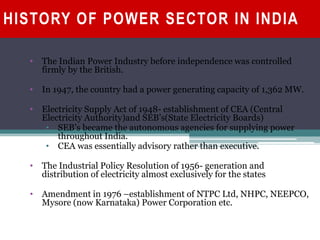
- 2. HISTORY OF POWER SECTOR IN INDIA • The Indian Power Industry before independence was controlled firmly by the British. • In 1947, the country had a power generating capacity of 1,362 MW. • Electricity Supply Act of 1948- establishment of CEA (Central Electricity Authority)and SEB’s(State Electricity Boards) • SEB’s became the autonomous agencies for supplying power throughout India. • CEA was essentially advisory rather than executive. • The Industrial Policy Resolution of 1956- generation and distribution of electricity almost exclusively for the states • Amendment in 1976 –establishment of NTPC Ltd, NHPC, NEEPCO, Mysore (now Karnataka) Power Corporation etc.
- 3. HISTORY OF POWER SECTOR IN INDIA • Until 1991, power sector in the states was managed by one large entity that generated, transmitted and distributed power, under the respective State Ministries of Power. • Liberalisation of 1991-privatization of Orissa power utility. • The paradigm shift-Electricity act, 2003 • • • • SEBs will no longer exist in the existing form. mandates licensee-free thermal generation. non-discriminatory open access of the transmission system. gradual implementation of open access in the distribution system .
- 4. The first demonstration of electric light in Calcutta was conducted on 24 July 1879 by P W Fleury & Co. Mumbai saw electric lighting demonstration for the first time in 1882 at Crawford Market. The first hydroelectric installation in India was installed near a tea estate at Sidrapong for the Darjeeling Municipality in 1897. The first electric train ran between Bombay's Victoria Terminus and Kurla along the Harbour Line, in 1925.
- 5. Current Status • 5th largest producer • Fourth largest consumer of electricity after USA, China and Russia. This accounts for 3.4 per cent of the global energy consumption • Still, 33% of rural and 6% of urban India is out of access to electricity • Transmission network & Capacity • 98,367 circuit Km’s of transmission lines at 800/765kV, 400kV, 220kV and 132kV and +500kV levels • 160 sub-stations • Transformation capacity is about 1,57,158 MVA as on January 31, 2013 • As per the current stats, the International Energy Agency estimates India needs an investment of at least $135 billion to provide universal access of electricity to its population.
- 6. India’s Installed Generation Capacity 10.24 225.13 GW as on May 31, 2013. Coal Gas DSLs 19.8 Nuclear fuel 57.30 3.1 0.6 8.96 Hydro Renewable Energy Sources
- 8. Demand vs. Availability •Growth in energy demand has consistently outpaced growth in supply
- 9. Power Generated – How does it flow? Where does it go? Generating Station 100 units Transmission System – 4% losses 96 units Unavoidable Distribution Losses - 15% 82 units Pilferage -35% losses 29 units Billed to consumer – 53 units 20% loss Energy usefully consumed – 42 units (max.)
- 10. Problems • Shortage of coal and gas • Skilled manpower for construction and commissioning of projects. • Land acquisition and Rehabilitation. • Environmental and Forest Concerns. • Inter-state and Contractual issues • Geological Surprises • Pilferage
- 11. Possible Solutions • • • • • Accelerate captive mine development Use of renewable sources. Strengthen governance to drive implementation. Building infrastructure. Improve monitoring mechanisms.
- 12. Rural Electrification Rajiv Gandhi Grameen Vidyutikaran Yojana (RGGVY) • Aims at… ▫Electrifying all villages and habitations. ▫Providing access to electricity to all rural households. ▫Giving Electricity Connection to Below Poverty Line (BPL) families free of charge. • Main Features ▫All ongoing schemes merged in “Rajiv Gandhi Grameen Vidyutikaran Yojana” (RGGVY) ▫90% grant and 10% loan ▫Electrification as per new definition
- 13. Implementing Agencies NPSU:- NTPC, PGCIL, NHPCL, DVC State electricity board State government power department. Co-operative society and NGO’s
- 14. Rajiv Gandhi Grameen Vidhyutikaran Yojana (RGGVY) Project Outlay and Coverage (All India) Projects No. of Projects Unelectrified Villages Intensive Electrification of Villages BPL HH covered Outlay in Rs. Cr. (Sanctioned cost) Approved under 10th Plan 235 68763 111936 83.10 Lakh 9733 Approved under 11th Plan 338 49736 243031 163.35 Lakh 16620 Total 573 118499 354967 246.45 Lakh 26353
- 16. THE COAL SCAM A STUDY!! THE SCAM WHAT IT IS! COMPARIS ON OF SCALE • 1.87 lakh Crore Rupees THE • Biggest scam in India by now GAINER S • Report authenticated by Comptroller THE and Auditor General of India ESTIMATE PROCES S THE PEOPLE RESPONSIBL E
- 17. What is the coal scam? A question many of you would have. WHAT IT IS! Simply put it is a corruption scandal where-in the Comptroller and Auditor General of India (CAG) office has accused the Government of India for providing the nation's coal deposits to private and state-run entities in an irregular and arbitrary manner instead of publicly auctioning them off to the highest bidder (as is usually done for such entities), resulting in a loss of approximately 186,000 crore (US$33.67 billion) to the exchequer during the period 2004-2009.
- 18. To g e t a n i d e a o f i t s s c a l e l e t ’ s s e e w h a t this money could have bought
- 19. Politics of Nuclear Power in India Ever heard of Wind or Solar Scientist Post?
- 20. Why is Nuclear Power Promoted in India • Current energy policies are designed to benefit foreign MNC’s like General electrics, Westing house etc. • Profit for MNC’s who will provide reactor design (Investment at Jaitpur plant is 1 lakh crore) • Commission for Indian Politicians, Intellectuals, Scientists etc. • Very less scope of investment in renewable energy • MNC’s of Nuclear power sector are too strong to let the Renewable energy sector grow.
- 22. Renewable Power Sources • SOLAR ENERGY – Solar radiation across 85% Country can be termed as good to excellent and hence majority of Country is ideal for use of Solar Energy. Growth in solar power by approximately 56 mw in 2011 to around 1060 mw of solar power in 2012. • WIND ENERGY - Fastest growing renewable energy source. Globally it grew at a rate of 27% per annum in last 10 years. Presently india is ranked 4th in terms of wind energy installed capacity.. • BIOMASS - crop residues, woods , and mustard oil are the major contributors to biomass energy. About 2% of power in india is generated by these resources. • TIDAL ENERGY- The tides are perfectly predictable, regular, and the India contains miles of coastline for energy exploitation.
- 23. Future of Energy Technology Flying Wind Farms • kite-like airborne turbines spinning at high altitudes sending power down via nano-tube cables to generate power • Wind has more power and velocity and is more consistently predictable. It generates about 8 – 27 times the power produced at ground level.
- 24. Future of Energy Technology Solar Wind Energy • The satellite launched to tap solar wind power, instead of working like a wind mill, where a blade attached to the turbine is physically rotated to generate electricity, would use charged copper wire for capturing electrons zooming away from the sun at several hundred kilometres per second. • Solar wind power will generate the amount of power that no one including the scientists working to find new means of generating power ever expected.
- 25. Pilferage • Pilferage (Power theft) in India is responsible for the disappearance of 29% of electricity generated. • In energy terms this amounts to 613.87 million units/day.
- 26. Thank You !
Notes de l'éditeur
- As the non renewables resources are estimated to perish in coming years. More focus shoud be laid on encouraging renewable resources, which includes wind , small hydro, biomass, and solar. India has witnessed an unprecedented growth in solar installations over past 1 year from showcasing approximately 56 mw in 2011 to around 1060 mw of solar power in 2012,.solar energy can be one of the best solutions to the energy crisis of india. Solar radiation across 85% Country can be termed as good to excellent and hence majority of Country is ideal for use of Solar Energy. As compared to this Wind Energy can only be used in around 30% of the Country
- crop residues, woods , and mustard oil are the major contributors to biomass energy. 2% of power in india is generated by these resourcesThe tides are perfectly predictable, regular, and the India contains miles of coastline for energy exploitation.
- . As power generated goes up because of higher wind resistance proportional to the cube of relative velocity, more power can be generated