Making Healthcare Waste Reduction and Patient Safety Actionable - HAS Session 6

Multiple studies have estimated that at least 30% of US healthcare expenditures are wasteful. But how do you identify and reduce that waste? In this session, we will share with you a three-part framework for understanding, measuring and addressing waste reduction. In particular, we will highlight the importance patient safety and injury prevention, framing the importance of shifting from a system of incident reporting (which creates a culture of blame and guilt) to a system in which patient injury is regarded as a process failure rather than a person failure. To make that transition, health systems will need to 1) define process flows and metrics for each major type of patient injury; and 2) create a learning environment in which team members are engaged in process redesign to prevent process failure and injury. A leading health system in patient safety and quality will also share their best practices in how they have created a culture of patient safety and quality.

Recommandé
Recommandé
Contenu connexe
Tendances
Tendances (20)
Similaire à Making Healthcare Waste Reduction and Patient Safety Actionable - HAS Session 6
Similaire à Making Healthcare Waste Reduction and Patient Safety Actionable - HAS Session 6 (20)
Plus de Health Catalyst
Plus de Health Catalyst (20)
Dernier
Dernier (20)
Making Healthcare Waste Reduction and Patient Safety Actionable - HAS Session 6
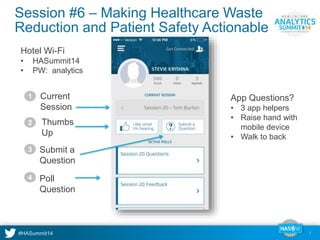
- 1. 1 Session #6 – Making Healthcare Waste Reduction and Patient Safety Actionable Hotel Wi-Fi • HASummit14 • PW: analytics Current Session Thumbs Up Submit a Question Poll Question 1 2 3 4 App Questions? • 3 app helpers • Raise hand with mobile device • Walk to back
- 2. Session #6 Making Healthcare Waste Reduction and Patient Safety Actionable Greg Stock CEO, Thibodaux Regional Medical Center Mr. Stock has served for over 20 years as CEO of Thibodaux Regional Medical Center in Louisiana. He holds bachelors and masters degrees from Brigham Young University. He has served as CEO in three different HCA hospitals and in Northwest Hospital System in Arkansas. His career has been characterized by success stories of financial turnarounds, programmatic growth and growth in relationships with key stakeholders. David A. Burton, MD Former Chairman and CEO, Health Catalyst, Former Senior Executive, Intermountain Healthcare Dr. David A. Burton is the former Executive Chairman and CEO of Health Catalyst, and currently serves as a Senior Vice President, future product strategy. Before his first retirement, Dr. Burton served in a variety of executive positions in his 23-year career at Intermountain Healthcare, including founding Intermountain’s managed care plans and serving as a Senior Vice President and member of the Executive Committee. He holds an MD from Columbia University, did residency training in internal medicine at Massachusetts General Hospital and was board certified in Emergency Medicine. 2
- 3. Poll Question #1 1) Which forms of waste do you feel have the greatest opportunity for cost savings in your organization? a) Ordering waste b) Workflow waste c) Defect waste d) Unsure or not applicable 3
- 4. Poll Question #2 2) How confident are you that your organization has a good ability to identify waste opportunities? a) Not at all confident b) Somewhat confident c) Moderately confident d) Confident e) Very confident f) Unsure or not applicable 4
- 5. Poll Question #3 3) How confident are you that your organization has the ability to achieve cost savings through waste reduction? a) Not at all confident b) Somewhat confident c) Moderately confident d) Confident e) Very confident f) Unsure or not applicable 5
- 6. The Anatomy of Healthcare Delivery Health Maintenance and Preventive Guidelines Home (Patient Portal) Clinic Care Non-recurrent Treatment and Monitoring Algorithms * To Invasive Care Processes Clinic Care Chronic Triage to Treatment Venue Implementation of protocols based on MD orders and clinical operations-initiated activities (Lean/TPS workflow focus) Clinical Ops Per Case Knowledge Admission Order Sets Admission Order Sets Acute Medical IP Med-Surg Acute Medical IP ICU Invasive Medical Invasive Surgical Diagnostic Work-up Bedside care Substance Preparation Invasive* Subspecialist Chronic Disease Subspecialist Screening & Preventive Symptoms Indications for Intervention Procedure Diagnostic algorithms Indications for Referral Triage Criteria Preventive, Diagnostic, Triage and Clinic Care, Algorithms; Referral & Intervention Indications (scientific flow) Population Utilization Knowledge Assets Treatment and Monitoring Algorithms Substance Selection Substance Selection Clinical Supply Chain Management Supplementary Order Sets Pre-Procedure Order Sets Post-procedure Order Sets Order sets and indications for selection of substances and clinical supplies (scientific-flow focus) MD Per Case Knowledge Assets Post-procedure Care Discharge Bedside care practice guidelines, risk assessment and patient injury prevention protocols, bedside care procedures, transfer and discharge protocols Standardized Follow-up Post-acute care order sets IP (SNF, IRF) Home health Hospice Clinical ops procedure guidelines and patient injury prevention Assets Care Process Models Value Stream Maps
- 7. Implementation of protocols based on MD orders and clinical operations-initiated activities (Lean/TPS workflow focus) Clinical Ops Per Case Knowledge Assets Clinical Ops Per Case Utilization Waste Workflow Per Case Waste Clinical ops per case management (individual patient focus) Sample Metrics Cost per case Nursing hours by unit OR minutes L&D minutes Cycle times Cost per ancillary test Environmental services Compliance with protocols for implementing care ordered Population Health Management Waste reduction construct Population Utilization Waste Per capita management (population focus) Sample Metrics Admits/1000 members IP days/1000 members OP visits/1000 members Procedures/1000 members ED visits/1000 members Readmissions/1000 members Compliance with value-based guidelines for diagnostic ordering, triage, referral and intervention Preventive, Diagnostic, Triage and Clinic Care, Algorithms; Referral & Intervention Indications Per Capita Waste Population Utilization Knowledge Assets MD Per Case Knowledge Assets MD Per Case Utilization Waste MD per case management (individual patient focus) Sample Metrics Cost/case Cost/procedure OR minutes L&D hours Other LOS Order sets, selection criteria (scientific-flow focus) Ordering Per Case Waste Compliance with standard order sets, pharmaceutical, blood product and supply chain utilization 7
- 8. Ordering Waste Workflow Waste Defect Waste Ordering tests, care, substances and supplies that do not add value Variation in efficiency of delivering tests, care and procedures ordered Patient injuries incurred in delivering tests, care and procedures ordered 8 Three forms of waste
- 9. THIBODAUX REGIONAL MEDICAL CENTER PURSUIT OF EXCELLENCE Greg Stock, CEO
- 10. From Vision to Reality Patient Centered Excellence
- 11. c c 11
- 12. “Triple Aim” Patient Experience Clinical Quality Improvement Cost-Effective Care
- 13. Sustaining a High Level: Patient Experience Statements Thibodau x Regional Terrebonn e General Ochsner Our Lady of Lake Clevelan d Clinic East Jefferson National Average Nurses "Always" communicated well 87% 83% 75% 83% 83% 81% 78% Doctors "Always" communicated well 89% 84% 79% 87% 82% 84% 81% Patients "Always" received help as soon as they wanted 72% 65% 56% 63% 68% 59% 67% Pain was "Always" well controlled 74% 73% 64% 75% 72% 72% 71% Staff "Always" explained meds before giving it to them 68% 66% 59% 66% 66% 62% 64% Room and bathroom were "Always" clean 79% 72% 60% 67% 78% 66% 73% Area around room was "Always" quiet at night 78% 63% 60% 69% 57% 64% 60% Patients reported YES, they were given information about their recovery at home 87% 85% 83% 87% 90% 84% 85% Hospital rating of 9 or 10 on a scale from 0 (lowest) to 10 (highest) 78% 69% 65% 75% 84% 73% 70% Patients reported YES, they would definitely recommend the hospital 83% 69% 70% 76% 87% 76% 71%
- 15. Clinical Quality Improvement 51% Decrease in HAI’s since 2009 Zero VAP’s in 2013 & 2014
- 16. Clinical Quality Improvement 58% below the national benchmark Patient acuity and severity of illness have increased steadily
- 18. Medicare Cost per Discharge (CMI ADJ) – 2013 4,370 5,600 6,119 6,535 6,341 4,837 4,886 6,033 5,028 7,000 6,500 6,000 5,500 5,000 4,500 4,000 3,500 3,000 2,500 2,000 Thibodaux Ochsner Our Lady of the Lake Teche Best Practice Cost of Care
- 19. No debt—Strong Cash Position 436 501 492 430 DAYS CASH ON HAND 48 172 500 400 300 200 100 0 FY 2011 FY 2012 FY 2013 FY 2014 LA AVG NAT. AVG
- 20. Good News “You are the low-cost provider”
- 21. Bad News “You are the low-cost provider”
- 22. Employee Engagement Results 93% 92% 97% 91% 91% 93% 120% 100% 80% 60% 40% 20% 0% 2001 2003 2005 2007 2009 2012
- 23. Productivity TGMC vs. TRMC FY 2013 Income Statements TGMC TRMC ( in 000's or Thousands ) Net Revenue ( including Bad Debt ) $ 177,753 $ 152,021 Expenses Salaries & Benefits $ 82,910 49.1% $ 66,319 43.6% Supplies & Materials $ 40,426 24.0% $ 33,006 21.7% If TGMC had TRMC %'s : Salaries & Benefits $ 9,776 5.5% Supplies & Materials $ 4,088 2.3% Savings per year $ 13,865
- 24. Passion As A Value Performance From The Heart
- 25. Knowledge Awareness People can’t change Data Passion Values Beliefs Change
- 26. Poll Question #4 4) How engaged is your medical staff in your healthcare transformation? a) Not at all engaged b) Somewhat engaged c) Moderately engaged d) Engaged e) Very engaged f) Unsure or not applicable 26
- 27. Transforming an organization is the ultimate test of leadership. John P. Kotter, PhD
- 28. What is the key to your success? “We play good music” Willie Nelson
- 29. The Future is Wellness
- 30. Making waste reduction actionable David A. Burton, MD 30
- 31. Population ordering waste reduction 31
- 32. Sources of population ordering waste
- 33. Population ordering waste reduction Primary Care ordering variation within a population Accessibility (emergency visits/1000 members) Diagnostics (laboratory tests, imaging studies) Compliance with value-based treatment and monitoring algorithms (office visits/1000 members, monitoring tests) Therapeutics • Substances (formulary compliance) • Therapies (e.g., physical therapy) Referrals to sub-specialists (compliance with indications for referral)
- 34. Population ordering waste reduction Community Care dashboard
- 35. Population ordering waste reduction Admission ordering variation within a population. Triage to treatment venue based on objective clinical criteria (e.g., CURB-65 for Community Acquired Pneumonia) Intervention variation within a population Additional diagnostic testing ordered by sub-specialist (lab test duplication; Dx studies) cath) Compliance with indications for intervention for the applicable patient cohort Facilitation of unbiased patient education regarding alternative treatment options for elective procedures
- 36. Population ordering waste reduction NTSV C-Section rate with no induction attempt
- 37. Per case ordering waste reduction (MD) 37
- 38. Sources of per case ordering waste (MD)
- 39. IP & OP per case ordering waste Sources of ordering variation within a case Diagnostics • Laboratory tests • Diagnostic imaging studies Therapeutics • Therapies (e.g., respiratory, physical, et al) • Substances (e.g., antibiotics, blood products) Clinical supply chain (e.g., prosthetics, stents, synthetic bypass grafts, heart rhythm devices) Length of stay on a care unit
- 40. Per case ordering waste Approach and tools to wring out ordering waste Order sets. Evidence-based order sets for the Care Processes in the Pareto list to reduce variation in the ordering of simple diagnostic tests (lab, imaging) Indications. Evidence-based indications and cost information to standardize utilization • Imaging tests (e.g., MRI, CT, US, nuclear scans) • Substances (e.g., utilization criteria for blood, antibiotics, total parenteral nutrition) • Major clinical supplies (e.g., joint prosthetics, cardiac and vascular stents, synthetic bypass grafts, heart rhythm devices, neurostimulators)
- 41. Per case ordering waste Appendectomy Antibiotic order default changed on pre-op standing order set
- 42. Per case ordering waste Appendectomy
- 43. Per case workflow waste reduction (clinical operations) 43
- 44. Sources of per case workflow waste
- 45. Workflow waste - surgical services
- 46. Workflow waste – surgical services reduce room turnover time
- 47. IP per case waste reduction opportunity Facility perspective 47 Per case ordering waste Per case workflow waste Per case defect waste DRAFT $144 MM ~ 23% (100%) Total IP per case waste $57 MM* ~ 9 % (~40% of 23%) $87 MM* ~ 14 % (~60% of 23%) In Progress * Preliminary Findings (work in progress) < 1** % ** Extrapolated from OSHPD and CMS data
- 48. Defect waste reduction 48
- 49. • Ventilator-associated pneumonia (VAP) • Adverse drug events (ADEs) HAC cohorts/registries
- 50. Pareto analysis California OSHPD data 100.0% 90.0% 80.0% 70.0% 60.0% 50.0% 40.0% 30.0% 20.0% 10.0% 0.0% Percent Total Cost % of Total Cost of Patient Injuries % Total Cumulative %
- 51. Pareto analysis Rank-order list – CA OSHPD data
- 52. Prevention process CLABSI flow diagram
- 53. Defect waste reduction 53 CMS’s establishment of penalties weighted by measurement domain creates an incentive to choose CLABSI (#1) and CAUTI (#5) improvement initiatives (65% of total)
- 54. Focus on workflow/defect waste
- 55. Analytic Insights Questions & A Answers
- 56. Session Feedback Survey 56 1. On a scale of 1-5, how satisfied were you overall with this session? 1) Not at all satisfied 2) Somewhat satisfied 3) Moderately satisfied 4) Very satisfied 5) Extremely satisfied 2. What feedback or suggestions do you have? 3. On a scale of 1-5, what level of interest would you have for additional, continued learning on this topic (articles, webinars, collaboration, training)? 1) No interest 2) Some interest 3) Moderate interest 4) Very interested 5) Extremely interested
- 57. Upcoming Breakout Sessions 2:25 PM – 3:25 PM 9. Getting the Most Out of Your Data Analyst John Wadsworth, VP, Technical Operations Health Catalyst * This is a hands-on session 10. How to Make Analytics a Strategic, C-Level Imperative Jon Brown, VP and Associate CIO, Mission Health Gene Thomas, VP & CIO, Memorial Hospital Gulfport 11. Creating Physician Engagement Bryan Oshiro, MD, CMO, Health Catalyst Chris D. Spahr, MD, Enterprise Quality Executive, CHW 12. User Group Kickoff & New Product Roadmap Thomas D. Burton, SVP, Co-Founder, Health Catalyst Steve Barlow, SVP & Co-Founder, Health Catalyst Holly Rimmasch, Chief Clinical Officer, Health Catalyst * This is an interactive feedback session 57 Location Grand Ballroom D Grand Ballroom A Savoy Venezia