
Recommandé
Contenu connexe
Tendances
Tendances (20)
Similaire à Hearing and Balance Centre: 2011 Hearing Awareness Week - Hearing and the Brain
Similaire à Hearing and Balance Centre: 2011 Hearing Awareness Week - Hearing and the Brain (20)
Dernier
Dernier (20)
Hearing and Balance Centre: 2011 Hearing Awareness Week - Hearing and the Brain
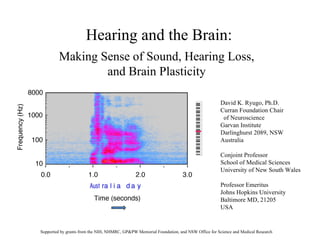
- 1. Hearing and the Brain: David K. Ryugo, Ph.D. Curran Foundation Chair of Neuroscience Garvan Institute Darlinghurst 2089, NSW Australia Conjoint Professor School of Medical Sciences University of New South Wales Professor Emeritus Johns Hopkins University Baltimore MD, 21205 USA Making Sense of Sound, Hearing Loss, and Brain Plasticity Supported by grants from the NIH, NHMRC, GP&PW Memorial Foundation, and NSW Office for Science and Medical Research
- 3. All sounds are made by combinations of frequencies
- 4. Sound has Energy or Loudness OSHA permissible levels: 85 dB for 8 hrs; 100 dB for 2 hrs; 110 dB for 0.5 hrs
- 5. Sound has important timing features (onset, offset, duration, change) dot dot dot dash dash dash dot dot dot American English Australian English ah- seet -l-koh-leen ah-suh- teel -koh-leen
- 6. IHCs OHCs
- 8. Recovery of hearing sensitivity in quiet after exposure to damaging noise Acoustic overexposure: the traumatic stimulus was 100 dB SPL for 2 hours .
- 9. Invisible damage from noise exposures Kujawa and Liberman, 2009
- 10. With moderate hearing loss, thresholds in quiet are normal. The problem is when there is noise in the background. Why is this?
- 11. Modified from Spoendlin, 1973
- 13. 0.1 mm
- 16. Time (seconds) “ Testing . . . one, two, three”
Notes de l'éditeur
- Thank you to the organizers for inviting me to speak; thank you in the audience for attending. (1) I’m going to speak about hearing, noise damage, and strategies for treatment. First, however, I must introduce you to sound. There are 3 principal components to sound as demonstrated in this spectrogram of the voiced “Australia Day”: frequency, energy, and time. The plot shows sound in terms of frequency on the Y-axis, variations over time on the X-axis, and pressure or loudness as darkness of color.
- Let me just review a few things about sound. Sound is composed of vibrations in air . Imagine that we have a tuning fork. We bang it against our palm and set the tines in motion. When the tine goes one way, it compresses air molecules. When it goes the opposite way, it rarefies the air molecules. Each pair of compression and rarefaction is a cycle, and using cycles per second as units, we have frequency of vibrations. Low frequencies have a low sensation of pitch, whereas higher frequencies produce a higher sensation of pitch. Middle C has around 260 cycles/sec.
- All sounds are composed of combinations of frequencies. In an analogous way that water serves as a prism and separates light into a rainbow of different colors (represented by different frequencies of electromagnetic radiation), so does the human ear separate sound into different audible frequencies. Frequencies are important be/c they are the fundamental essence of sound, and allow us to distinguish small differences.
- Loudness is our subjective experience to the pressure of the vibrations. Our sensitivity to loudness is remarkable—from a whisper to a jet engine.
- The other component of sound is time. Sound has onset, offset, duration, and change. Timing of sound underlies the Morse Code, musical melody, and pronounciation.
- In this figure, we have the human ear. Vibrations in air enter the ear, get captured by the pinna, are funneled to the ear drum, and transmitted to the inner ear by the three middle ear bones. The working part of the ear is a flexible membrane upon which sit 4 rows of receptor cells. In the red box, we are looking at the tops of the receptor cells, called hair cells. The fuzz on top is composed of stereocilia. Vibrations in the inner ear mechanically stimulate the auditory receptors that we see here.
- On the left is a normal set of auditory receptor cells, whereas on the right are receptor cells that have been damaged by loud sound. Note that many auditory cells are missing and those that remain appear damaged.
- But the challenge for hearing is not in quiet but in noisy backgrounds. This test is inadequate.
- Here we have a case of exposure to loud sounds—100 dB for 2 hours, which is equivalent to a night in a club or attending a rock concert. Note there is no damage to the auditory receptors. BUT . . . on the left we have the auditory nerve fibers in green, the cell nuclei as large red balls, and auditory nerve synapses as red dots. Look what happens one day after the noise exposure. Half the synapses are gone, although the hair cells and auditory nerve fibers remain. Noise has uncoupled the ear from the brain.
- We are able to see these synapses because there is an electron microscope right here in the Garvan.
- This figure shows just a small segment of the sensory apparatus with inner hair cells in yellow and innervating terminals in green. The peripheral processes are shown in black, and they lead to the ganglion cell bodies. Note that each inner hair cell contacts multiple ganglion cells.
- The uncoupling causes auditory nerve fibers to die. So one major effect of noise damage is to reduce the lines of information into the brain. What happens then? It’s like sound gets pixelated.
- The central end of the neuron is very different from that in the inner ear. The auditory nerve fiber contacts up to 100 brain cells, and one contact in particular is of great interest to us because of its unique structure, large size, and evolutionary conservation.
- With hearing loss, the size and complexity of these endings are pathologic. Note the loss of branching. The smaller size also means that there are few synapses generated by the endings.
- In addition to changes in auditory nerve input, there are also changes in the amount of inhibitory input. Inhibition normally serves to prevent the cell response from becoming saturated. With the reduced input from the auditory nerve, there is less need for inhibition. But inhibition also provides for sharpening the signals. The result is that signals become sloppier in terms of timing and frequency sharpness.
- This slide Illustrates the challenge for the brain to decipher speech sounds. The two panels are recordings of me speaking “testing . . . one, two, three.” The top panel shows the time and loudness of the speech, (1) spoken in quiet, (2) with background noise (note the increase in sound energy), (3) with high frequencies filtered out, and (4) with high frequencies filtered and in noise. Note how the noise obliterates the speech. In the panel below, we have the representation of frequency over time, with the energy levels indicated by the darkness of the recorded signal. First, it is important to note that some sounds have sudden onset whereas others have gradual ones. The sounds having mostly high frequencies are consonants; those with low frequencies are the vowels. The speech signals are obvious in quiet and noise with normal hearing. However, with high frequency hearing loss, it isn’t just high frequencies that are affected. All speech sounds are muted. Moreover, the bands of high and low sound energy is lost in the vowels. And these changes are even more evident when there is noise in the background. This bottom panel models the problem of speech discrimination in noise for those with mild to moderate hearing loss. My research is trying to understand those brain changes that underlie the problem so that we can consider intervention strategies that address these very changes.
- These devices will help but never return what Mother Nature originally provided. Research has shown that restoration of sound for hearing impaired humans helps return synapse structure and circuit organization towards normal. The idea is that with practice, the hearing abilities will continue to improve and the neuronal substrate will likewise return towards normal.