
Recommandé
Recommandé
Contenu connexe
Similaire à Cost-Volume-Profit Analysis Explained for Umbrella Manufacturing Company
Similaire à Cost-Volume-Profit Analysis Explained for Umbrella Manufacturing Company (18)
Plus de herbertwilson5999
Plus de herbertwilson5999 (20)
Dernier
Dernier (20)
Cost-Volume-Profit Analysis Explained for Umbrella Manufacturing Company
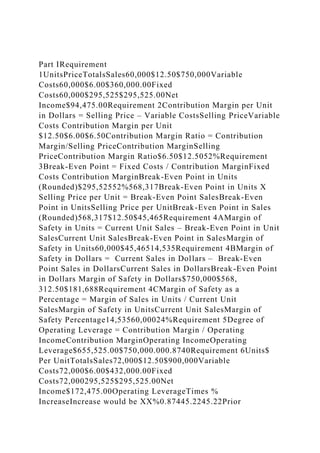
- 1. Part IRequirement 1UnitsPriceTotalsSales60,000$12.50$750,000Variable Costs60,000$6.00$360,000.00Fixed Costs60,000$295,525$295,525.00Net Income$94,475.00Requirement 2Contribution Margin per Unit in Dollars = Selling Price – Variable CostsSelling PriceVariable Costs Contribution Margin per Unit $12.50$6.00$6.50Contribution Margin Ratio = Contribution Margin/Selling PriceContribution MarginSelling PriceContribution Margin Ratio$6.50$12.5052%Requirement 3Break-Even Point = Fixed Costs / Contribution MarginFixed Costs Contribution MarginBreak-Even Point in Units (Rounded)$295,52552%568,317Break-Even Point in Units X Selling Price per Unit = Break-Even Point SalesBreak-Even Point in UnitsSelling Price per UnitBreak-Even Point in Sales (Rounded)568,317$12.50$45,465Requirement 4AMargin of Safety in Units = Current Unit Sales – Break-Even Point in Unit SalesCurrent Unit SalesBreak-Even Point in SalesMargin of Safety in Units60,000$45,46514,535Requirement 4BMargin of Safety in Dollars = Current Sales in Dollars – Break-Even Point Sales in DollarsCurrent Sales in DollarsBreak-Even Point in Dollars Margin of Safety in Dollars$750,000$568, 312.50$181,688Requirement 4CMargin of Safety as a Percentage = Margin of Sales in Units / Current Unit SalesMargin of Safety in UnitsCurrent Unit SalesMargin of Safety Percentage14,53560,00024%Requirement 5Degree of Operating Leverage = Contribution Margin / Operating IncomeContribution MarginOperating IncomeOperating Leverage$655,525.00$750,000.000.8740Requirement 6Units$ Per UnitTotalsSales72,000$12.50$900,000Variable Costs72,000$6.00$432,000.00Fixed Costs72,000295,525$295,525.00Net Income$172,475.00Operating LeverageTimes % IncreaseIncrease would be XX%0.87445.2245.22Prior
- 2. Income$94,475.00From Part 1Increase$78,000.00Prior Income X XX% AboveTotal$172,475.00Requirement 7Targeted Income = (Fixed Costs + Target Income) / Contribution MarginFixed Costs + Target IncomeDivided by Contribution Margin# of Units (Rounded)Fixed Costs$295,525Target Income$78,000Total$373,525$655,525.001# of Units Above X $ Per UnitProofRevenueXX,XXX X $XX.XX$78,000Variable CostsXX,XXX X $X.XX$432,000Contribution Margin$655,525Fixed Costs$295,525Net Income$360,000Requirement 8Sales MixCurrentSpecialtyTotalExpected Sales UnitsRevenue = Sales X Price$750,000$900,000$1,650,000Variable Costs X Units$360,000$432,000$792,000Contribution Margin$655,525$655,525$1,311,050Fixed Costs$295,525$295,525$591,050Operating Income$539,900Prior Net Income From Requirement 1$461,900.00Additional Operating Income(Operating Income Above Less Prior Income)$166,375.00Decision With ExplanationThe company needs to produce more of the umbrellas so as to increase the volume of sales that it will record in the market. Consequently, the profits realized by the firm will also increase. However, there is need for the costs of production to be reduced so as to increase the net revenue of the company. Part IIRequirement 1Hampshire CompanyVariable Costing Income StatementUnits$SalesX$$Variable Cost of Goods Sold: Beginning Inventory$ Direct MaterialsX$$ Direct LaborX$$ Manufacturing OverheadX$$ Total Variable Costs$ Cost of Good Available for Sale$ Deduct Ending InventoryX$$ Variable Costs of Goods Sold$Variable Selling CostsX$$$Contribution Margin$Fixed Costs:Fixed Manufacturing Costs$Fixed Administrative Costs$Operating Income$Requirement 2Hampshire CompanyAbsorption Costing Income StatementUnits$SalesX$$Variable Cost of Goods Sold: Beginning Inventory$ Direct MaterialsX$$ Direct LaborX$$ Manufacturing OverheadX$$ Total Variable Costs$ Allocated
- 3. Fixed Manufacturing CostsX$$ Cost of Good Available for Sale$ Deduct Ending InventoryX$$ Costs of Goods Sold$Gross Margin$Fixed Costs:Variable Selling CostsX$$Fixed Administrative Costs$Operating Income$ Part IIIRequirement 1Price Variances:(Actual Price – Standard Price) X Actual QuantityActualStandardActual QuantityVarianceFavorable or UnfavorableCloth$$X$Handle Assembly$$X$Labor Price Variance$$X$Requirement 2Efficiency Variances:(Actual Quantity of Input Used – Standard Quantity of Input Allowed for Actual Output) X Budgeted Price of InputActualStandardStandard PriceVarianceFavorable or UnfavorableClothXX$$(1.5 Yards per Unit)Handle AssemblyXX$$(1 per Unit)LaborXX$$(.20 per Unit) Part IVCost Information From InstructionsStickCollapsibleUnits Sold60,0003,000Selling Price$12.50$14.00Direct Material Cost Per Unit$3.00$3.10Direct Labor Cost Per Hour$7.50$8.00Variable MO$0.40$0.40Variable Selling Costs$1.10$1.10Labor Hours Per Unit0.20.2Sales Orders1201Purchase Orders503Production Runs456Material Moves8610Machine Setups1306Machine Hours52532Inspections20010Shipments603Activity Information from InstructionsActivityActivity CostActivity Cost DriverOrder Processing$35,000Number of Sales OrdersPurchasing$36,000Number of Purchase OrdersMaterial Handing$28,000Material MovesMachine Setup$14,000Machine SetupsProduction$99,000Production RunsAssembly$80,000Machine HoursInspecting$11,000Number of InspectionsShipping$7,500Number of ShipmentsRequirement 1ActivityTotal CostsQuantity of Cost Allocation Base Overhead Allocation RateOrder Processing$X$Purchasing$X$Material Handing$X$Machine Setup$X$Production$X$Assembly$X$Inspecting$X$Shipping$ X$Requirement 2Traditional CostingStick UmbrellaCollapsible UmbrellaTotalRevenues$$$Direct Materials$$$Direct Labor$$$Variable Overhead$$$Variable Selling
- 4. Costs$$$Allocated Fixed Overhead$$$Total Costs$$$Operating Income$$$Operating Income %%%Per Unit Operating Income$$Requirement 3Activity-Based CostingStick UmbrellaCollapsible UmbrellaTotalRevenues$$$Direct Materials$$$Direct Labor$$$Variable Overhead$$$Variable Selling Costs$$$Order Processing Costs$$$Purchasing Costs$$$Material Handing Costs$$$Machine Setup Costs$$$Production Costs$$$Assembly Costs$$$Inspecting Costs$$$Shipping Costs$$$Total Costs$$$Operating Income$$$Operating Income %%%Per Unit Operating Income$$Requirement 4Costs per UnitStick UmbrellaCollapsible UmbrellaTraditional$$ABC$$Difference$$Requirement 5 Running head: Cost-Volume-Profit Analysis 1 Cost-Volume-Profit Analysis 4 Olawale Alimi Southern New Hampshire University Cost Accounting – Milestone One Cost-Volume-Profit Analysis October 18, 2015
- 5. The cost-volume-profit analysis based on the cost classifications, illustrate that the firm make a net income of $94,475 before tax is imposed. The value of the contribution margin per unit is $6.50 while the contribution margin ratio is 52%. CVP is essential when it comes to the aspect of assisting in the management of the short-term economic plans. It is because it helps the managers to make better decisions regarding the ways through which the business can operate in a more efficient way. One, it assists the managers to make precise decisions especially when it comes to answering pragmatic questions that are vital in the process of business analysis. For instance, it helps the managers to get to know the breakeven points of the company. Such knowledge is crucial for the short- term economic goals of the company. It is because the manager will be in a better position to tweak spending and seek ways to increase the production of the firm to increase the revenue realized in the business. The CVP analysis is also much detailed, and it is mainly based on the statistical models that make the decisions taken by the management to be easily broken down into probabilities. It is a move that helps to make the most informed decision in the company. The analysis also provides a detailed snapshot of the business activities of the company. It aids the managers to get to know the variables that need alterations for the sake of the future survival of the company (Albrecht, 2007). The break-even point quantity for the company stands at 45,465 units. These are the quantity of products that the firm can comfortably produce at the resources that are readily available in the firm. When the company manufactures this quantity of products, then it will not experience any shortage in the costs of production. The break-even revenue for the firm stands at $568,312.50. The company is breaking even because it can
- 6. easily produce these amount of products with the materials that are available at the firm and still make profits. But, if it produces more than these then it will incur more costs of production and at the same time increase its revenue in the economy. The amount produced by the firm at the moment is what it can comfortably realize. However, CVP analysis has certain implications for the planning of the company. The projections are mainly based on the cost estimates rather than the precise numbers. It is an anomaly that can result in inaccurate projections in the economy. They can make the firm take the unwanted path towards the realization of better economic gains in future. Also, the analysis mainly provides approximate answers to the hard questions regarding ways to run the business. The answers are not exact and, therefore, does not provide the real figures on the operations of the firm. It implies that the managers have to exercise a high level of extreme caution when it comes to the process of making decisions regarding the changes that need to be made on the financial positions and operations of the firm in the economy (Cafferky et al., 2010). For the CVP analysis to be precise, it has to be done for each specific product, and it makes the entire process not only to be cumbersome but also time-consuming. The judgments have to be made regarding the results of the analysis after a very careful and deliberations have been taken into account. Investigations to ensure that the results from the statistical model are real may include observing the employees’ daily activities and interviewing them to get their opinions on the matter. References Albrecht, W. S. (2007). Accounting, concepts & applications. Mason, Ohio: Thomson/South-Western.
- 7. Cafferky, M. E., & Wentworth, J. (2010). Breakeven analysis: The conclusive guide to cost-volume-profit analysis. New York: Business Expert Press. ACC 550 Final Project Guidelines and Rubric Overview The final project for this course is the creation of a quantitative analysis that includes an Excel spreadsheet, accompanied by a memo to management. Accountants provide management with the logistics of the business that are crucial for daily operations and a company’s overall success. In any business, it is of the utmost importance to be aware of all finances and internal processes. Cost accountants focus solely on the internal processes of a business and are tasked with eliminating any unnecessary costs in order to maximize profits. In this assessment, you have been tasked with conducting a quantitative analysis that looks into the internal processes of a company. Based on your analysis, you will formulate recommendations to management that aim to improve internal processes and increase profits for the company. The project is divided into three milestones, which will be submitted at various points throughout the course to scaffold learning and ensure quality final submissions. These milestones will be submitted in Modules Three, Five, and Seven. Your final submission will occur in
- 8. Module Nine. In this assignment, you will demonstrate your mastery of the following course outcomes: -volume-profit (CVP) analysis based on cost classification for planning and control of internal accounting processes within an organization relevant information to decision makers the needs of an organization planning tools for their impact on business operations Prompt Conduct a quantitative analysis of a company’s internal processes using the Hampshire Company Case Study document. Your analysis will consist of completing the Hampshire Company Spreadsheet and will be accompanied by a memo to management. Specifically, the following critical elements must be addressed: I. Cost-Volume-Profit Analysis Cost-volume-profit (CVP) analysis is a useful tool for informing short-term economic planning within an organization. In this section, a CVP analysis will be conducted and used to inform business decisions and recommendations.
- 9. A. Perform a CVP analysis based on cost classifications. B. Explain how a CVP analysis can assist management with short-term economic planning. Support your response with examples from your CVP analysis. C. Accurately compute the break-even quantity and break-even revenue. http://snhu- media.snhu.edu/files/course_repository/graduate/acc/acc550/acc _550_hampshire_company_case_study.docx http://snhu- media.snhu.edu/files/course_repository/graduate/acc/acc550/acc _550_hampshire_company_spreadsheet.xlsx D. Determine whether the company is breaking even. What are the CVP analysis implications on planning? II. Inventory Management Inventory management serves to minimize the cost to maintain inventory and maximize returns. In this section, the company’s financial data will be reviewed in order to determine the optimal inventory management system. A. Determine an optimal cost allocation method based on the relevant costs. B. Describe how this method should be used by decision makers to fulfill their responsibilities. Support your response with examples. C. What are the pros and cons of implementing the just-in-time
- 10. (JIT) inventory system? Do the pros outweigh the cons for this company? D. Explain how the just-in-time (JIT) inventory system can benefit this organization. Defend your response. E. Identify the inventory management method you recommend, and explain why this method will benefit the company. III. Benchmarking In this section, benchmarking will be reviewed. Benchmarking can be implemented in various ways depending on a company’s circumstances. Your company has decided to implement benchmarking and would like you to research and recommend the most effective approach. A. What is the advantage to benchmarking in terms of improving companies’ performance? Support your response. B. Identify possible approaches to benchmarking. Describe each. C. Which benchmarking method should management adopt and why? IV. Alternative Costing Method There are various costing methods available for companies to implement. As a company grows, it may become beneficial to consider an alternate costing method. A. Identify an alternative costing method that could benefit this company, and describe the main characteristics of that method. B. What should a company look for when trying to determine whether they should adopt such a system?
- 11. C. Should the company adopt this alternative costing method? Defend your response. V. Memo to Management Your memo to management should serve as a summary of your quantitative analysis, reviewing the key points and recommendations that you feel management should be aware of. A. Describe the overall findings of your analysis, including key elements that management should be aware of. B. Make a recommendation to management based on your cost accounting analysis that will enhance business planning. C. Recommend a performance tool to management based on your cost accounting analysis that will improve business operations. You may use the following resources to help you prepare your memo to management: Purdue OWL: Memos contains information related to formatting a memo, and Purdue OWL: Sample Memo presents a sample of a memo that you can use as a guide when you format the memo for the final project. https://owl.english.purdue.edu/owl/resource/590/03/ https://owl.english.purdue.edu/owl/resource/590/04/ If you would like a refresher course on using various features of Excel, sign in to Atomic Learning and type “Excel” in the search box. This will provide you with
- 12. options to select the specific level of training that you need (intro, intermediate, or advanced) and the specific version of Excel that you have (e.g., 2011 or 2013). The trainings are broken down into small, meaningful chunks. Therefore, you should be able to find specific topics at each level that will meet your needs. Milestones Milestone One: Draft of Cost-Volume-Profit Analysis In Module Three, you will submit a draft of the cost-volume- profit analysis (Section I of the final project), including all critical elements as listed above. Refer to the Hampshire Company Case Study document, as this will provide you with details on how to complete this milestone. All calculations for your quantitative analysis should be completed in the Hampshire Company Spreadsheet. You will provide a rough draft of your one- to two-page qualitative analysis in a Word document. The Word document must be in APA format. Once you have completed your analysis, submit your Word and Excel documents. This milestone will be graded with the Milestone One Rubric. Milestone Two: Draft of Inventory Management and Benchmarking In Module Five, you will submit a draft of the inventory management and benchmarking sections of the final project (Sections II and III, respectively), including all critical elements as listed above. Refer to the Hampshire Company Case Study document, as this will provide you with details on how to complete this milestone. All calculations for your quantitative analysis should be completed in the Hampshire Company Spreadsheet. You will provide a rough draft of your three- to four-
- 13. page qualitative analysis in a Word document. The Word document must be in APA format. Once you have completed your analysis, submit your Word and Excel documents. This milestone will be graded with the Milestone Two Rubric. Milestone Three: Draft of Alternative Costing Method In Module Seven, you will submit a draft of the alternative costing method section of the final project (Section IV), including all critical elements as listed above. Refer to the Hampshire Company Case Study document, as this will provide you with details on how to complete this milestone. All calculations for your quantitative analysis should be completed in the Hampshire Company Spreadsheet. You will provide a rough draft of your two- to three-page qualitative analysis in a Word document. The Word document must be in APA format. Once you have completed your analysis, submit your Word and Excel documents. This milestone will be graded with the Milestone Three Rubric. Final Project Submission: Quantitative Analysis and Memo to Management In Module Nine, you will submit your quantitative analysis and memo to management. It should be a complete, polished artifact containing all of the critical elements of the final product. It should reflect the incorporation of feedback gained throughout the course. This submission will be graded using the Final Project Rubric. https://www.atomiclearning.com/login/snhu
- 14. Deliverables Milestone Deliverable Module Due Grading One Draft of Cost-Volume-Profit Analysis Three Graded separately; Milestone One Rubric Two Draft of Inventory Management and Benchmarking Five Graded separately; Milestone Two Rubric Three Draft of Alternative Costing Method Seven Graded separately; Milestone Three Rubric Final Project Submission: Quantitative Analysis and Memo to Management Nine Graded separately; Final Project Rubric Final Project Rubric Guidelines for Submission: The financial portions of your quantitative analysis should be submitted using the Hampshire Company Spreadsheet. The written portions of your qualitative analysis should be submitted as a six- to nine-page Microsoft Word document. Your memo to management should be submitted as a two- to three-page Microsoft Word document. Both Word documents should use double spacing, one-inch margins, and 12-point Times New Roman font. Sources should be cited according to APA style.
- 15. Instructor Feedback: This activity uses an integrated rubric in Blackboard. Students can view instructor feedback in the Grade Center. For more information, review these instructions. Critical Elements Exemplary Proficient Needs Improvement Not Evident Value Cost-Volume-Profit Analysis: Analysis Performs a cost-volume-profit analysis based on cost classifications (100%) Performs a cost-volume-profit analysis, but it is not based on cost classifications (70%) Does not perform a cost-volume- profit analysis (0%) 5.4 Cost-Volume-Profit Analysis: Economic Planning Meets “Proficient” criteria and demonstrates a nuanced understanding of the relationship between CVP and short-term
- 16. planning (100%) Explains how a CVP analysis can assist management with short- term economic planning and supports response with examples (90%) Explains how a CVP analysis can assist management with short- term economic planning but does not support response with examples, or explanation is cursory or inaccurate (70%) Does not explain how a CVP analysis can assist management with short-term economic planning (0%) 5.4 Cost-Volume-Profit Analysis: Break-Even Accurately computes the break- even quantity and break-even revenue (100%) Computes the break-even quantity and break-even revenue, but there are issues with accuracy (70%) Does not compute the break-
- 17. even quantity and break-even revenue (0%) 5.4 http://snhu- media.snhu.edu/files/production_documentation/formatting/rubr ic_feedback_instructions_student.pdf Cost-Volume-Profit Analysis: Implications Meets “Proficient” criteria and uses industry-specific language to establish expertise (100%) Determines whether the company is breaking even and identifies cost-volume-profit analysis implications for planning (90%) Determines whether the company is breaking even but does not identify cost-volume- profit analysis implications on planning, or determination or identification contain issues with accuracy (70%) Does not determine whether the company is breaking even (0%)
- 18. 5.4 Inventory Management: Relevant Costs Meets “Proficient” criteria and demonstrates a nuanced understanding of the relationship between optimal cost allocation and relevant costs (100%) Determines an optimal cost allocation method based on the relevant costs (90%) Determines an optimal cost allocation method, but determination is not based on the relevant costs (70%) Does not determine an optimal cost allocation method (0%) 5.4 Inventory Management: Method Meets “Proficient” criteria, and description is exceptionally clear and contextualized (100%) Recommends how the method should be used by decision
- 19. makers to fulfill their responsibilities and supports response with examples (90%) Recommends how the method should be used by decision makers to fulfill their responsibilities but does not support response with examples (70%) Does not recommend how the method should be used by decision makers (0%) 5.4 Inventory Management: Pros and Cons Meets “Proficient” criteria, and description is well supported with examples (100%) Identifies the pros and cons of implementing JIT and describes whether the pros outweigh the cons for this company (90%) Identifies the pros and cons of implementing JIT but does not describe whether the pros outweigh the cons for this company (70%)
- 20. Does not identify the pros and cons of implementing JIT (0%) 5.4 Inventory Management: Inventory System Meets “Proficient” criteria, and explanation is exceptionally clear and contextualized (100%) Explains how the JIT inventory system can benefit the organization and defends response (90%) Explains how the JIT inventory system can benefit the organization but does not defend response (70%) Does not explain how the JIT inventory system can benefit the organization (0%) 5.4 Inventory Management: Inventory Meets “Proficient” criteria and uses specific examples to support description (100%)
- 21. Identifies the inventory management method recommended and explains why this method will benefit the company (90%) Identifies the inventory management method recommended but does not explain why this method will benefit the company (70%) Does not identify the inventory management method that is recommended (0%) 5.4 Benchmarking: Advantage Meets “Proficient” criteria, and support includes specific examples (100%) Identifies an advantage of benchmarking and supports response (90%) Identifies an advantage of benchmarking but does not support response (70%) Does not identify an advantage of
- 22. benchmarking (0%) 5.4 Benchmarking: Approaches Meets “Proficient” criteria and shows a keen insight into the variety of benchmarking approaches (100%) Identifies different approaches to benchmarking and describes each (90%) Identifies different approaches to benchmarking but does not describe each (70%) Does not identify different approaches to benchmarking (0%) 5.4 Benchmarking: Benchmarking Method Meets “Proficient” criteria, and determination is well supported
- 23. and plausible (100%) Determines which benchmarking method management should adopt and justifies response (90%) Determines which benchmarking method management should adopt but does not justify response (70%) Does not determine which benchmarking method management should adopt (0%) 5.4 Alternative Costing Method: Main Characteristics Meets “Proficient” criteria and displays a keen insight into the variety of alternative costing systems (100%) Identifies alternative costing systems and describes the main characteristics of each (90%) Identifies alternative costing systems but does not describe the main characteristics of each, or identification or description
- 24. contain inaccuracies (70%) Does not identify alternative costing systems (0%) 5.4 Alternative Costing Method: Adopt Meets “Proficient” criteria and demonstrates a nuanced understanding of the relationship of the needs of a company and an alternative costing system (100%) Determines what the company should look for when deciding to adopt an alternative costing system and supports response with examples (90%) Determines what the company should look for when deciding to adopt an alternative costing system but does not support response with examples (70%) Does not determine what the company should look for when deciding to adopt an alternative costing system (0%) 5.4
- 25. Alternative Costing Method: Method Meets “Proficient” criteria, and determination is well supported and plausible (100%) Determines whether the company should adopt the alternative costing method and defends response (90%) Determines whether the company should adopt the alternative costing method but does not defend response (70%) Does not determine whether the company should adopt the alternative costing method (0%) 5.4 Memo to Management: Findings Meets “Proficient” criteria, and description is exceptionally clear and contextualized (100%) Describes the overall findings of analysis and identifies key elements that management should be aware of (90%)
- 26. Describes the overall findings of analysis but does not identify key elements that management should be aware of (70%) Does not describe the overall findings of analysis (0%) 5.4 Memo to Management: Business Planning Meets “Proficient” criteria, and recommendation is well supported and plausible (100%) Makes recommendation to enhance business planning based on cost accounting analysis (90%) Makes recommendation to enhance business planning, but recommendation is not based on cost accounting analysis (70%) Does not make recommendation to enhance planning (0%) 5.4 Memo to Management: Business Operations
- 27. Meets “Proficient” criteria, and recommendation uses industry- specific language to establish expertise (100%) Recommends a performance tool to improve business operations based on cost accounting analysis (90%) Recommends a performance tool to improve business operations, but recommendation is not based on cost accounting analysis (70%) Does not recommend a performance tool to improve business operations (0%) 5.4 Articulation of Response Submission is free of errors related to citations, grammar, spelling, syntax, and organization and is presented in a professional and easy to read format (100%) Submission has no major errors related to citations, grammar, spelling, syntax, or organization (90%) Submission has major errors related to citations, grammar, spelling, syntax, or organization
- 28. that negatively impact readability and articulation of main ideas (70%) Submission has critical errors related to citations, grammar, spelling, syntax, or organization that prevent understanding of ideas (0%) 2.8 Earned Total 100% ACC 550 Milestone Three Guidelines and Rubric Overview: The final project for this course is the creation of a quantitative analysis that includes an Excel spreadsheet accompanied by a memo to management. Accountants provide management with the logistics of the business that are crucial for daily operations and a company’s overall success. In any business, it is of the utmost importance to be aware of all finances and internal processes. Cost accountants focus solely on the internal processes of a business and are tasked with eliminating any unnecessary costs in order to maximize profits. For the final project, you have been tasked with conducting a
- 29. quantitative analysis that looks into the internal processes of a company. Based on your analysis, you will formulate recommendations to management that aim to improve internal processes and increase profits for the company. Prompt: For this milestone, submit a draft of the alternative costing method section of the final project (Section IV), including all of critical elements listed below. Refer to the Hampshire Company Case Study document, as this provides details on how to complete this milestone. All calculations for your quantitative analysis should be completed in the Hampshire Company Spreadsheet. You will provide a rough draft of your qualitative analysis in a Word document. Specifically, the following critical elements must be addressed: IV. Alternative Costing Method There are various costing methods available for companies to implement. As a company grows, it may become beneficial to consider an alternate costing method. A. Identify an alternative costing method that could benefit this company, and describe the main characteristics of that method. B. What should a company look for when trying to determine whether they should adopt such a system? C. Should the company adopt this alternative costing method? Defend your response. If you would like a refresher course on using various features of Excel, sign in to Atomic Learning and type “Excel” in the search box. This will provide you with
- 30. options to select the specific level of training that you need (intro, intermediate, or advanced) and the specific version of Excel that you have (e.g., 2011 or 2013). The trainings are broken down into small, meaningful chunks. Therefore, you should be able to find specific topics at each level that will meet your needs. Guidelines for Submission: The written portion of this submission must be a two- to three-page Word document with 12-point Times New Roman font, double spacing, and one-inch margins. Sources should be cited according to APA style. Use the Hampshire Company Spreadsheet to submit your calculations as an Excel file. Instructor Feedback: This activity uses an integrated rubric in Blackboard. Students can view instructor feedback in the Grade Center. For more information, review these instructions. http://snhu- media.snhu.edu/files/course_repository/graduate/acc/acc550/acc _550_hampshire_company_case_study.docx http://snhu- media.snhu.edu/files/course_repository/graduate/acc/acc550/acc _550_hampshire_company_spreadsheet.xlsx https://www.atomiclearning.com/login/snhu http://snhu- media.snhu.edu/files/production_documentation/formatting/rubr ic_feedback_instructions_student.pdf Rubric Critical Elements Proficient (100%) Needs Improvement (75%) Not Evident (0%) Value
- 31. Alternative Costing Method: Main Characteristics Identifies alternative costing systems and describes the main characteristics of each Identifies alternative costing systems but does not describe the main characteristics of each, or identification or description contain inaccuracies Does not identify alternative costing systems 30 Alternative Costing Method: Adopt Determines what the company should look for when deciding to adopt an alternative costing system and supports response with examples Determines what the company should look for when deciding to adopt an alternative costing system but does not support response with examples Does not determine what the company should look for when deciding to adopt an alternative costing system 30 Alternative Costing Method: Method
- 32. Determines whether the company should adopt the alternative costing method and defends response Determines whether the company should adopt the alternative costing method but does not defend response Does not determine whether the company should adopt the alternative costing method 30 Articulation of Response Submission has no major errors related to citations, grammar, spelling, syntax, or organization Submission has major errors related to citations, grammar, spelling, syntax, or organization that negatively impact readability and articulation of main ideas Submission has critical errors related to citations, grammar, spelling, syntax, or organization that prevent understanding of ideas 10 Earned Total 100%
- 33. ACC 550 Milestone Two Guidelines and Rubric Overview: The final project for this course is the creation of a quantitative analysis that includes an Excel spreadsheet accompanied by a memo to management. Accountants provide management with the logistics of the business that are crucial for daily operations and a company’s overall success. In any business, it is of the utmost importance to be aware of all finances and internal processes. Cost accountants focus solely on the internal processes of a business and are tasked with eliminating any unnecessary costs in order to maximize profits. For the final project, you have been tasked with conducting a quantitative analysis that looks into the internal processes of a company. Based on your analysis, you will formulate recommendations to management that aim to improve internal processes and increase profits for the company. Prompt: For this milestone, submit a draft of the inventory management and benchmarking sections of the final project (Sections II and III, respectively), including all the critical elements listed below. Refer to the Hampshire Company Case Study document, as this provides details on how to complete this milestone. All calculations for your quantitative analysis should be completed in the Hampshire Company Spreadsheet. You will provide a rough draft of your qualitative analysis in a Word document.
- 34. Specifically, the following critical elements must be addressed: II. Inventory Management Inventory management serves to minimize the cost to maintain inventory and maximize returns. In this section, the company’s financial data will be reviewed in order to determine the optimal inventory management system. A. Determine an optimal cost allocation method based on the relevant costs. B. Describe how this method should be used by decision makers to fulfill their responsibilities. Support your response with examples. C. What are the pros and cons of implementing the just-in-time (JIT) inventory system? Do the pros outweigh the cons for this company? D. Explain how the just-in-time (JIT) inventory system can benefit this organization. Defend your response. E. Identify the inventory management method you recommend, and explain why this method will benefit the company. III. Benchmarking In this section, benchmarking will be reviewed. Benchmarking can be implemented in various ways depending on a company’s circumstances. Your company has decided to implement benchmarking and would like you to research and recommend the most effective approach. A. What is the advantage to benchmarking in terms of improving companies’ performance? Support your response.
- 35. B. Identify possible approaches to benchmarking. Describe each. C. Which benchmarking method should management adopt and why? http://snhu- media.snhu.edu/files/course_repository/graduate/acc/acc550/acc _550_hampshire_company_case_study.docx http://snhu- media.snhu.edu/files/course_repository/graduate/acc/acc550/acc _550_hampshire_company_spreadsheet.xlsx If you would like a refresher course on using various features of Excel, sign in to Atomic Learning and type “Excel” in the search box. This will provide you with options to select the specific level of training that you need (intro, intermediate, or advanced) and the specific version of Excel that you have (e.g., 2011 or 2013). The trainings are broken down into small, meaningful chunks. Therefore, you should be able to find specific topics at each level that will meet your needs. Guidelines for Submission: The written portion of this submission must be a three- to four-page Word document with 12-point Times New Roman font, double spacing, and one-inch margins. Sources should be cited according to APA style. Use the Hampshire Company Spreadsheet to submit your calculations as an Excel file. Instructor Feedback: This activity uses an integrated rubric in
- 36. Blackboard. Students can view instructor feedback in the Grade Center. For more information, review these instructions. Critical Elements Proficient (100%) Needs Improvement (75%) Not Evident (0%) Value Inventory Management: Relevant Costs Determines an optimal cost allocation method based on the relevant costs Determines an optimal cost allocation method, but determination is not based on the relevant costs Does not determine an optimal cost allocation method 11 Inventory Management: Method Recommends how the method should be used by decision makers to fulfill their responsibilities and supports response with examples Recommends how the method should be used by decision makers to fulfill their
- 37. responsibilities but does not support response with examples Does not recommend how the method should be used by decision makers 11 Inventory Management: Pros and Cons Identifies the pros and cons of implementing JIT and describes whether the pros outweigh the cons for this company Identifies the pros and cons of implementing JIT but does not describe whether the pros outweigh the cons for this company Does not identify the pros and cons of implementing JIT 11 Inventory Management: Inventory System Explains how the JIT inventory system can benefit the organization and defends response Explains how the JIT inventory system can benefit the organization but does not defend
- 38. response Does not explain how the JIT inventory system can benefit the organization 11 Inventory Management: Inventory Identifies the inventory management method recommended and explains why this method will benefit the company Identifies the inventory management method recommended but does not explain why this method will benefit the company Does not identify the inventory management method that is recommended 11 Benchmarking: Advantage Identifies an advantage of benchmarking and supports response Identifies an advantage of benchmarking but does not support response Does not identify an advantage of benchmarking
- 39. 11 Benchmarking: Approaches Identifies different approaches to benchmarking and describes each Identifies different approaches to benchmarking but does not describe each Does not identify different approaches to benchmarking 11 Benchmarking: Benchmarking Method Determines which benchmarking method management should adopt and justifies response Determines which benchmarking method management should adopt but does not justify response Does not determine which benchmarking method management should adopt 11 Articulation of
- 40. Response Submission has no major errors related to citations, grammar, spelling, syntax, or organization Submission has major errors related to citations, grammar, spelling, syntax, or organization that negatively impact readability and articulation of main ideas Submission has critical errors related to citations, grammar, spelling, syntax, or organization that prevent understanding of ideas 12 Earned Total 100% https://www.atomiclearning.com/login/snhu http://snhu- media.snhu.edu/files/production_documentation/formatting/rubr ic_feedback_instructions_student.pdf ACC 550 Milestone One Guidelines and Rubric Overview: The final project for this course is the creation of a quantitative analysis that includes an Excel spreadsheet accompanied by a memo to management. Accountants provide management with the logistics of the
- 41. business that are crucial for daily operations and a company’s overall success. In any business, it is of the utmost importance to be aware of all finances and internal processes. Cost accountants focus solely on the internal processes of a business and are tasked with eliminating any unnecessary costs in order to maximize profits. For the final project, you have been tasked with conducting a quantitative analysis that looks into the internal processes of a company. Based on your analysis, you will formulate recommendations to management that aim to improve internal processes and increase profits for the company. Prompt: For this milestone, submit a draft of the cost-volume- profit analysis (Section I of the final project), including all of the critical elements listed below. Refer to the Hampshire Company Case Study document, as this provides details on how to complete this milestone. All calculations for your quantitative analysis should be completed in the Hampshire Company Spreadsheet. You will provide a rough draft of your qualitative analysis in a Word document. Once you have completed your analysis, submit your Word and Excel documents. Specifically, the following critical elements must be addressed: I. Cost-Volume-Profit Analysis Cost-volume-profit (CVP) analysis is a useful tool for informing short-term economic planning within an organization. In this section, a CVP analysis will be conducted and used to inform business decisions and recommendations.
- 42. A. Perform a CVP analysis based on cost classifications. B. Explain how a CVP analysis can assist management with short-term economic planning. Support your response with examples from your CVP analysis. C. Accurately compute the break-even quantity and break-even revenue. D. Determine whether the company is breaking even. What are the CVP analysis implications on planning? If you would like a refresher course on using various features of Excel, sign in to Atomic Learning and type “Excel” in the search box. This will provide you with options to select the specific level of training that you need (intro, intermediate, or advanced) and the specific version of Excel that you have (e.g., 2011 or 2013). The trainings are broken down into small, meaningful chunks. Therefore, you should be able to find specific topics at each level that will meet your needs. Guidelines for Submission: The written portion of this submission must be a one- to two-page Word document with 12- point Times New Roman font, double spacing, and one-inch margins. Sources should be cited according to APA style. Use the Hampshire Company Spreadsheet to submit your calculations as an Excel file. Instructor Feedback: This activity uses an integrated rubric in Blackboard. Students can view instructor feedback in the Grade Center. For more information, review these instructions. http://snhu-
- 43. media.snhu.edu/files/course_repository/graduate/acc/acc550/acc _550_hampshire_company_case_study.docx http://snhu- media.snhu.edu/files/course_repository/graduate/acc/acc550/acc _550_hampshire_company_spreadsheet.xlsx https://www.atomiclearning.com/login/snhu http://snhu- media.snhu.edu/files/production_documentation/formatting/rubr ic_feedback_instructions_student.pdf Rubric Critical Elements Proficient (100%) Needs Improvement (75%) Not Evident (0%) Value Cost-Volume-Profit Analysis: Analysis Performs a cost-volume-profit analysis based on cost classifications Performs a cost-volume-profit analysis, but it is not based on cost classifications Does not perform a cost-volume-profit analysis 22 Cost-Volume-Profit Analysis: Economic
- 44. Planning Explains how a CVP analysis can assist management with short-term economic planning and supports response with examples Explains how a CVP analysis can assist management with short-term economic planning but does not support response with examples, or explanation is cursory or inaccurate Does not explain how a CVP analysis can assist management with short-term economic planning 22 Cost-Volume-Profit Analysis: Break- Even Accurately computes the break-even quantity and break-even revenue Computes the break-even quantity and break-even revenue, but there are issues with accuracy Does not compute the break-even quantity and break-even revenue 22
- 45. Cost-Volume-Profit Analysis: Implications Determines whether the company is breaking even and identifies cost-volume-profit analysis implications for planning Determines whether the company is breaking even but does not identify cost-volume-profit analysis implications on planning, or determination or identification contain issues with accuracy Does not determine whether the company is breaking even 22 Articulation of Response Submission has no major errors related to citations, grammar, spelling, syntax, or organization Submission has major errors related to citations, grammar, spelling, syntax, or organization that negatively impact readability and articulation of main ideas Submission has critical errors related to citations, grammar, spelling, syntax, or organization that prevent understanding of ideas