Cor 1232 g dx presentation, aao 06
•Télécharger en tant que PPT, PDF•
1 j'aime•365 vues

![GPA TM Progression tools can help ,[object Object],[object Object],[object Object],[object Object],Why GPA TM Progression Analysis for GDx](data:image/gif;base64,R0lGODlhAQABAIAAAAAAAP///yH5BAEAAAAALAAAAAABAAEAAAIBRAA7)
Recommandé
Contenu connexe
En vedette
En vedette (20)
Similaire à Cor 1232 g dx presentation, aao 06
Similaire à Cor 1232 g dx presentation, aao 06 (20)
Plus de Hossein Mirzaie
Plus de Hossein Mirzaie (20)
Dernier
Dernier (20)
Cor 1232 g dx presentation, aao 06
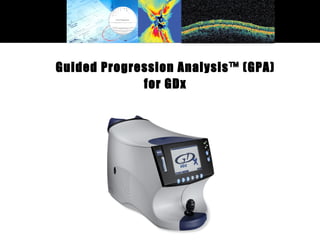
- 1. Guided Progression Analysis™ (GPA) for GDx
- 4. = Possible Progression = Likely Progression (design specificity 95%) with clear, concise summary of Progression. Identify progressing patients Simulated data.
- 6. Determine the rate of progression Simulated data. to identify patients at risk.
- 7. Assess treatment effectiveness Simulated data. by comparing rates before and after treatment. Before : -3.9 microns/yr ± 1.1 After : -1.8 microns/yr ± 1.1
- 11. Courtesy of Robert N. Weinreb, MD Felipe A. Medeiros, MD, PhD Hamilton Glaucoma Center University of California at San Diego GDx Progression: Case Examples
- 15. GPA TM tools integrate your structure and function analysis by using consistent terms and rules. Extending GPA TM across structure and function