Eurostat house index 3q 2012
•
0 j'aime•10,716 vues

I prezzi delle case in Europa. per maggiori info: http://www.idealista.it/news/archivio/2013/01/31/071309-prezzi-delle-case-europa-litalia-nel-gruppo-mattone-calante

Recommandé
Recommandé
Contenu connexe
Dernier
Dernier (20)
En vedette
En vedette (20)
Eurostat house index 3q 2012
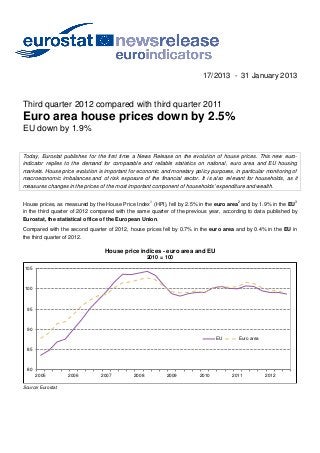
- 1. 17/2013 - 31 January 2013 Third quarter 2012 compared with third quarter 2011 Euro area house prices down by 2.5% EU down by 1.9% Today, Eurostat publishes for the first time a News Release on the evolution of house prices. This new euro- indicator replies to the demand for comparable and reliable statistics on national, euro area and EU housing markets. House price evolution is important for economic and monetary policy purposes, in particular monitoring of macroeconomic imbalances and of risk exposure of the financial sector. It is also relevant for households, as it measures changes in the prices of the most important component of households' expenditure and wealth. 1 2 3 House prices, as measured by the House Price Index (HPI), fell by 2.5% in the euro area and by 1.9% in the EU in the third quarter of 2012 compared with the same quarter of the previous year, according to data published by Eurostat, the statistical office of the European Union. Compared with the second quarter of 2012, house prices fell by 0.7% in the euro area and by 0.4% in the EU in the third quarter of 2012. House price indices - euro area and EU 2010 = 100 105 100 95 90 EU Euro area 85 80 2005 2006 2007 2008 2009 2010 2011 2012 Source: Eurostat
- 2. House price developments in the EU Member States Among the Member States for which data are available, the highest annual increases in house prices in the third quarter of 2012 were recorded in Estonia (+8.4%), Luxembourg (+7.1%) and Finland (+2.1%), and the largest falls in Spain (-15.2%), Ireland (-9.6%), the Netherlands (-8.7%) and Portugal (-7.7%). The highest quarterly increases in the third quarter of 2012 were recorded in Estonia (+2.6%), Latvia (+2.3%), the United Kingdom (+1.7%) and Ireland (+1.6%), and the largest falls in Romania (-4.2%), the Netherlands (-3.9%) and Spain (-3.7%). Quarterly and annual house price developments Percentage change compared with the Percentage change compared with the previous quarter same quarter of the previous year 2011 2012 2011 2012 Q4 Q1 Q2 Q3 Q4 Q1 Q2 Q3 Belgium -0.2 0.8 0.1 1.1 3.4 3.5 2.6 1.8 Germany 0.7 0.8 : : 4.2 2.2 : : Estonia 1.0 1.3 3.3 2.6 11.8 7.2 7.6 8.4 Ireland -5.3 -4.1 -2.0 1.6 -16.6 -16.3 -14.4 -9.6 Greece : : : : : : : : Spain -4.1 -5.0 -3.3 -3.7 -11.1 -12.5 -14.4 -15.2 France -0.9 -1.3 0.0 0.9 3.7 1.7 -0.2 -1.3 p Italy -0.7 -0.6 -0.8 -1.1 0.3 -0.2 -2.1 -3.2 Cyprus : : : : : : : : * Luxembourg 4.7 -0.5 1.7 1.1 6.4 5.4 4.3 7.1 Malta -2.4 1.7 1.2 0.3 0.3 1.5 0.7 0.8 Netherlands -1.7 -1.9 -1.5 -3.9 -3.4 -5.4 -5.4 -8.7 Austria -2.8 : : : -5.9 : : : p Portugal -2.8 -1.9 -2.4 -0.9 -4.0 -7.1 -8.3 -7.7 Slovenia -0.5 -4.1 1.1 -2.6 1.3 -7.1 -5.8 -5.9 Slovakia -1.4 -0.2 -0.9 0.7 -2.3 -2.6 -2.0 -1.8 Finland -0.9 1.8 1.1 0.2 1.9 2.4 1.7 2.1 p Euro area -1.0 -0.7 -0.1 -0.7 -0.1 -0.9 -2.1 -2.5 p Bulgaria -1.5 0.1 0.4 -0.1 -5.8 -3.7 -1.6 -1.1 Czech Republic -1.0 -0.5 0.0 -0.6 -0.9 -1.5 -2.1 -2.1 Denmark -3.4 0.4 1.5 0.3 -6.6 -5.1 -5.3 -1.2 Latvia -5.6 6.5 -3.0 2.3 3.6 5.5 0.6 -0.2 Lithuania 0.7 -0.3 -1.0 0.9 5.5 0.9 -0.8 0.3 Hungary -0.4 : : : -2.9 : : : Poland c c c c c c c c Romania -4.5 3.8 -0.7 -4.2 -17.1 -9.5 -8.9 -5.7 Sweden -2.3 1.4 1.2 0.7 -1.8 -0.6 -0.1 0.9 United Kingdom -1.1 0.0 1.2 1.7 -0.4 0.5 2.0 1.8 p EU -1.1 -0.4 0.0 -0.4 -0.6 -0.9 -1.6 -1.9 Iceland 2.1 1.1 2.1 1.3 7.2 8.9 7.6 6.7 ** Norway -0.4 3.5 4.4 0.9 8.0 6.3 7.9 8.5 * only flats ** only existing dwellings p provisional c confidential Source: Eurostat
- 3. 1. The House Price Indices (HPIs) describe the price developments of all residential properties purchased by households (flats, detached houses, terraced houses, etc.), both newly built and existing, independently of their final use and independently of their previous owners. The Member States’ HPIs are compiled by the National Statistical Institutes. The euro area and the EU aggregate HPIs are compiled by Eurostat. HPIs are computed as annual chain indices allowing weights to be changed each year. The European HPI aggregates are currently calculated as weighted averages of the national HPIs using as weights the GDP at market prices (based on millions PPS) of the countries concerned. Missing country data is estimated by Eurostat using data from non-harmonised sources. These estimates are not published but are used to calculate Euro area and EU aggregates. The Member States’ HPIs are compiled following a harmonised methodology. The methodology is summarised in the Handbook on Residential Property Price Indices: http://epp.eurostat.ec.europa.eu/portal/page/portal/hicp/methodology/hps/rppi_handbook and in a Technical Manual available on the Eurostat website in the Housing Price Statistics dedicated pages: http://epp.eurostat.ec.europa.eu/portal/page/portal/hicp/methodology/hps/owner_occupied_housing This quarterly News Release is complemented by a Statistics Explained article on the Eurostat website: http://epp.eurostat.ec.europa.eu/statistics_explained/index.php/Housing_price_statistics_-_house_price_index 2. The euro area initially included Belgium, Germany, Ireland, Spain, France, Italy, Luxembourg, the Netherlands, Austria, Portugal and Finland. Greece was included from 1 January 2001, Slovenia from 1 January 2007, Cyprus and Malta from 1 January 2008, Slovakia from 1 January 2009 and Estonia from 1 January 2011. 3. The EU included 15 Member States until April 2004, 25 Member States from May 2004 until December 2006 and 27 Member States from January 2007. Issued by: Eurostat Press Office For further information on data and methodology: Louise CORSELLI-NORDBLAD Bogdan MAROLA Tel: +352-4301-33 444 Tel: +352-4301-34 955 eurostat-pressoffice@ec.europa.eu estat-real-estate@ec.europa.eu Eurostat News Releases on the internet: http://ec.europa.eu/eurostat Selected Principal European Economic Indicators: http://ec.europa.eu/eurostat/euroindicators
- 4. Annex: Methodology of compilation of the House Price Index With this News Release Eurostat issues for the first time information on the development of house prices in the euro area and in the European Union. From now on, the House Price Index (HPI) will be published on a quarterly basis. The release of the HPI is based on a legal framework, on the methodology described in the Residential Property Price Indices manual and on the practical implementation guidelines compiled by Eurostat. Data are provided by EU National Statistical Institutes. European aggregates are compiled by Eurostat. Background In recent years, the analysis of housing markets has intensified as has the demand for high quality statistics on national, euro area and EU housing, in particular on residential property price indices. Eurostat and the NSIs have been working together since 2002 on a series of pilot projects to set up a system to provide harmonised House Price Indices at European level. Prior to this work, there was very little comparability between national data on housing price developments within the EU. The development of comparable and timely statistics on changes in house prices has been considered an essential target for European statistics. Scope The terms 'residential property price', 'house price' and 'dwelling price' are used interchangeably to describe the price developments of all residential properties purchased by households (flats, detached houses, terraced houses, etc.), both new and existing, independent of their final use and independent of their previous owners. The emphasis is on market prices, with non-market prices being ruled out from the scope of the House Price Indices (self-build dwellings are therefore excluded). The prices of dwellings include the price of the land component. Computation of house price indices The first and most important issue in the compilation of HPIs is the availability of data on dwelling purchases. This refers to information about the price of the transaction and the dwelling characteristics. The dwelling characteristics which most influence price are the type of dwelling (flat, detached house, terraced house, etc.), its size and location. A second issue is the heterogeneity of the housing market, where virtually every dwelling bought and sold is different from the others in some respect. Therefore a quality adjustment from one time period to the next is needed and is a major methodological consideration in compiling house price indices. The HPI should be seen as an index measuring price developments for dwellings transacted in the market. It includes transactions of both new and existing dwellings, and the prices of dwellings include the land component. To summarize, the main technical characteristics of the HPI are: The price of land is included in the price and in the weight (gross acquisition concept); Only actual transactions of dwellings are covered; Market prices for residential properties are covered, while non-market prices are ruled out of the scope of the HPI; The focus is on the measurement of price developments for all residential properties purchased by households, independent of their final use; so dwellings bought by households for uses other than owner- occupancy, for example for investment, are included; All purchases of new and existing dwellings are to be considered, independent of their previous owner; Prices cover the acquisition cost of a property in itself, and not the total cost that is necessary to acquire, own and maintain a residential property; so other costs related to the acquisition of the property and major repairs are ruled out from its scope. For further information see the Statistics Explained article on the euro area and EU house price indices: http://epp.eurostat.ec.europa.eu/statistics_explained/index.php/Housing_price_statistics_-_house_price_index