SlideShare une entreprise Scribd logo
1  sur  9
Télécharger pour lire hors ligne
International Journal of Computational Engineering Research||Vol, 04||Issue, 2||

Electronic Waste Status in Jharkhand Cities
1

Umesh Kumar, 2Dr D N Singh,

1

Electronics & Communication Engg, Dept of Science & Technology,
G W P Ranchi Tharpakhna, Ranchi 834001
2
Jt Secretary, Dept of Science & Technology, SBTE, Patna

ABSTRACT:
The use of Electrical Electronic Equipments (EEE) in day to day life is increasing and changing with rapid
and frequent changes in technology. Like any product these EEE have also their life and at end of life when
they lose their credibility and usability turn to waste and are popularly known as Electronic Waste (e waste).
These e wastes contain many toxic and hazardous constituents in it which are dangerous and harmful to
health and environment. The e wastes are day by day increasing and are posing threats to the mankind by
increasing the pollution. India being developing country with extreme poverty and has vast unskilled
manpower ready for doing any work without knowing the hazards is more liable to risks of the e wastes. In
India also we notice the various states representing the various levels of economic strata and affordability.
The developed states are moving towards managing e wastes through regulations but the less developed
states lacks on this front also. The study of the Jharkhand developed cities and relatively less developed cites
has been carried out. The study reveals that the maximum volumes and weights of the e wastes are from the
larger and bigger EEE products i.e. AC, Refrigerator, Washing Machine etc. The major eight products
present in everyone’s life have been considered in this study. The reuse and recycle takes place in formal and
informal sectors. 95 % of recycling is done in informal sector which is performed and actuated in most toxic
and hazardous environment. The extended producers responsibility (ERP) which requires the producer or
propagators to take back e wastes for recycling or disposal as buy back with fees or without financial
initiatives is day to day becoming fact and figure for strict requirement for proper tackling of e wastes. The
lack of knowledge of the user that wastes of EEE also have reusable components can entitle them good return
often lead to ignorance of consumers to hand back to the manufacturer and lack of market of reusable
components among the manufacturers also leads to e waste in bulk though meaningful components can be
extracted and reduction of waste volumes can be noticed. The main concerns are the following of western
thinking of “one size fit all”, eco label initiative or oligopoly approach of Indian Government and pollution
control boards. The large scale imports with inappropriate technology and imports of junks in name of up
gradation from developed countries lead to increased e waste. The employment generation, lack of job
1. potential and poverty compels the user and workforce to drive themselves into these.The status of Jharkhand
is also same as there is no specific state government initiative for tackling the e wastes. The production of e
waste is in line of any other state in India. The scenario of this state is in confirmation to the states of affairs
in the developing states category, if India has developed, developing and underdeveloped states.The worst
sufferers are the common man and the poor users who inherit the junk in name of technological upgradation
and making the life easier by automating the lifestyle.

KEYWORD: EEE, e waste, Environment, Technology, End-of-life, Disposal, Household,
Discard, Pollution.

||Issn 2250-3005 ||

||February||2014||

Page 29
Electronic Waste Status in…
I.

INTRODUCTION

The rapid growth & industrialization and desire of common man to lead a easy life leads to the boom in the rapidly
growing electronics in particular and electrical and electronic equipments (EEE) and information technology industry is the
fastest growing sector in particular. The information technology industry in India is equally prominent sector as witnessed in
the global scenario. The influx of leading multinational brands and companies in the manufacturing sector of these EEE has
reported as a result of changing policies and exchange of R&D facilities. The advancement in technology results in increase
in updated EEE products and this leads to a situation of obsolesce of old products as they lose their usefulness and this leads
to end of life rise and hence generation of Waste of Electrical & Electronic Equipments (WEEE) i.e. electronics waste (e
waste).The popular EEE products include computers, laptops ,Printers, mobiles , electronic gadgets, televisions, VCRs,
DVD, stereos, copiers, fax machines, lamps, audio equipment , electronic toys , electrical home appliances, electric
equipments and batteries etc. The recent past has witnessed accelerated manifold growth of e waste. Various factors for rise
of e waste includes the imports of used and obsolete EEE products in name of technology up gradation aimed to the third
world counties who have vast potential of consumerisation or market from the developed countries. The e waste amounts to
2.7. to 3 % of the total waste whose handling itself is a complex phenomenon. The issue of e waste handling are
concentrated at manufacturer, distributor or consumer levels. The initiative of the regulatory mechanism for such issues is
being talked about and are at initial stage only. The consumer handling of e waste is itself a complex issue as the e wastes
constitute hazardous elements also. The making use of products at various levels and through various techniques includes its
recycling; reuse and sometimes mixing of components for making it usable are prevalent in India, though are rarely evident
in the developed countries. The developed nations mostly follow use and throw policy. The dependence on the EEE is still a
status symbol and its affordability is to the elite and economically affordable section of the society only. The economical
betterment and affordability of citizens is creating larger markets for EEE. The gray market mostly for the computers where
assembled computers market is evident, resale and reuse is prominently evident. The survey and research for estimation of e
waste is only taken up by limited organizations and are in stray condition. This is the sole reason that we lack reliable data of
e waste and e waste generation.
The Information Technology (IT) sector is the most promising sector which is generating employment. The
outsourcing of software development and solutions are day by day outreaching the far flung areas. The needs and changes
are faster and this results in increased demand of optimized and recent hardware and software. Hence this sector is another
area which is responsible for the e waste generation. The availability of finance and increase in affordability as the EEE
prices are lowering down the tendency of procurement of new TV sets, mobiles, house hold appliances, electronic toys and
other EEE are increasing many fold. With increase in consumption pattern e waste generation is also resulting.Jharkhand
state has many cities like Jamshedpur, Ranchi, Bokaro, Dhanbad which are at high peaks of economic activity at one end and
other cities like Dumka, Daltongang, Hazribagh, Ramghar are at lesser peaks. The cities in the vicinity of developed cities
and well connected metros are developing as potential centres of software and hardware development in the IT sector and
have traditional consumers of EEE. The industrial giants, hubs in the cities and rising network of BPO throughout state are
creating high end society are also responsible for growth of EEE consumers and networks. As rough estimate the state has
more than 800 numbers of software industries/ developers and numerous hardware industries/organisations established and
several (BPO’s) companies with more than fifty thousand employees. State cities like Jamshedpur, Ranchi, Dhanbad and
Bokaro have emerged as important destination and or hub for reuse recycling of EEE and as a result e-waste generator. The
reuse and recycling centers available in the areas are in informal and unorganized sectors only. Instances of shifting the
ewastes to nearby metro are also in sight. The informal and unorganized sectors involvement in the recycling sector is
leading to pollution and hazardous environment and is causing health concerns to the workers and persons involved in it. The
higher consumption and disposal rates of the consumers are responsible for increased growth of e waste. Immediate concerns
for the health and pollution and strict measures for the pollution control and proper recycling and reuse technology and
training to personals is the emergent need of the day. The work being reported here is based on the exploratory sample
estimation of e waste generation in the state.

II.

PRESENT E WASTE SCENARIO AND CONCERNS / TRENDS

As an estimate the e waste amount piled up in India is 800000 tones in India in 2012 as per
Manufacturers Association of Information Technology Companies (MAIT) and GTZ study. The e-waste
strategic Management Systems in the key developing and underdeveloped countries can be seen as a
comparative way among sets of countries can be as depicted in the table 1. The table shows a comparative view
of Prevailing overall Technology, E waste Management , Actors , Formal e waste collection, Disposal /
dumping sites, techniques , uniqueness financial aspects and legal framework and its adherence in the India ,
China very fast developing country, south Africa example of third world nations and Switzerland sample of
developed nation has been briefly outlined.

||Issn 2250-3005 ||

||February||2014||

Page 30
Electronic Waste Status in…
Table 1 Approach Details of India, Developing country China, Third World Country S Africa Developed Country
Switzerland
Important aspect
Technology

India
Mostly borrowed , few
indigenous
Semi Organised in
metropolitans but
unorganized in other areas

China
Indigenous and
borrowed
Only organized in urban
areas

Partly specific through
unorganized and informal
Manufacturers, distributors,
traders, importers,
consumers, formal and
informal recyclers and scrap
dealers.

Non specific but Semi
organized
Manufacturers,
distributors, traders,
importers, consumers,
recyclers, scrap dealers
and disposers.

Formal e waste
collection centres

Mostly under Pollution
control boards

EMPA, GTZ and
EECZ

Disposal / dumping
sites
Disposal site
technologies
Uniqueness

Mostly in landfills

Municipal sites and
mostly illegal sites
No legal methods

Prevailing overall
waste management
system

E waste management
Actors

No proper collection system

Financial Uniqueness

Reusable and secondary raw
material segregation
Lacking of defined system

Multiple conditioning
and refining process
Individuals are paid for
the collected e waste

Legal framework and
adherence alertness

100% prohibited in principle
but no definite adherence

Legally imports
prohibited

South Africa
Borrowed
Mostly unorganized

Not specific
Distributors, traders,
importers, consumers,
recyclers, collectors,
sorters and disposers.

DESCO Electronic
recyclers ND
Universal recycling
co.
In Landfills
Permitted sites with
technology
Unique processing and
screening
Payments are made by
metal scrap dealers for
the metals in the waste
Stringent laws but
loose in adherence

Switzerland
Developed , trans boarder
migrated
Organized ,
Swiss Association for
the Information,
Communication and
Organizational
Technologies
(SWICO) system
Not specific
Manufacturers,
distributors, traders,
importers, consumers,
recyclers, licensed
collectors and licensed
dismeltors and refiners.
SWICO and SENS
(Swiss Foundation for
Waste Management)
In Landfills
Systematic and meticulous
process
Landfill capacity
adherence
Provision of Advanced
Recycling Fees (ARF)
Strict tougher laws and
adherence to norms

The e waste scenario as per various studies available till 2012 for all the states in India in terms of percentage of
the total production of e waste (in India) can be viewed as mentioned in Table 2.
Table 2 Showing Details of State wise E Waste Contribution in India
Sl
1
2
3
4
5
6
7
8
9
10
11
12
13
14
15
16
17
18

States
Maharashtra
Tamil Nadu
Andhra Pradesh
Uttar Pradesh
West Bengal
Delhi
Karnataka
Gujarat
Madhya Pradesh
Punjab
Rajasthan
Kerala
Haryana
Bihar
Orissa
Assam
Chhattisgarh
Jharkhand

||Issn 2250-3005 ||

WEEE in % in India
13.88121
9.235316
8.751912
7.108937
6.888625
6.662478
6.244472
6.159256
5.341829
4.765149
4.332633
4.226421
3.086305
2.092461
2.011792
1.490594
1.472242
1.384383

Sl
19
20
21
22
23
24
25
26
27
28
29
30
31
32
33
34
35

States
Uttarakhand
Himachal
Jammu & Kashmir
Goa
Tripura
Chandigarh
Pondicherry
Meghalaya
Nagaland
Arunachal Pradesh
Andaman Nicobar
Mizoram
Manipur
Sikkim
Diu & Daman
Dadar & Nagar Haweli
Lakshadweep

||February||2014||

WEEE in % in India
1.123886
1.092317
1.041916
0.292682
0.259058
0.246321
0.194619
0.144903
0.099364
0.090188
0.063138
0.054647
0.05451
0.053483
0.02794
0.019928
0.005067

Page 31
Electronic Waste Status in…

Figure Showing percentage representation of E waste generation in India state wise

III.

JHARKHAND STATE CITIES STUDIES AND DATA OUTLINES

The following strategies were employed for data collection and studies:1. Questioner were developed and data’s based on the questioner were received basically from the diversified
socio economic groups across the sections for proper ascertaining practical sample data of the state so far
practicable particularly from the following groups
a) Households,
b) Business organizations & institutions including offices
c) Manufacturers, Importers / exporters, EEE collectors, EEE second-hand shops, EEE repair shops, Recyclers
/ dismantlers, Processors of recyclable materials, Re-users, R&D units and similar institutions.
2. Selective interview with the selected group were conducted to ascertain the facts and figures and principle
of thoughts
3. The purchasing pattern, recycling, reuse and disposal practices were collected i.e. ascertained
Broadly main seven types of consumer commodity of EEE were considered for determination of pattern of
e waste disposal. The seven EEE are Computers inclusive of monitors (LCD / CRT both types),Laptops,
Mobiles , Refrigerators , Air conditioners (AC) , Batteries including the mobile batteries.
In all 300 sets of questioners in equal numbers i.e. 100 each to the mentioned three groups were sent
through email, post and distributed manually.
Responses from the three categories of target groups are as follows mentioned in the table
In household category for the eight cities total of 800 questionnaires supplied 734 were received back. The
responses mentioned in table 4 are mainly the response that reflects the mood of the consumers on individual
basis. Business organizations & institutions including offices: Out of total 800 targets the 600 receipts reveals
the mood of the bulk user and policymakers. The details of responses are in table 5.The Manufacturers,
Importers / exporters responses are in conformity of the e waste generation as it was most likely that the e waste
would be nil only as the EEE products are not put to use themselves and are extended to others only for
conversion to e waste after extensive use and handling, recycling and reuse. The details are in table 6.
Table 3 Showing the Responses in the three Segments Identified and Planned
Household
City

Jamshedpur
Ranchi
Dhanbad
Bokaro
Hazaribagh
Ramghar
Daltonganj
Dumka

||Issn 2250-3005 ||

Questio
nnaire
sent
100
100
100
100
100
100
100
100

Questio
nnaire
received
95
99
94
96
95
93
94
86

Business organizations & institutions
including offices
City
Question
Questionn
naire sent
aire
received
Jamshedpur
100
90
Ranchi
100
87
Dhanbad
100
88
Bokaro
100
78
Hazaribagh
100
67
Ramghar
100
56
Daltonganj
100
73
Dumka
100
61

||February||2014||

Manufacturers, Importers/exporters
etc.
City
Questionn Question
aire sent
naire
received
Jamshedpur
100
89
Ranchi
100
92
Dhanbad
100
94
Bokaro
100
89
Hazaribagh
100
81
Ramghar
100
78
Daltonganj
100
74
Dumka
100
86

Page 32
Electronic Waste Status in…

Figure depicting distributed and received questionnaire for individual three groups

IV.

DETAILS OF SAMPLE SURVEYS

In Sample survey for household e wastes all together 800 questionnaires were sent and in all 752 were received
i.e. 48 did not reply.
In case of business organizations and institutions the received number was 600 i.e. 200 chose not to reply.
In the manufacturers, importers / exporters etc category it was 683 indicates that 117 were non responsive.
Reusers / Recyclers/ Second hand market holders Questionnaires
In this category mainly four groups existed and they were
a. Scrap metal collectors
b. Second hand repair shops
c. Formal pollution board listed/licensed vendors and
d. Informal vendors active in this field.
Mostly the details were collected by the interview of such groups. The questionnaires were not responded and to
collect data interview was only option left. The volumes and weight of the e wastes calculated in this study are
as per the report of UNEP volume I published.
Details of collected data for the eight listed segments of the e waste are as mentioned in the tables listed here
under.
Table4 Showing E waste generation from household

Components

Computers
with monitors
Laptops
Printers
Mobile
phones
TV
Refrigerator
AC
Washing
machines
Total e waste

Household sector e waste survey ( Total received records 752 from all the 8 districts)
Large scale
Medium scale
Small scale
Use
Repaire E waste Used Repaired/ E waste Used
Repaired
E
d
d/discar
discarded
/
waste
ded
discarded
409
121
3533.2
131
26
75.92
12
3
8.72
242
54
105
2
143
6
259
498
256

67
11
246

234.5
55
922.17

98
23
678

23
12
154

80.5
60
12.63

32
9
890

4
2
341

14
10
27.96

203

4060

1231

401

802.0

776

456

91.2

37
53
23

1110
1065
460

328
541
349

41
48
71

123
94.6
92

35
4
80

6
2
36

18
1.2
6.4

11439.87 kg/yr

1340.67 kg/yr

177.48 kg/yr

The major e waste generated in this segment is in the TV field followed by computers although the mobile users
was the second largest i.e. after TV. The e wastes figures from the Jamshedpur and Ranchi cities were largest
compared to the cities of Ramghar showing the least one. His understandably so as the availability of the
products and paying capacity of the members in the cities of Jamshedpur and Ranchi are higher compared to the
other cities.

||Issn 2250-3005 ||

||February||2014||

Page 33
Electronic Waste Status in…
Table 5 showing E waste generation from Business organizations & institutions including offices
Components
Used
Computers with
monitors
Laptops
Printers
Mobile phones
TV
Refrigerator
AC
Washing
machines
Total e waste

21265

Software sector e waste survey ( Total received records 75 from all the 8 districts)
Large scale
Medium scale
Small scale
Repaired /
E waste
Used
Repaired /
E waste
Used
Repaired /
discarded
discarded
discarded
2098
61802
987
112
3360
298
46

9826
872
748
357
67
189
23

965
176
89
91
23
41
9

3377.5
880
7.3
3276
1108
1640
180

421
321
173
162
46
56
11

72271.8 kg/yr

46
38
56
16
18
32
2

161
190
4.59
756
540
1280
40

68
121
114
75
41
12
3

6151.59 kg/yr

E waste
1343

23
28
41
4
23
4
1

80.5
140
3.36
144
690
160
20

2580.86 kg/yr

As the major business, official and educational organizations are situated in the Jamshedpur, Ranchi and
Dhanbad cities the bulk users are in the computer and laptop segments. These sections show the major e waste
generations also. The small cities like Ramghar and Dumka generated lower e waste in this segment.
Table 6 Showing E waste generation from Manufacturers, Importers/exporters etc.
Components

8046

Software sector e waste survey ( Total received records 75 from all the 8 districts)
Large scale
Medium scale
Small scale
Repaired/
E waste
Used
Repaired /
E waste
Used
Repaired /
discarded
discarded
discarded
03
Returned
1208
6
Returned
1561
4

0

3471
4847
16123
11347
6711
958
3218

2
7
8
7
4
2
3

0
0
0
0
0
0
0

Used
Computers with
monitors
Laptops
Printers
Mobile phones
TV
Refrigerator
AC
Washing
machines

Returned
Returned
Returned
Returned
Returned
Returned
Returned

189
231
431
2028
0
871
592

0
0
2
39
0
9
7

0
0
Returned
Returned
0
Returned
Returned

0
0
0
1091
0
0
682

0
0
0
81
0
0
43

E waste

The major manufacturer/importer/exporter units are located in Jamshedpur followed by Ranchi and Dhanbad.
The connectivity of Jamshedpur and Dhanbad to Kolkata is easier and hence these cities were better having
facilities of returning the damaged products. The company owned maintenance and service centres are mostly in
Ranchi followed in Jamshedpur. The Dhanbad is well connected to Kolkata so the service providers are mostly
attending form there only.
V.
SEGMENT WISE RESULTS AND DISCUSSIONS
Household: Survey of total of 752 out of 800 houses to get a trend of generation of e waste was done. Here the
number of family members count divided the large, medium and small section. The overall trend for these
shows that the EEE are in properly maintained conditions. They often get repaired when they get defects. The
authorized centres personals come for the repairing.The care and frequency are the sole causes of low generation
of e waste. The outdated Computers , Laptops Printers , TV AC etc get exchanged in the market and often get
their reflection as e waste in the next group where we dealt with the reusers and recyclers etc. The table shows
the details of use and e waste generation. The e waste generation is from the products which came from the gray
market. The items and products of the standard companies did not contribute much to the e waste. The
Maximum of e waste generated in computer is because of the low life span and fast technology upgradation and
tendency that the latest version of software are not supported by the

||Issn 2250-3005 ||

||February||2014||

Page 34
Electronic Waste Status in…

Figure showing Household E waste details

Old computers which offer low generation and lesser speed peripherals. The choice of lesser repairs is also
reason for e-waste generation. In case of TV the changing pattern of consumers for changing technology is the
basic cause of shifting of product to lower groups and ultimately resulting in the obsolesce i.e. e waste. The
refrigerator is the other EEE product which often gets converted to e waste as the repairing cost is high and
recovery of the items is easy and volumes of metallic part results in the major e waste by weight and volume.
The second hand market is not that high.
Methods of disposal of EEE in the sample survey of 752 studies noticed is as mentioned herein :

Activity
Disposable EEE keep in
house
Send to manufacturer
To Repair/ Recycle centre
Transfer to relative
Charity transfer
Waste bins
Others

Frequency
111

Percentage
14.76

36
99
54
72
293
87

4.79
13.16
7.18
9.57
38.96
11.57

Figure showing Disposal Activity Freq. & Percentage

Business organizations & institutions including offices: The survey for the 800 sent information
questionnaire out of which 600 were received details / information were gathered. The trends of e waste
generation percentage and volume can be explained in different ways. The volume wise e waste generation is
maximum in computers and printers followed by TV, AC, fridge, printer, washing machine and mobile.
The e waste generation percentage wise is maximum in Refrigerator section followed by AC, TV, Washing
machine, Computers, Printers, laptops and Mobile. The amount of e waste generated is understandably largest in
the large scale sector and minimum in small sector.

Figure howing e wsate in Business etc organisations
||Issn 2250-3005 ||

||February||2014||

Page 35
Electronic Waste Status in…
E waste generation from Manufacturers, Importers/exporters etc: In this category we observe that since the
products are not in use and only few in transportation get damaged and hence require repairs. The e waste
produced is nonexistent in this case. The damaged items are returned back to the importers / exporters /
manufacturers or assemblers. These parties make use of the new parts to other unit and hence the e waste is
negligible. The branded parties and reputed assemblers of the area and region were only contacted hence the real
story of the very small or cottage type industries scenario could not be studied.

VI.

CHALLENGES, CONCERNS AND ECONOMICS OF E WASTES

The mammoth growth and arising concerns for the Electronics Waste in a sustainable and sound
environmental technological development with updating processing advancements and growth of use and throw
mindset is increasingly making e waste management task bit challenging one. The outburst of hazardous toxic
constituents of the e wastes in the environment has proved that we have failed to strike balance between safety,
cost and advancement of technology with proper environment protection for green world. We need to address
the facts of reduction of e waste through recovery, reuse and recycle to minimize toxic substances in order to
arrive at technology for such labour intensive and safe product development with enhanced participation of
stakeholders in fixing responsibility of managing e waste in more sensible manner. The e waste gets recycled in
formal and informal sectors. As per initial estimate 90-95 % of e-waste gets recycled in India in the informal
sector which is performed and actuated in highly hazardous conditions. The e waste is one which simultaneously
posses threat and opportunity at same time. It contains different hazardous and toxic elements responsible for
even health problem, if not properly treated and managed. The positive aspect of e waste is that E-waste also
offers employment and handsome returns and offers great opportunity to small manufacturers in formal and
informal sectors by providing means of supply of many inputs, recovered through recycling and dismantling
process, at a vary cheaper rates.
Remains and scraps of the end of life products are the main source of e waste, in other words one can
say that products which suffers from the technological obsolescence and permanent damage conditions results in
e waste. Separate designated location for storage of e waste becomes inevitable. The extended producers
responsibility which entitles the manufacturers or its importers / agents to take back e wastes for disposal as buy
back or otherwise arrangement is day by day becoming fact and figure for strict requirement. The lack of
awareness of the contents and toxicity and hazardousness among the users sometimes becomes consumer’s
ignorance for the handing over of the product even in case of buy back offers. The lack of knowledge of the
user that wastes of EEE also have reusable components can feed them good return often lead to ignorance of
consumers to hand back to the manufacturer and lack of market of reusable components among the
manufacturers also leads to e waste in bulk though meaningful components can be extracted and reduction of
waste volumes can be noticed. The response of the lack of awareness among the users and manufactures were
noticed in the responses received. The proper awareness about belongingness of e wastes among the handler
group was divided i.e. they are not fully aware that to whom this belongs and so was the case among the
consumers / user. The situation of regulations and strictness of adherence was also divided lot. The overall
reaction is that the “it carries” is the situation among the different groups. The Indian business leaders are
reluctant towards e waste handling and its proper management. The duty of user is to handle the e waste is
feeling in majority of the business leaders. The main concerns are the following of western thinking of “one size
fit all”, eco label initiative or oligopoly approach of Indian Govt. and pollution control boards. The large scale
imports with inappropriate technology and imports of junks in name of upgradation from developed countries
lead to increased e waste. The monopoly and oligopology lukewarm approach of dominant players in cases
environmental regulations and weak loopholes in the regulatory mechanism and governmental initiative for
creating proper awareness among users are the main concerns.
The employment generation, lack of job potential and poverty compels the user and workforce to drive
themselves into these. The underdeveloped or least developed countries are since not having more sophisticated
gadgets and EEE so the level of pollution is low and can afford cuts in the pollution levels for the developed
nations. The environmental protection from pollution among the developed and under developed nation has
given rise to economics in needed items and trade. The health and aesthetic reasons for environmental protection
has become luxury of the developed nations. The reduction of pollution is increasingly becoming need of these
nations as they are becoming experimental grounds of the developed nations.

||Issn 2250-3005 ||

||February||2014||

Page 36
Electronic Waste Status in…
VII.

CONCLUSIONS

In the study regarding the e waste in the Jharkhand it came out that the situation is no different from the
other states in India. There is lack of proper awareness among the users about the hazardousness and toxicity of
the EEE products resulting in e wastes. There is lack of proper regulatory and awareness (propaganda)
mechanism in the areas and requires that the manufacturers / agencies the governmental agencies who owe the
responsibility to protect the consumers / users setup cells throughout in general and in each district in particular.
The principle of polluter’s pays and extended producer responsibility should be strictly implemented. The green
technology and appropriate technology for information technology industries and similar organizations be
implemented so that minimum e waste is generated. The reuse and recycle capacity and tendency must be
applauded and increasingly adopted. The educational establishments, hospitals government establishments and
common users must be encouraged to store and collect the e wastes separately and safely handled. The extended
producer responsibility, take back or exchange or buy back initiatives must be encouraged in order to hand over
the nearing end of life product to safe hand for proper e waste handling. The bulky items are more responsible
for volume and weight wise e waste generation. The mobiles and small EEE products are more in numbers but
volume-wise and weight-wise e waste produce are less. The bulkier AC, Washing Machines, Computers etc
contribute volume-wise and weight-wise more in the e waste generation. The common man / consumer / user
houses the e waste due to lack of awareness in their possession. Lack of awareness of toxicity and
hazardousness of the constitutes of the e wastes puts the user in vernable condition and they suffer most. The
awareness, binding regulations and strict confirmation to them by the three potential groups i.e. Household
users, Business organizations and entities and the Manufacturers / importers / exporters / agencies responsible
for EEE production / distribution and buy back and liable for extended producer responsibility is must for
dealing the e wastes in effective manner. The adherence to regulations laws and awareness in handling e wastes
will relive from further getting environment detoriation.
The study of the present case summarily reveals that following:Household e waste generation due to large scale is 11439.87 kg/year, for medium scale it is 1340.67 kg/year and
for small scale it is 177.48 kg / year.Business organizations including offices generate e waste to the tune of
72271.8 kg/year, 6151.59 kg/year and 2580.86 kg/year for large scale, medium scale and small scale
respectively.In case of Manufacturers , Importers / Exporters etc the e waste understandably is minimal i.e.
almost non existable as the e waste chances are due to breakage during transportation etc only and there also
chances of maximum utilization of components and constituents reuse is maximum.
The assemblers of the computers don’t produce e wastes. They are mostly associated as dealer of the
reputed companies for computers, laptops and printers.

REFERENCES
[1.]
[2.]
[3.]
[4.]
[5.]
[6.]
[7.]
[8.]
[9.]
[10.]
[11.]
[12.]
[13.]
[14.]
[15.]
[16.]
[17.]
[18.]
[19.]
[20.]

E-waste Manual: Volume 1, compiled by UNEP (United Nations Environmental Programme) Study on E-waste recycling in
Delhi Region, conducted in 2003-04 by IRGSSA in collaboration with Toxics Link and EMPA Swiss Federal Labs
Johri Rajesh, “E-Waste: Implications, Regulations and Management in India and Current Global Best Practices”, TERI Press,
2008
The e-Waste Guide, a knowledge base for the sustainable recycling of e-waste at http://www.ewaste.ch
US Environmental Protection Agency at http://www.epa.gov
The Basel Action Network (BAN) at http://www.ban.org
Recycling technologies, ewasteguide_info.mht, 2011.
E. Roche, India's poor risk 'slow death' recycling 'e-waste' by (AFP) – Jul 5, 2010.
Alan Finlay (2005), E-Waste Challenges In Developing Countries: South Africa Case Study, APC “Issue Papers” Series 2005:
APC-200511-CIPP-IEN- PDF-0007, http://www.apc.org
Donation of used Computers and Reduce E-Waste, e-nam (EWA Newsletter for Awareness & Management), Volume 1: Issue 3,
January 2008, http://www.ewa.co.in
e – Waste Management, website: http://www.cqmsju.org
Central Pollution Control Board: Draft Guidelines for Environmentally Sound Management of Electronic Waste, Ministry of
Environment & Forests, Government of India.
WEEE Stakeholders, 2008, MoEF.
Rolf Widmer, Heidi Oswld-Krapf, Deepali Sinha-Khetriwal, Max Schnellmann, Heinz Boni (2005), Global Perspectives on ewaste, Environmental Impact Assessment Review 25 (2005) 436-458, ELSEVIER.
Guidelines for Environmentally Sound Management of E-waste by Central Pollution Control Board-2008.
Implementation of E-waste Rules 2011” by Central Pollution Control Board.
E-waste (Management and Handling) Rules, 2011-GOI, Ministry of Environment and forest.
Umesh Kr, D N Singh papers in 2013 from various international journals on e waste.
Various internet web based papers on e waste.
Various e waste reviews and statistics on web sites on internets.
Topics on e wastes in newspapers and scientific magazines.

||Issn 2250-3005 ||

||February||2014||

Page 37

Contenu connexe

Tendances

Gender parity in ICT
Gender parity in ICTGender parity in ICT
Gender parity in ICTEricsson
 
Gender equality and empowerment of women through ICT
Gender equality and empowerment of women through ICTGender equality and empowerment of women through ICT
Gender equality and empowerment of women through ICTEricsson
 
Buyer and Behaviour Project Report
Buyer and Behaviour Project Report Buyer and Behaviour Project Report
Buyer and Behaviour Project Report Tara Saini
 
Adaptation and barriers of e commerce in tanzania small and medium enterprises
Adaptation and barriers of e commerce in tanzania small and medium enterprisesAdaptation and barriers of e commerce in tanzania small and medium enterprises
Adaptation and barriers of e commerce in tanzania small and medium enterprisesAlexander Decker
 
Consumer Durables
Consumer DurablesConsumer Durables
Consumer DurablesAjit Singh
 
Doing Business in India - Wastewater Treatment
Doing Business in India - Wastewater TreatmentDoing Business in India - Wastewater Treatment
Doing Business in India - Wastewater TreatmentBenjamin Cheeks
 
Applying The Natural Step to the Mobile Services Industry
Applying The Natural Step to the Mobile Services Industry Applying The Natural Step to the Mobile Services Industry
Applying The Natural Step to the Mobile Services Industry Kelly James
 
PPT ICT BAB II Kelompok 1 Raymond & Rohman
PPT ICT BAB II Kelompok 1 Raymond & RohmanPPT ICT BAB II Kelompok 1 Raymond & Rohman
PPT ICT BAB II Kelompok 1 Raymond & Rohmankelompok1mpb15
 
General assessment of e waste problem in egypt.pdf
General assessment of e waste problem in egypt.pdfGeneral assessment of e waste problem in egypt.pdf
General assessment of e waste problem in egypt.pdfwalled ashwah
 

Tendances (12)

Gender parity in ICT
Gender parity in ICTGender parity in ICT
Gender parity in ICT
 
Gender equality and empowerment of women through ICT
Gender equality and empowerment of women through ICTGender equality and empowerment of women through ICT
Gender equality and empowerment of women through ICT
 
Buyer and Behaviour Project Report
Buyer and Behaviour Project Report Buyer and Behaviour Project Report
Buyer and Behaviour Project Report
 
Vikram
VikramVikram
Vikram
 
Adaptation and barriers of e commerce in tanzania small and medium enterprises
Adaptation and barriers of e commerce in tanzania small and medium enterprisesAdaptation and barriers of e commerce in tanzania small and medium enterprises
Adaptation and barriers of e commerce in tanzania small and medium enterprises
 
Consumer Durables
Consumer DurablesConsumer Durables
Consumer Durables
 
Indian water industry
Indian water industryIndian water industry
Indian water industry
 
Consumer Durable Items
Consumer Durable ItemsConsumer Durable Items
Consumer Durable Items
 
Doing Business in India - Wastewater Treatment
Doing Business in India - Wastewater TreatmentDoing Business in India - Wastewater Treatment
Doing Business in India - Wastewater Treatment
 
Applying The Natural Step to the Mobile Services Industry
Applying The Natural Step to the Mobile Services Industry Applying The Natural Step to the Mobile Services Industry
Applying The Natural Step to the Mobile Services Industry
 
PPT ICT BAB II Kelompok 1 Raymond & Rohman
PPT ICT BAB II Kelompok 1 Raymond & RohmanPPT ICT BAB II Kelompok 1 Raymond & Rohman
PPT ICT BAB II Kelompok 1 Raymond & Rohman
 
General assessment of e waste problem in egypt.pdf
General assessment of e waste problem in egypt.pdfGeneral assessment of e waste problem in egypt.pdf
General assessment of e waste problem in egypt.pdf
 

En vedette

Seminar presentation on Electronic waste/E waste
Seminar presentation on Electronic waste/E wasteSeminar presentation on Electronic waste/E waste
Seminar presentation on Electronic waste/E wasteEr Gupta
 
E waste management and recycling
E waste management and recycling E waste management and recycling
E waste management and recycling Govindmeena93
 
The impact of innovation on travel and tourism industries (World Travel Marke...
The impact of innovation on travel and tourism industries (World Travel Marke...The impact of innovation on travel and tourism industries (World Travel Marke...
The impact of innovation on travel and tourism industries (World Travel Marke...Brian Solis
 
Reuters: Pictures of the Year 2016 (Part 2)
Reuters: Pictures of the Year 2016 (Part 2)Reuters: Pictures of the Year 2016 (Part 2)
Reuters: Pictures of the Year 2016 (Part 2)maditabalnco
 
The Six Highest Performing B2B Blog Post Formats
The Six Highest Performing B2B Blog Post FormatsThe Six Highest Performing B2B Blog Post Formats
The Six Highest Performing B2B Blog Post FormatsBarry Feldman
 
The Outcome Economy
The Outcome EconomyThe Outcome Economy
The Outcome EconomyHelge Tennø
 

En vedette (8)

E waste in-india
E waste in-indiaE waste in-india
E waste in-india
 
Seminar presentation on Electronic waste/E waste
Seminar presentation on Electronic waste/E wasteSeminar presentation on Electronic waste/E waste
Seminar presentation on Electronic waste/E waste
 
E waste management and recycling
E waste management and recycling E waste management and recycling
E waste management and recycling
 
E-waste Management Workshop: Dr. Pramod Modak
E-waste Management Workshop: Dr. Pramod ModakE-waste Management Workshop: Dr. Pramod Modak
E-waste Management Workshop: Dr. Pramod Modak
 
The impact of innovation on travel and tourism industries (World Travel Marke...
The impact of innovation on travel and tourism industries (World Travel Marke...The impact of innovation on travel and tourism industries (World Travel Marke...
The impact of innovation on travel and tourism industries (World Travel Marke...
 
Reuters: Pictures of the Year 2016 (Part 2)
Reuters: Pictures of the Year 2016 (Part 2)Reuters: Pictures of the Year 2016 (Part 2)
Reuters: Pictures of the Year 2016 (Part 2)
 
The Six Highest Performing B2B Blog Post Formats
The Six Highest Performing B2B Blog Post FormatsThe Six Highest Performing B2B Blog Post Formats
The Six Highest Performing B2B Blog Post Formats
 
The Outcome Economy
The Outcome EconomyThe Outcome Economy
The Outcome Economy
 

Similaire à E0423029037

Ewasteandmanagement 13001371461749-phpapp01 (2)
Ewasteandmanagement 13001371461749-phpapp01 (2)Ewasteandmanagement 13001371461749-phpapp01 (2)
Ewasteandmanagement 13001371461749-phpapp01 (2)Priyanka
 
Quantifying E-waste Generation and Management: An Empirical Analysis
Quantifying E-waste Generation and Management: An Empirical AnalysisQuantifying E-waste Generation and Management: An Empirical Analysis
Quantifying E-waste Generation and Management: An Empirical AnalysisIRJET Journal
 
e-waste-management report
e-waste-management reporte-waste-management report
e-waste-management reportanuragrupela
 
AWARENESS OF INDIVIDUAL CONSUMERS TOWARDS E-WASTE MANAGEMENT IN CHENNAI CITY,...
AWARENESS OF INDIVIDUAL CONSUMERS TOWARDS E-WASTE MANAGEMENT IN CHENNAI CITY,...AWARENESS OF INDIVIDUAL CONSUMERS TOWARDS E-WASTE MANAGEMENT IN CHENNAI CITY,...
AWARENESS OF INDIVIDUAL CONSUMERS TOWARDS E-WASTE MANAGEMENT IN CHENNAI CITY,...IAEME Publication
 
E-waste Roadmap 2023 for India
E-waste Roadmap 2023 for IndiaE-waste Roadmap 2023 for India
E-waste Roadmap 2023 for IndiaHarshitaMehta8
 
Report on e-waste management & recycling
Report on e-waste management & recyclingReport on e-waste management & recycling
Report on e-waste management & recyclingGovindmeena93
 
Electronic Waste Management
Electronic Waste ManagementElectronic Waste Management
Electronic Waste ManagementSourabh Kulkarni
 
Tech Waste: Environmental Impact and Management
Tech Waste: Environmental Impact and ManagementTech Waste: Environmental Impact and Management
Tech Waste: Environmental Impact and ManagementEditor IJCATR
 
The circular economy - benefits to South African supply chains
The circular economy - benefits to South African supply chainsThe circular economy - benefits to South African supply chains
The circular economy - benefits to South African supply chainsTristan Wiggill
 
E waste-business-in-india wtc--dr.-prasad-modak
E waste-business-in-india wtc--dr.-prasad-modakE waste-business-in-india wtc--dr.-prasad-modak
E waste-business-in-india wtc--dr.-prasad-modakMohdmahir shaikh
 
IRJET - Municipal Waste Handling using IoT
IRJET -  	  Municipal Waste Handling using IoTIRJET -  	  Municipal Waste Handling using IoT
IRJET - Municipal Waste Handling using IoTIRJET Journal
 
550769070-EST-Microproject-Ppt.pptx
550769070-EST-Microproject-Ppt.pptx550769070-EST-Microproject-Ppt.pptx
550769070-EST-Microproject-Ppt.pptx2235JaydeepKonkar
 
gaurav singh 19ME25 (1).pptx
gaurav singh 19ME25 (1).pptxgaurav singh 19ME25 (1).pptx
gaurav singh 19ME25 (1).pptxGauravSingh31583
 
Reclaim Dispose and Recycling of E-Waste
Reclaim Dispose and Recycling of E-WasteReclaim Dispose and Recycling of E-Waste
Reclaim Dispose and Recycling of E-WasteSoumya De
 
11 sarojjjj 1867 send 74-85
11 sarojjjj 1867 send 74-8511 sarojjjj 1867 send 74-85
11 sarojjjj 1867 send 74-85Alexander Decker
 

Similaire à E0423029037 (20)

E – Waste Management through Regulations
E – Waste Management through RegulationsE – Waste Management through Regulations
E – Waste Management through Regulations
 
Ewasteandmanagement 13001371461749-phpapp01 (2)
Ewasteandmanagement 13001371461749-phpapp01 (2)Ewasteandmanagement 13001371461749-phpapp01 (2)
Ewasteandmanagement 13001371461749-phpapp01 (2)
 
Quantifying E-waste Generation and Management: An Empirical Analysis
Quantifying E-waste Generation and Management: An Empirical AnalysisQuantifying E-waste Generation and Management: An Empirical Analysis
Quantifying E-waste Generation and Management: An Empirical Analysis
 
e-waste-management report
e-waste-management reporte-waste-management report
e-waste-management report
 
AWARENESS OF INDIVIDUAL CONSUMERS TOWARDS E-WASTE MANAGEMENT IN CHENNAI CITY,...
AWARENESS OF INDIVIDUAL CONSUMERS TOWARDS E-WASTE MANAGEMENT IN CHENNAI CITY,...AWARENESS OF INDIVIDUAL CONSUMERS TOWARDS E-WASTE MANAGEMENT IN CHENNAI CITY,...
AWARENESS OF INDIVIDUAL CONSUMERS TOWARDS E-WASTE MANAGEMENT IN CHENNAI CITY,...
 
E-waste Roadmap 2023 for India
E-waste Roadmap 2023 for IndiaE-waste Roadmap 2023 for India
E-waste Roadmap 2023 for India
 
E waiste slides
E waiste slidesE waiste slides
E waiste slides
 
Report on e-waste management & recycling
Report on e-waste management & recyclingReport on e-waste management & recycling
Report on e-waste management & recycling
 
Electronic Waste Management
Electronic Waste ManagementElectronic Waste Management
Electronic Waste Management
 
Tech Waste: Environmental Impact and Management
Tech Waste: Environmental Impact and ManagementTech Waste: Environmental Impact and Management
Tech Waste: Environmental Impact and Management
 
The circular economy - benefits to South African supply chains
The circular economy - benefits to South African supply chainsThe circular economy - benefits to South African supply chains
The circular economy - benefits to South African supply chains
 
E waste-business-in-india wtc--dr.-prasad-modak
E waste-business-in-india wtc--dr.-prasad-modakE waste-business-in-india wtc--dr.-prasad-modak
E waste-business-in-india wtc--dr.-prasad-modak
 
Swacch bharat
Swacch bharatSwacch bharat
Swacch bharat
 
E-Waste Management in India
E-Waste Management in India E-Waste Management in India
E-Waste Management in India
 
IRJET - Municipal Waste Handling using IoT
IRJET -  	  Municipal Waste Handling using IoTIRJET -  	  Municipal Waste Handling using IoT
IRJET - Municipal Waste Handling using IoT
 
550769070-EST-Microproject-Ppt.pptx
550769070-EST-Microproject-Ppt.pptx550769070-EST-Microproject-Ppt.pptx
550769070-EST-Microproject-Ppt.pptx
 
Network eWaste : Community role to manage end of life Product
Network eWaste : Community role to manage end of life ProductNetwork eWaste : Community role to manage end of life Product
Network eWaste : Community role to manage end of life Product
 
gaurav singh 19ME25 (1).pptx
gaurav singh 19ME25 (1).pptxgaurav singh 19ME25 (1).pptx
gaurav singh 19ME25 (1).pptx
 
Reclaim Dispose and Recycling of E-Waste
Reclaim Dispose and Recycling of E-WasteReclaim Dispose and Recycling of E-Waste
Reclaim Dispose and Recycling of E-Waste
 
11 sarojjjj 1867 send 74-85
11 sarojjjj 1867 send 74-8511 sarojjjj 1867 send 74-85
11 sarojjjj 1867 send 74-85
 

E0423029037

  • 1. International Journal of Computational Engineering Research||Vol, 04||Issue, 2|| Electronic Waste Status in Jharkhand Cities 1 Umesh Kumar, 2Dr D N Singh, 1 Electronics & Communication Engg, Dept of Science & Technology, G W P Ranchi Tharpakhna, Ranchi 834001 2 Jt Secretary, Dept of Science & Technology, SBTE, Patna ABSTRACT: The use of Electrical Electronic Equipments (EEE) in day to day life is increasing and changing with rapid and frequent changes in technology. Like any product these EEE have also their life and at end of life when they lose their credibility and usability turn to waste and are popularly known as Electronic Waste (e waste). These e wastes contain many toxic and hazardous constituents in it which are dangerous and harmful to health and environment. The e wastes are day by day increasing and are posing threats to the mankind by increasing the pollution. India being developing country with extreme poverty and has vast unskilled manpower ready for doing any work without knowing the hazards is more liable to risks of the e wastes. In India also we notice the various states representing the various levels of economic strata and affordability. The developed states are moving towards managing e wastes through regulations but the less developed states lacks on this front also. The study of the Jharkhand developed cities and relatively less developed cites has been carried out. The study reveals that the maximum volumes and weights of the e wastes are from the larger and bigger EEE products i.e. AC, Refrigerator, Washing Machine etc. The major eight products present in everyone’s life have been considered in this study. The reuse and recycle takes place in formal and informal sectors. 95 % of recycling is done in informal sector which is performed and actuated in most toxic and hazardous environment. The extended producers responsibility (ERP) which requires the producer or propagators to take back e wastes for recycling or disposal as buy back with fees or without financial initiatives is day to day becoming fact and figure for strict requirement for proper tackling of e wastes. The lack of knowledge of the user that wastes of EEE also have reusable components can entitle them good return often lead to ignorance of consumers to hand back to the manufacturer and lack of market of reusable components among the manufacturers also leads to e waste in bulk though meaningful components can be extracted and reduction of waste volumes can be noticed. The main concerns are the following of western thinking of “one size fit all”, eco label initiative or oligopoly approach of Indian Government and pollution control boards. The large scale imports with inappropriate technology and imports of junks in name of up gradation from developed countries lead to increased e waste. The employment generation, lack of job 1. potential and poverty compels the user and workforce to drive themselves into these.The status of Jharkhand is also same as there is no specific state government initiative for tackling the e wastes. The production of e waste is in line of any other state in India. The scenario of this state is in confirmation to the states of affairs in the developing states category, if India has developed, developing and underdeveloped states.The worst sufferers are the common man and the poor users who inherit the junk in name of technological upgradation and making the life easier by automating the lifestyle. KEYWORD: EEE, e waste, Environment, Technology, End-of-life, Disposal, Household, Discard, Pollution. ||Issn 2250-3005 || ||February||2014|| Page 29
  • 2. Electronic Waste Status in… I. INTRODUCTION The rapid growth & industrialization and desire of common man to lead a easy life leads to the boom in the rapidly growing electronics in particular and electrical and electronic equipments (EEE) and information technology industry is the fastest growing sector in particular. The information technology industry in India is equally prominent sector as witnessed in the global scenario. The influx of leading multinational brands and companies in the manufacturing sector of these EEE has reported as a result of changing policies and exchange of R&D facilities. The advancement in technology results in increase in updated EEE products and this leads to a situation of obsolesce of old products as they lose their usefulness and this leads to end of life rise and hence generation of Waste of Electrical & Electronic Equipments (WEEE) i.e. electronics waste (e waste).The popular EEE products include computers, laptops ,Printers, mobiles , electronic gadgets, televisions, VCRs, DVD, stereos, copiers, fax machines, lamps, audio equipment , electronic toys , electrical home appliances, electric equipments and batteries etc. The recent past has witnessed accelerated manifold growth of e waste. Various factors for rise of e waste includes the imports of used and obsolete EEE products in name of technology up gradation aimed to the third world counties who have vast potential of consumerisation or market from the developed countries. The e waste amounts to 2.7. to 3 % of the total waste whose handling itself is a complex phenomenon. The issue of e waste handling are concentrated at manufacturer, distributor or consumer levels. The initiative of the regulatory mechanism for such issues is being talked about and are at initial stage only. The consumer handling of e waste is itself a complex issue as the e wastes constitute hazardous elements also. The making use of products at various levels and through various techniques includes its recycling; reuse and sometimes mixing of components for making it usable are prevalent in India, though are rarely evident in the developed countries. The developed nations mostly follow use and throw policy. The dependence on the EEE is still a status symbol and its affordability is to the elite and economically affordable section of the society only. The economical betterment and affordability of citizens is creating larger markets for EEE. The gray market mostly for the computers where assembled computers market is evident, resale and reuse is prominently evident. The survey and research for estimation of e waste is only taken up by limited organizations and are in stray condition. This is the sole reason that we lack reliable data of e waste and e waste generation. The Information Technology (IT) sector is the most promising sector which is generating employment. The outsourcing of software development and solutions are day by day outreaching the far flung areas. The needs and changes are faster and this results in increased demand of optimized and recent hardware and software. Hence this sector is another area which is responsible for the e waste generation. The availability of finance and increase in affordability as the EEE prices are lowering down the tendency of procurement of new TV sets, mobiles, house hold appliances, electronic toys and other EEE are increasing many fold. With increase in consumption pattern e waste generation is also resulting.Jharkhand state has many cities like Jamshedpur, Ranchi, Bokaro, Dhanbad which are at high peaks of economic activity at one end and other cities like Dumka, Daltongang, Hazribagh, Ramghar are at lesser peaks. The cities in the vicinity of developed cities and well connected metros are developing as potential centres of software and hardware development in the IT sector and have traditional consumers of EEE. The industrial giants, hubs in the cities and rising network of BPO throughout state are creating high end society are also responsible for growth of EEE consumers and networks. As rough estimate the state has more than 800 numbers of software industries/ developers and numerous hardware industries/organisations established and several (BPO’s) companies with more than fifty thousand employees. State cities like Jamshedpur, Ranchi, Dhanbad and Bokaro have emerged as important destination and or hub for reuse recycling of EEE and as a result e-waste generator. The reuse and recycling centers available in the areas are in informal and unorganized sectors only. Instances of shifting the ewastes to nearby metro are also in sight. The informal and unorganized sectors involvement in the recycling sector is leading to pollution and hazardous environment and is causing health concerns to the workers and persons involved in it. The higher consumption and disposal rates of the consumers are responsible for increased growth of e waste. Immediate concerns for the health and pollution and strict measures for the pollution control and proper recycling and reuse technology and training to personals is the emergent need of the day. The work being reported here is based on the exploratory sample estimation of e waste generation in the state. II. PRESENT E WASTE SCENARIO AND CONCERNS / TRENDS As an estimate the e waste amount piled up in India is 800000 tones in India in 2012 as per Manufacturers Association of Information Technology Companies (MAIT) and GTZ study. The e-waste strategic Management Systems in the key developing and underdeveloped countries can be seen as a comparative way among sets of countries can be as depicted in the table 1. The table shows a comparative view of Prevailing overall Technology, E waste Management , Actors , Formal e waste collection, Disposal / dumping sites, techniques , uniqueness financial aspects and legal framework and its adherence in the India , China very fast developing country, south Africa example of third world nations and Switzerland sample of developed nation has been briefly outlined. ||Issn 2250-3005 || ||February||2014|| Page 30
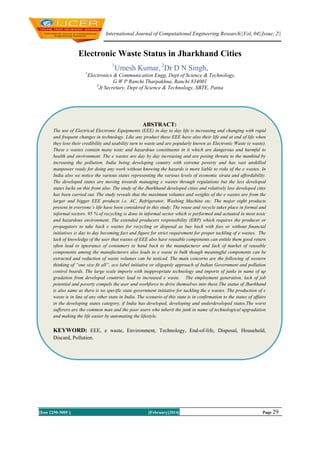
  • 3. Electronic Waste Status in… Table 1 Approach Details of India, Developing country China, Third World Country S Africa Developed Country Switzerland Important aspect Technology India Mostly borrowed , few indigenous Semi Organised in metropolitans but unorganized in other areas China Indigenous and borrowed Only organized in urban areas Partly specific through unorganized and informal Manufacturers, distributors, traders, importers, consumers, formal and informal recyclers and scrap dealers. Non specific but Semi organized Manufacturers, distributors, traders, importers, consumers, recyclers, scrap dealers and disposers. Formal e waste collection centres Mostly under Pollution control boards EMPA, GTZ and EECZ Disposal / dumping sites Disposal site technologies Uniqueness Mostly in landfills Municipal sites and mostly illegal sites No legal methods Prevailing overall waste management system E waste management Actors No proper collection system Financial Uniqueness Reusable and secondary raw material segregation Lacking of defined system Multiple conditioning and refining process Individuals are paid for the collected e waste Legal framework and adherence alertness 100% prohibited in principle but no definite adherence Legally imports prohibited South Africa Borrowed Mostly unorganized Not specific Distributors, traders, importers, consumers, recyclers, collectors, sorters and disposers. DESCO Electronic recyclers ND Universal recycling co. In Landfills Permitted sites with technology Unique processing and screening Payments are made by metal scrap dealers for the metals in the waste Stringent laws but loose in adherence Switzerland Developed , trans boarder migrated Organized , Swiss Association for the Information, Communication and Organizational Technologies (SWICO) system Not specific Manufacturers, distributors, traders, importers, consumers, recyclers, licensed collectors and licensed dismeltors and refiners. SWICO and SENS (Swiss Foundation for Waste Management) In Landfills Systematic and meticulous process Landfill capacity adherence Provision of Advanced Recycling Fees (ARF) Strict tougher laws and adherence to norms The e waste scenario as per various studies available till 2012 for all the states in India in terms of percentage of the total production of e waste (in India) can be viewed as mentioned in Table 2. Table 2 Showing Details of State wise E Waste Contribution in India Sl 1 2 3 4 5 6 7 8 9 10 11 12 13 14 15 16 17 18 States Maharashtra Tamil Nadu Andhra Pradesh Uttar Pradesh West Bengal Delhi Karnataka Gujarat Madhya Pradesh Punjab Rajasthan Kerala Haryana Bihar Orissa Assam Chhattisgarh Jharkhand ||Issn 2250-3005 || WEEE in % in India 13.88121 9.235316 8.751912 7.108937 6.888625 6.662478 6.244472 6.159256 5.341829 4.765149 4.332633 4.226421 3.086305 2.092461 2.011792 1.490594 1.472242 1.384383 Sl 19 20 21 22 23 24 25 26 27 28 29 30 31 32 33 34 35 States Uttarakhand Himachal Jammu & Kashmir Goa Tripura Chandigarh Pondicherry Meghalaya Nagaland Arunachal Pradesh Andaman Nicobar Mizoram Manipur Sikkim Diu & Daman Dadar & Nagar Haweli Lakshadweep ||February||2014|| WEEE in % in India 1.123886 1.092317 1.041916 0.292682 0.259058 0.246321 0.194619 0.144903 0.099364 0.090188 0.063138 0.054647 0.05451 0.053483 0.02794 0.019928 0.005067 Page 31
  • 4. Electronic Waste Status in… Figure Showing percentage representation of E waste generation in India state wise III. JHARKHAND STATE CITIES STUDIES AND DATA OUTLINES The following strategies were employed for data collection and studies:1. Questioner were developed and data’s based on the questioner were received basically from the diversified socio economic groups across the sections for proper ascertaining practical sample data of the state so far practicable particularly from the following groups a) Households, b) Business organizations & institutions including offices c) Manufacturers, Importers / exporters, EEE collectors, EEE second-hand shops, EEE repair shops, Recyclers / dismantlers, Processors of recyclable materials, Re-users, R&D units and similar institutions. 2. Selective interview with the selected group were conducted to ascertain the facts and figures and principle of thoughts 3. The purchasing pattern, recycling, reuse and disposal practices were collected i.e. ascertained Broadly main seven types of consumer commodity of EEE were considered for determination of pattern of e waste disposal. The seven EEE are Computers inclusive of monitors (LCD / CRT both types),Laptops, Mobiles , Refrigerators , Air conditioners (AC) , Batteries including the mobile batteries. In all 300 sets of questioners in equal numbers i.e. 100 each to the mentioned three groups were sent through email, post and distributed manually. Responses from the three categories of target groups are as follows mentioned in the table In household category for the eight cities total of 800 questionnaires supplied 734 were received back. The responses mentioned in table 4 are mainly the response that reflects the mood of the consumers on individual basis. Business organizations & institutions including offices: Out of total 800 targets the 600 receipts reveals the mood of the bulk user and policymakers. The details of responses are in table 5.The Manufacturers, Importers / exporters responses are in conformity of the e waste generation as it was most likely that the e waste would be nil only as the EEE products are not put to use themselves and are extended to others only for conversion to e waste after extensive use and handling, recycling and reuse. The details are in table 6. Table 3 Showing the Responses in the three Segments Identified and Planned Household City Jamshedpur Ranchi Dhanbad Bokaro Hazaribagh Ramghar Daltonganj Dumka ||Issn 2250-3005 || Questio nnaire sent 100 100 100 100 100 100 100 100 Questio nnaire received 95 99 94 96 95 93 94 86 Business organizations & institutions including offices City Question Questionn naire sent aire received Jamshedpur 100 90 Ranchi 100 87 Dhanbad 100 88 Bokaro 100 78 Hazaribagh 100 67 Ramghar 100 56 Daltonganj 100 73 Dumka 100 61 ||February||2014|| Manufacturers, Importers/exporters etc. City Questionn Question aire sent naire received Jamshedpur 100 89 Ranchi 100 92 Dhanbad 100 94 Bokaro 100 89 Hazaribagh 100 81 Ramghar 100 78 Daltonganj 100 74 Dumka 100 86 Page 32
  • 5. Electronic Waste Status in… Figure depicting distributed and received questionnaire for individual three groups IV. DETAILS OF SAMPLE SURVEYS In Sample survey for household e wastes all together 800 questionnaires were sent and in all 752 were received i.e. 48 did not reply. In case of business organizations and institutions the received number was 600 i.e. 200 chose not to reply. In the manufacturers, importers / exporters etc category it was 683 indicates that 117 were non responsive. Reusers / Recyclers/ Second hand market holders Questionnaires In this category mainly four groups existed and they were a. Scrap metal collectors b. Second hand repair shops c. Formal pollution board listed/licensed vendors and d. Informal vendors active in this field. Mostly the details were collected by the interview of such groups. The questionnaires were not responded and to collect data interview was only option left. The volumes and weight of the e wastes calculated in this study are as per the report of UNEP volume I published. Details of collected data for the eight listed segments of the e waste are as mentioned in the tables listed here under. Table4 Showing E waste generation from household Components Computers with monitors Laptops Printers Mobile phones TV Refrigerator AC Washing machines Total e waste Household sector e waste survey ( Total received records 752 from all the 8 districts) Large scale Medium scale Small scale Use Repaire E waste Used Repaired/ E waste Used Repaired E d d/discar discarded / waste ded discarded 409 121 3533.2 131 26 75.92 12 3 8.72 242 54 105 2 143 6 259 498 256 67 11 246 234.5 55 922.17 98 23 678 23 12 154 80.5 60 12.63 32 9 890 4 2 341 14 10 27.96 203 4060 1231 401 802.0 776 456 91.2 37 53 23 1110 1065 460 328 541 349 41 48 71 123 94.6 92 35 4 80 6 2 36 18 1.2 6.4 11439.87 kg/yr 1340.67 kg/yr 177.48 kg/yr The major e waste generated in this segment is in the TV field followed by computers although the mobile users was the second largest i.e. after TV. The e wastes figures from the Jamshedpur and Ranchi cities were largest compared to the cities of Ramghar showing the least one. His understandably so as the availability of the products and paying capacity of the members in the cities of Jamshedpur and Ranchi are higher compared to the other cities. ||Issn 2250-3005 || ||February||2014|| Page 33
  • 6. Electronic Waste Status in… Table 5 showing E waste generation from Business organizations & institutions including offices Components Used Computers with monitors Laptops Printers Mobile phones TV Refrigerator AC Washing machines Total e waste 21265 Software sector e waste survey ( Total received records 75 from all the 8 districts) Large scale Medium scale Small scale Repaired / E waste Used Repaired / E waste Used Repaired / discarded discarded discarded 2098 61802 987 112 3360 298 46 9826 872 748 357 67 189 23 965 176 89 91 23 41 9 3377.5 880 7.3 3276 1108 1640 180 421 321 173 162 46 56 11 72271.8 kg/yr 46 38 56 16 18 32 2 161 190 4.59 756 540 1280 40 68 121 114 75 41 12 3 6151.59 kg/yr E waste 1343 23 28 41 4 23 4 1 80.5 140 3.36 144 690 160 20 2580.86 kg/yr As the major business, official and educational organizations are situated in the Jamshedpur, Ranchi and Dhanbad cities the bulk users are in the computer and laptop segments. These sections show the major e waste generations also. The small cities like Ramghar and Dumka generated lower e waste in this segment. Table 6 Showing E waste generation from Manufacturers, Importers/exporters etc. Components 8046 Software sector e waste survey ( Total received records 75 from all the 8 districts) Large scale Medium scale Small scale Repaired/ E waste Used Repaired / E waste Used Repaired / discarded discarded discarded 03 Returned 1208 6 Returned 1561 4 0 3471 4847 16123 11347 6711 958 3218 2 7 8 7 4 2 3 0 0 0 0 0 0 0 Used Computers with monitors Laptops Printers Mobile phones TV Refrigerator AC Washing machines Returned Returned Returned Returned Returned Returned Returned 189 231 431 2028 0 871 592 0 0 2 39 0 9 7 0 0 Returned Returned 0 Returned Returned 0 0 0 1091 0 0 682 0 0 0 81 0 0 43 E waste The major manufacturer/importer/exporter units are located in Jamshedpur followed by Ranchi and Dhanbad. The connectivity of Jamshedpur and Dhanbad to Kolkata is easier and hence these cities were better having facilities of returning the damaged products. The company owned maintenance and service centres are mostly in Ranchi followed in Jamshedpur. The Dhanbad is well connected to Kolkata so the service providers are mostly attending form there only. V. SEGMENT WISE RESULTS AND DISCUSSIONS Household: Survey of total of 752 out of 800 houses to get a trend of generation of e waste was done. Here the number of family members count divided the large, medium and small section. The overall trend for these shows that the EEE are in properly maintained conditions. They often get repaired when they get defects. The authorized centres personals come for the repairing.The care and frequency are the sole causes of low generation of e waste. The outdated Computers , Laptops Printers , TV AC etc get exchanged in the market and often get their reflection as e waste in the next group where we dealt with the reusers and recyclers etc. The table shows the details of use and e waste generation. The e waste generation is from the products which came from the gray market. The items and products of the standard companies did not contribute much to the e waste. The Maximum of e waste generated in computer is because of the low life span and fast technology upgradation and tendency that the latest version of software are not supported by the ||Issn 2250-3005 || ||February||2014|| Page 34
  • 7. Electronic Waste Status in… Figure showing Household E waste details Old computers which offer low generation and lesser speed peripherals. The choice of lesser repairs is also reason for e-waste generation. In case of TV the changing pattern of consumers for changing technology is the basic cause of shifting of product to lower groups and ultimately resulting in the obsolesce i.e. e waste. The refrigerator is the other EEE product which often gets converted to e waste as the repairing cost is high and recovery of the items is easy and volumes of metallic part results in the major e waste by weight and volume. The second hand market is not that high. Methods of disposal of EEE in the sample survey of 752 studies noticed is as mentioned herein : Activity Disposable EEE keep in house Send to manufacturer To Repair/ Recycle centre Transfer to relative Charity transfer Waste bins Others Frequency 111 Percentage 14.76 36 99 54 72 293 87 4.79 13.16 7.18 9.57 38.96 11.57 Figure showing Disposal Activity Freq. & Percentage Business organizations & institutions including offices: The survey for the 800 sent information questionnaire out of which 600 were received details / information were gathered. The trends of e waste generation percentage and volume can be explained in different ways. The volume wise e waste generation is maximum in computers and printers followed by TV, AC, fridge, printer, washing machine and mobile. The e waste generation percentage wise is maximum in Refrigerator section followed by AC, TV, Washing machine, Computers, Printers, laptops and Mobile. The amount of e waste generated is understandably largest in the large scale sector and minimum in small sector. Figure howing e wsate in Business etc organisations ||Issn 2250-3005 || ||February||2014|| Page 35
  • 8. Electronic Waste Status in… E waste generation from Manufacturers, Importers/exporters etc: In this category we observe that since the products are not in use and only few in transportation get damaged and hence require repairs. The e waste produced is nonexistent in this case. The damaged items are returned back to the importers / exporters / manufacturers or assemblers. These parties make use of the new parts to other unit and hence the e waste is negligible. The branded parties and reputed assemblers of the area and region were only contacted hence the real story of the very small or cottage type industries scenario could not be studied. VI. CHALLENGES, CONCERNS AND ECONOMICS OF E WASTES The mammoth growth and arising concerns for the Electronics Waste in a sustainable and sound environmental technological development with updating processing advancements and growth of use and throw mindset is increasingly making e waste management task bit challenging one. The outburst of hazardous toxic constituents of the e wastes in the environment has proved that we have failed to strike balance between safety, cost and advancement of technology with proper environment protection for green world. We need to address the facts of reduction of e waste through recovery, reuse and recycle to minimize toxic substances in order to arrive at technology for such labour intensive and safe product development with enhanced participation of stakeholders in fixing responsibility of managing e waste in more sensible manner. The e waste gets recycled in formal and informal sectors. As per initial estimate 90-95 % of e-waste gets recycled in India in the informal sector which is performed and actuated in highly hazardous conditions. The e waste is one which simultaneously posses threat and opportunity at same time. It contains different hazardous and toxic elements responsible for even health problem, if not properly treated and managed. The positive aspect of e waste is that E-waste also offers employment and handsome returns and offers great opportunity to small manufacturers in formal and informal sectors by providing means of supply of many inputs, recovered through recycling and dismantling process, at a vary cheaper rates. Remains and scraps of the end of life products are the main source of e waste, in other words one can say that products which suffers from the technological obsolescence and permanent damage conditions results in e waste. Separate designated location for storage of e waste becomes inevitable. The extended producers responsibility which entitles the manufacturers or its importers / agents to take back e wastes for disposal as buy back or otherwise arrangement is day by day becoming fact and figure for strict requirement. The lack of awareness of the contents and toxicity and hazardousness among the users sometimes becomes consumer’s ignorance for the handing over of the product even in case of buy back offers. The lack of knowledge of the user that wastes of EEE also have reusable components can feed them good return often lead to ignorance of consumers to hand back to the manufacturer and lack of market of reusable components among the manufacturers also leads to e waste in bulk though meaningful components can be extracted and reduction of waste volumes can be noticed. The response of the lack of awareness among the users and manufactures were noticed in the responses received. The proper awareness about belongingness of e wastes among the handler group was divided i.e. they are not fully aware that to whom this belongs and so was the case among the consumers / user. The situation of regulations and strictness of adherence was also divided lot. The overall reaction is that the “it carries” is the situation among the different groups. The Indian business leaders are reluctant towards e waste handling and its proper management. The duty of user is to handle the e waste is feeling in majority of the business leaders. The main concerns are the following of western thinking of “one size fit all”, eco label initiative or oligopoly approach of Indian Govt. and pollution control boards. The large scale imports with inappropriate technology and imports of junks in name of upgradation from developed countries lead to increased e waste. The monopoly and oligopology lukewarm approach of dominant players in cases environmental regulations and weak loopholes in the regulatory mechanism and governmental initiative for creating proper awareness among users are the main concerns. The employment generation, lack of job potential and poverty compels the user and workforce to drive themselves into these. The underdeveloped or least developed countries are since not having more sophisticated gadgets and EEE so the level of pollution is low and can afford cuts in the pollution levels for the developed nations. The environmental protection from pollution among the developed and under developed nation has given rise to economics in needed items and trade. The health and aesthetic reasons for environmental protection has become luxury of the developed nations. The reduction of pollution is increasingly becoming need of these nations as they are becoming experimental grounds of the developed nations. ||Issn 2250-3005 || ||February||2014|| Page 36
  • 9. Electronic Waste Status in… VII. CONCLUSIONS In the study regarding the e waste in the Jharkhand it came out that the situation is no different from the other states in India. There is lack of proper awareness among the users about the hazardousness and toxicity of the EEE products resulting in e wastes. There is lack of proper regulatory and awareness (propaganda) mechanism in the areas and requires that the manufacturers / agencies the governmental agencies who owe the responsibility to protect the consumers / users setup cells throughout in general and in each district in particular. The principle of polluter’s pays and extended producer responsibility should be strictly implemented. The green technology and appropriate technology for information technology industries and similar organizations be implemented so that minimum e waste is generated. The reuse and recycle capacity and tendency must be applauded and increasingly adopted. The educational establishments, hospitals government establishments and common users must be encouraged to store and collect the e wastes separately and safely handled. The extended producer responsibility, take back or exchange or buy back initiatives must be encouraged in order to hand over the nearing end of life product to safe hand for proper e waste handling. The bulky items are more responsible for volume and weight wise e waste generation. The mobiles and small EEE products are more in numbers but volume-wise and weight-wise e waste produce are less. The bulkier AC, Washing Machines, Computers etc contribute volume-wise and weight-wise more in the e waste generation. The common man / consumer / user houses the e waste due to lack of awareness in their possession. Lack of awareness of toxicity and hazardousness of the constitutes of the e wastes puts the user in vernable condition and they suffer most. The awareness, binding regulations and strict confirmation to them by the three potential groups i.e. Household users, Business organizations and entities and the Manufacturers / importers / exporters / agencies responsible for EEE production / distribution and buy back and liable for extended producer responsibility is must for dealing the e wastes in effective manner. The adherence to regulations laws and awareness in handling e wastes will relive from further getting environment detoriation. The study of the present case summarily reveals that following:Household e waste generation due to large scale is 11439.87 kg/year, for medium scale it is 1340.67 kg/year and for small scale it is 177.48 kg / year.Business organizations including offices generate e waste to the tune of 72271.8 kg/year, 6151.59 kg/year and 2580.86 kg/year for large scale, medium scale and small scale respectively.In case of Manufacturers , Importers / Exporters etc the e waste understandably is minimal i.e. almost non existable as the e waste chances are due to breakage during transportation etc only and there also chances of maximum utilization of components and constituents reuse is maximum. The assemblers of the computers don’t produce e wastes. They are mostly associated as dealer of the reputed companies for computers, laptops and printers. REFERENCES [1.] [2.] [3.] [4.] [5.] [6.] [7.] [8.] [9.] [10.] [11.] [12.] [13.] [14.] [15.] [16.] [17.] [18.] [19.] [20.] E-waste Manual: Volume 1, compiled by UNEP (United Nations Environmental Programme) Study on E-waste recycling in Delhi Region, conducted in 2003-04 by IRGSSA in collaboration with Toxics Link and EMPA Swiss Federal Labs Johri Rajesh, “E-Waste: Implications, Regulations and Management in India and Current Global Best Practices”, TERI Press, 2008 The e-Waste Guide, a knowledge base for the sustainable recycling of e-waste at http://www.ewaste.ch US Environmental Protection Agency at http://www.epa.gov The Basel Action Network (BAN) at http://www.ban.org Recycling technologies, ewasteguide_info.mht, 2011. E. Roche, India's poor risk 'slow death' recycling 'e-waste' by (AFP) – Jul 5, 2010. Alan Finlay (2005), E-Waste Challenges In Developing Countries: South Africa Case Study, APC “Issue Papers” Series 2005: APC-200511-CIPP-IEN- PDF-0007, http://www.apc.org Donation of used Computers and Reduce E-Waste, e-nam (EWA Newsletter for Awareness & Management), Volume 1: Issue 3, January 2008, http://www.ewa.co.in e – Waste Management, website: http://www.cqmsju.org Central Pollution Control Board: Draft Guidelines for Environmentally Sound Management of Electronic Waste, Ministry of Environment & Forests, Government of India. WEEE Stakeholders, 2008, MoEF. Rolf Widmer, Heidi Oswld-Krapf, Deepali Sinha-Khetriwal, Max Schnellmann, Heinz Boni (2005), Global Perspectives on ewaste, Environmental Impact Assessment Review 25 (2005) 436-458, ELSEVIER. Guidelines for Environmentally Sound Management of E-waste by Central Pollution Control Board-2008. Implementation of E-waste Rules 2011” by Central Pollution Control Board. E-waste (Management and Handling) Rules, 2011-GOI, Ministry of Environment and forest. Umesh Kr, D N Singh papers in 2013 from various international journals on e waste. Various internet web based papers on e waste. Various e waste reviews and statistics on web sites on internets. Topics on e wastes in newspapers and scientific magazines. ||Issn 2250-3005 || ||February||2014|| Page 37