154-Seip Intellectual property rights in the Netherlands
•
1 j'aime•230 vues

Blue Sky 3 - Poster Gallery
Recommandé

Recommandé
Contenu connexe
Similaire à 154-Seip Intellectual property rights in the Netherlands
Similaire à 154-Seip Intellectual property rights in the Netherlands (20)
Plus de innovationoecd
Plus de innovationoecd (20)
Dernier
Dernier (20)
154-Seip Intellectual property rights in the Netherlands
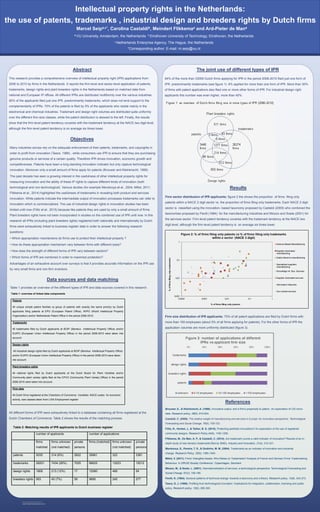
- 1. RESEARCH POSTER PRESENTATION DESIGN © 2015 www.PosterPresentations.com This research provides a comprehensive overview of intellectual property right (IPR) applications from 2006 to 2010 by firms in the Netherlands. It reports the firm-level and sector-level application of patents, trademarks, design rights and plant breeders rights in the Netherlands based on matched data from national and European IP offices. All different IPRs are distributed multiformly over the various industries. 90% of the applicants filed just one IPR, predominantly trademarks, which does not lend support to the complementarity of IPRs. 70% of the patents is filed by 5% of the applicants who reside mainly in the electronical and chemical industries. Trademark and design right volumes are distributed quite uniformly over the different firm-size classes, while the patent distribution is skewed to the left. Finally, the results show that the firm-level patent tendency covaries with the trademark tendency at the NACE two digit level, although the firm-level patent tendency is on average six times lower. Abstract Objectives The joint use of different types of IPR 94% of the more than 33000 Dutch firms applying for IPR in the period 2006-2010 filed just one form of IPR, predominantly trademarks (see figure 1). 6% applied for more than one form of IPR. More than 30% of firms with patent applications also filed one or more other forms of IPR. For industrial design right applicants this number was even higher, more than 40%. Results Firm sector distribution of IPR applicants: figure 2 the shows the proportion of firms filing only patents within a NACE 2 digit sector vs. the proportion of firms filing only trademarks. Each NACE 2 digit sector is classified using the innovation- based taxonomy proposed by Castaldi (2009) who combined the taxonomies proposed by Pavitt (1984) for the manufacturing industries and Miozzo and Soete (2001) for the services sector. Firm-level patent tendency covaries with the trademark tendency at the NACE two digit level, although the firm-level patent tendency is on average six times lower. References All different forms of IPR were exhaustively linked to a database containing all firms registered at the Dutch Chambers of Commerce. Table 2 shows the results of the matching process. Many industries across rely on the adequate enforcement of their patents, trademarks, and copyrights in order to profit from innovation (Teece, 1986) , while consumers use IPR to ensure that they are purchasing genuine products or services of a certain quality. Therefore IPR drives innovation, economic growth and competitiveness. Patents have been a long standing innovation indicator but only capture technological innovation. Moreover only a small amount of firms apply for patents (Brouwer and Kleinknecht, 1999). The past decade has seen a growing interest in the usefulness of other intellectual property rights for measuring innovation and the ability of these IP rights to capture different kinds of innovation (both technological and non-technological). Various studies (for example Mendonça et al., 2004; Millot, 2011; Flikkema et al., 2014) highlighted the usefulness of trademarks in revealing both product and services innovation. While patents indicate the intermediate output of innovation processes trademarks can refer to innovation which is commercialized. The use of industrial design rights in innovation studies has been limited until now (Filitz et al., 2015) because like patents they are used by only a small amount of firms. Plant breeders rights have not been incorporated in studies on the combined use of IPR until now. In this research all IPRs (including plant breeders rights) registered both nationally and internationally by Dutch firms were exhaustively linked to business register data in order to answer the following research questions: • Which appropriation mechanisms do firms use to protect their intellectual property ? • How do these appropriation mechanism vary between firms with different sizes? • How does the strength of different forms of IPR vary between sectors? • Which forms of IPR are combined in order to maximize protection? Advantages of an exhaustive account over surveys is that it provides accurate information on the IPR use by very small firms and non-firm inventors. a VU University, Amsterdam, the Netherlands b Eindhoven University of Technology, Eindhoven, the Netherlands c Netherlands Enterprise Agency, The Hague, the Netherlands *Corresponding author: E-mail: m.seip@vu.nl Marcel Seipa,c*, Carolina Castaldib, Meindert Flikkemaa and Ard-Pieter de Mana Intellectual property rights in the Netherlands: the use of patents, trademarks , industrial design and breeders rights by Dutch firms Data sources and data matching Table 1 provides an overview of the different types of IPR and data sources covered in this research. Firm size distribution of IPR applicants: 70% of all patent applications are filed by Dutch firms with more than 100 employees (about 5% of all firms applying for patents). For the other forms of IPR the application volumes are more uniformly distributed (figure 3). Brouwer, E., & Kleinknecht, A. (1999). Innovative output, and a firm's propensity to patent.: An exploration of CIS micro data. Research policy, 28(6), 615-624. Castaldi, C. (2009). The relative weight of manufacturing and services in Europe: An innovation perspective. Technological Forecasting and Social Change, 76(6), 709-722. Filitz, R., Henkel, J., & Tether, B. S. (2015). Protecting aesthetic innovations? An exploration of the use of registered community designs. Research Policy,44(6), 1192-1206. Flikkema, M., De Man, A. P., & Castaldi, C. (2014). Are trademark counts a valid indicator of innovation? Results of an in- depth study of new benelux trademarks filed by SMEs. Industry and Innovation, 21(4), 310-331. Mendonça, S., Pereira, T. S., & Godinho, M. M. (2004). Trademarks as an indicator of innovation and industrial change. Research Policy, 33(9), 1385-1404. Millot, V. (2011). Firms’ Intangible Assets: Who Relies on Trademarks? Analysis of French and German Firms’ Trademarking Behaviour. In DRUID Society Conference', Copenhagen, Denmark. Miozzo, M., & Soete, L. (2001). Internationalization of services: a technological perspective. Technological Forecasting and Social Change, 67(2), 159-185. Pavitt, K. (1984). Sectoral patterns of technical change: towards a taxonomy and a theory. Research policy, 13(6), 343-373. Teece, D. J. (1986). Profiting from technological innovation: Implications for integration, collaboration, licensing and public policy. Research policy, 15(6), 285-305. Table 1: overview of linked data components Patents All unique simple patent families (a group of patents with exactly the same priority) by Dutch applicants filing patents at EPO (European Patent Office), WIPO (World Intellectual Property Organization) and/or Netherlands Patent Office in the period 2006-2010. Trademarks All trademarks filed by Dutch applicants at BOIP (Benelux Intellectual Property Office) and/or EUIPO (European Union Intellectual Property Office) in the period 2006-2010 were taken into account. Design rights All industrial design rights filed by Dutch applicants at BOIP (Benelux Intellectual Property Office) and/or EUIPO (European Union Intellectual Property Office) in the period 2006-2010 were taken into account. Plant breeders rights All national rights filed by Dutch applicants at the Dutch Board for Plant Varieties and/or Community plant variety rights filed at the CPVO (Community Plant Variety Office) in the period 2006-2010 were taken into account. Firm data All Dutch firms registered at the Chambers of Commerce. Variables: NACE-codes for economic activity, size classes taken from LISA Employment register Table 2: Matching results of IPR applicants to Dutch business register number of applicants number of applications firms matched firms unknown (not matched) private persons firms (matched) firms unknown (not matched) private persons patents 5035 314 (6%) 2822 35661 323 3381 trademarks 28201 7434 (26%) 7025 66625 13223 15212 design rights 1808 213 (12%) 17 12080 469 54 breeders rights 563 45 (7%) 59 9690 245 277