1. "fi, sf" RTA P2004#65 NASA Topic No B3.05 CN: NNC05CA09C Phase II Final Report June 2, 2007
Executive Summary
The overall goal of this program (through Phase III) is the development of an analyzer integrated into the
International Space Station toilets capable of detecting key chemicals in urine to monitor and assess astronaut health.
The analyzer will employ a novel metal-doped sol-gel material to simultaneously extract and quantify these key
chemicals using surface-enhanced Raman spectroscopy (SERS). During the Phase I program feasibility was
successfully demonstrated by chemically extracting 3-methylhistidine, a muscle-loss indicator, and Raloxifene, a
bone-loss inhibitor from reconstituted urine and obtaining their SER spectra in 1-mm glass capillaries. During the
Phase II program the following success were achieved:
1) 50 biochemicals (12 biomarkers, 13 drugs, and 25 potential interfering urine components) were
successfully measured using these SERS-active capillaries.
2) The biomarkers and drugs were successfully detected at physiological concentrations (1 mg/L, and 0.01
mg/L, respectively).
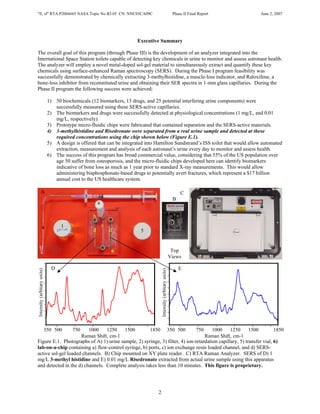
3) Prototype micro-fluidic chips were fabricated that contained separation and the SERS-active materials.
4) 3-methylhistidine and Risedronate were separated from a real urine sample and detected at these
required concentrations using the chip shown below (Figure E.1).
5) A design is offered that can be integrated into Hamilton Sundstrand’s ISS toilet that would allow automated
extraction, measurement and analysis of each astronaut’s urine every day to monitor and assess health.
6) The success of this program has broad commercial value, considering that 55% of the US population over
age 50 suffer from osteoporosis, and the micro-fluidic chips developed here can identify biomarkers
indicative of bone loss as much as 1 year prior to standard X-ray measurements. This would allow
administering bisphosphonate-based drugs to potentially avert fractures, which represent a $17 billion
annual cost to the US healthcare system.
A C
3 2 B
a
b
4 1 c
d d 5
6 Top
Views
D E
350 500 750 1000 1250 1500 1850 350 500 750 1000 1250 1500 1850
Raman Shift, cm-1 Raman Shift, cm-1
Figure E.1. Photographs of A) 1) urine sample, 2) syringe, 3) filter, 4) ion-retardation capillary, 5) transfer vial, 6)
lab-on-a-chip containing a) flow-control syringe, b) ports, c) ion exchange resin loaded channel, and d) SERS-
active sol-gel loaded channels. B) Chip mounted on XY plate reader. C) RTA Raman Analyzer. SERS of D) 1
mg/L 3-methyl histidine and E) 0.01 mg/L Risedronate extracted from actual urine sample using this apparatus
and detected in the d) channels. Complete analysis takes less than 10 minutes. This figure is proprietary.
2
2. "fi, sf" RTA P2004#65 NASA Topic No B3.05 CN: NNC05CA09C Phase II Final Report June 2, 2007
" On-Demand Urine Analyzer "
Part 1: Table of Contents
Project Summary ..........................................................................................................................................................1
Executive Summary.......................................................................................................................................................2
Part 1: Table of Contents ..............................................................................................................................................3
Part 2: Identification and Significance of the Innovation .............................................................................................3
Part 3: Technical Objectives.......................................................................................................................................11
Part 4: Work Plan (Phase II Results) ..........................................................................................................................13
Part 5: Potential Applications .....................................................................................................................................53
Part 6: Contacts...........................................................................................................................................................53
Part 7: Future Technical Activities .............................................................................................................................55
Part 8: Potential Customer and Commercialization Activities ...................................................................................55
Part 9: Resources Status .............................................................................................................................................57
Part 10: References.....................................................................................................................................................58
Part 2: Identification and Significance of the Innovation
This part is reproduced verbatim from the Phase I proposal.
This Small Business Innovation Research program will develop a novel surface-enhanced Raman (SER) sensor that
will perform real-time chemical analysis of urine. It will provide key physiologic information to monitor astronaut
health and indicate appropriate preventative treatment. The Phase I program will demonstrate feasibility by
establishing the ability of sol-gel chemistry to both select key chemicals: amino acids, biomarkers, drugs, and
metabolites, and enhance their Raman signals. The Phase II program will design and build a prototype “On-
Demand Urine Analyzer” for ground-based measurement. This will include interfacing the SER sensor between a
sampling system and a Raman instrument. The Phase II program will also design a low mass, low power version of
this system (Figure 1) to be used on the International Space Station (ISS) and other vehicles employed during
extended space flight missions (e.g. Mars expedition).
Toilet Data & Power Field Bus
Urine Sample
Separator System
Power
Supply
To Solid Molecules Sol-Gel
Waste Computer in Solution Matrix
(circuit boards) Raman
Filter Scattering
Laser
Fiber
Optics Raman Metal
Spectrometer Particle
Sample Laser
Delivery
Pump Adsorbed
Flow Cell with Molecules
One of four
Block Out Chemically Selective Chemically Selective
To Water SER-Active Discs
Reclaimation Valves SER-Active Discs
System
Figure 1. Block diagram of surface-enhanced Raman based urinalysis system. A pump or flush mechanism draws
the sample from the process through a particle filter into a flow cell and back into the process. Four sol-gel coated
discs in the side wall provide polar-positive, polar-negative, weakly polar-positive and weakly polar-negative
chemical selectivity and SER-activity. The proposed system will weigh 7.6 kg, occupy a 20x12x10 cm space (0.1
cubic foot), and require 20 watts (pump not included). Expanded view illustrates surface-enhanced Raman
scattering from one of the sol-gel coated discs. This Illustration is Confidential and Proprietary.
2.1. The Problem or Opportunity - Extended weightlessness causes numerous deleterious changes in human
physiology, including space motion sickness (SMS), cephalad fluid shifts, reduced immune response, and loss of
bone and muscle mass.1-6 The need to monitor and assess these effects is critical to developing exercise programs or
drug regimes that would maintain astronaut health.7 Many of these physiological changes are reflected in the
chemical composition of urine.8-13 For example, 3-methylhistidine can be used to assess loss of muscle mass,
hydroxyproline to assess bone loss, and uric acid to assess renal stone formation,11 while metabolites can be
analyzed to regulate dosage of anti-SMS drugs.14 According to the National Research Council Space Studies Board,
3
3. "fi, sf" RTA P2004#65 NASA Topic No B3.05 CN: NNC05CA09C Phase II Final Report June 2, 2007
"Analysis of in-flight specimens for markers of bone resorption and formation would offer a unique opportunity to
determine relative efficacy of these various exercise programs."15 The Board further states that current exercise
regimes are ineffective and physiological data is inadequate to properly develop methods to offset the maladies of
weightlessness. Furthermore, these physiological changes also influence metabolism of therapeutic drugs used by
astronauts during space flight. Unfortunately, current earth based analytical laboratory methods that employ liquid
or gas chromatography for separation and fluorescence or mass spectrometry for trace detection are labor intensive,
slow, massive, and not cost-effective for operation in space, regardless of the type of bio-fluid sample analyzed.16-20
Therefore, the ability to assess and rapidly diagnose the status of individual bio-fluid samples “on-demand” is a
critical and necessary component for monitoring the health and future well being of the crew members during
extended flight missions in space.
2.2. The Innovation - We at Real-Time Analyzers (RTA) believe a light-weight, real-time analyzer can be
developed based on surface-enhanced Raman spectroscopy (SERS) to provide detection and identification of several
key chemicals (amino acids, biomarkers, drugs, and metabolites) in urine at relevant concentrations (from ng/mL to
microg/mL) in under 5 minutes. This approach is based on the extreme sensitivity of the SERS technique, which
has been demonstrated by detection of single molecules,21,22 and the ability to identify molecular structure of key
physiological chemicals and drugs through the abundant vibration information provided by Raman spectroscopy.
We proposed this concept in 2001 and received a high score, but not an award. Since that time we have made
several significant advances in our SER-active sol-gel technology, two of which address reviewer’s comments.
First, the sol-gel process is highly reproducible, and we guarantee SER-activity at 20% RSD for our Simple SERS
Sample Vials, now sold commercially for 2 years (Figure 2). Second, we have successfully coated glass capillaries
that are capable of measuring analytes in a flowing solution, reversibly (Figure 3) and capable of performing
chemical separations.23 Additional important aspects of the technology include: third, we have patented the sol-gel
process (NASA sponsored) that incorporates silver and/or gold nanoparticles into a stable porous silica matrix.24,25,26
1008 cm-1 band intensity for BA
45
A
40.0-45.0
40 35.0-40.0
35 30.0-35.0
30 25.0-30.0
25
20.0-25.0
B
20
15.0-20.0
15
10.0-15.0
10
5.0-10.0
5
6 0 0.0-5.0
330
9
300
270
240
Height
210
12
180
150
along
120
90
60
15
vial (mm)
30
15o increments around vial
0
Figure 2. Reproducible SER-intensity response for Figure 3. Reversible SER spectra of 30-sec “plug” of
benzoic acid over entire surface of a Simple SERS benzoic acid flowing through a sol-gel coated capillary.
Sample Vial. Average = 29.1± 4.26 (14.6%) for 240 A) Spectra from time 0 to 2.4 min (bottom to top) and
points (10 sec per point). B) plot of corresponding 1000 cm-1 band intensity.
Spectra are each 8-sec, using 100 mW of 785 nm.
Fourth, virtually all solvents can be used, including aqueous solutions ranging in pH from 2 to 11. No special
reagents or conditions are required. Fifth, we have used these metal-doped sol-gels to measure SER spectra of
several hundred chemicals,27,28,29,30,31,32 with typical detection limits of 1 ng/mL using 100 mW of 785 nm and 3-min
acquisition time. Sixth, we have measured creatinine, lactic acid, uric acid, and actual urine specimens by simply
adding the samples to vials and recording the SER spectra (Figure 4).33-35 Furthermore, in preparation of this
proposal, we measured 1 mg of 3-methylhistidine in 1 mL of water and estimate a current detection limit of 60
microg/mL (0.35 mM, 6 ppm, Figure 5). It is worth noting that most drugs contain nitrogen functionalities
indicative of SER activity, and we have been able to measure drugs and their metabolites (Figure 6).36 Although
physiological measurements require detection limits below 1 microg/mL for biomarkers and as low as 10 ng/mL for
drugs and their metabolites, we believe improvements in sol-gel chemistry and instrumentation would allow
4
4. "fi, sf" RTA P2004#65 NASA Topic No B3.05 CN: NNC05CA09C Phase II Final Report June 2, 2007
Confidential Proprietary Information
achieving these detection limits. Seventh, the choice of metal and alkoxide can be used to develop chemically
selective sensors. We have successfully developed sol-gels that select for polar-positive, polar-negative, weakly
polar-positive, and weakly polar-negative chemical species.37 This will allow discriminative enhancement of the
biomarkers or drugs in favor of urine components. Finally, it is worth noting that RTA has developed an extremely
rugged, compact Raman instrument that employs interferometry for absolute wavelength accuracy and an avalanche
Si detector that improves sensitivity by ~100 times.38 And we are currently developing a hand portable, battery
powered version of the system for the Navy, which will weigh 9.8 kg, occupy 13,500 cc (0.5 cubic foot), require
23.5 W, and will be capable of wireless communication.39
N COOH
H
NH 2
N
relative intensity
R
relative intensity
A
A
B
B
uric acid
Wavenumbers (∆cm-1) Wavenumbers (∆cm-1)
Figure 4. SERS of A) female and B) male urine Figure 5. A) Raman and B) SERS of 3-methylhistidine
specimens. Both samples were pH of 6.5 and diluted (R= CH3). Conditions: Raman, pure solid, 500 mW and 3
to 50% with water. Bands attributed to uric acid occur min scan, SER, 6mM, 100 mW and 3 min. Labeled SER
at 502, 650, 815, 1134, and 1616 cm-1. Conditions: bands have been observed for histidine (R = H) by
120 mW of 1064 nm, 50 scans at 8 cm-1. electrolytic SERS. Inset: molecular structure.
2.3. The Proposal - The overall objective of the proposed program (through Phase III) is the development of an
analyzer integrated into the ISS toilets capable of immediate detection of key chemicals in urine to monitor and
assess astronaut health (complete analysis within 5 minutes of flush). The focus of Phase I will be to establish the
ability of the sol-gel chemistry to both select these key chemicals and enhance their Raman signals. These key
chemicals, listed in Table 1, include: urine products, hormones, muscle loss, bone loss and stone forming indicators
(biomarkers), drugs and their metabolites. This will be achieved in three tasks. The first task will employ
combinatorial chemistry to synthesize 36 libraries of metal-doped sol-gel coated micro-plates varying in alkoxide
composition (Si:Si = 1:0 or 1:1 v/v) to be screened for analyte specific SER activity in Task 2. This will be
Urine Products (g/L):* Muscle Loss Indicators (<mg/L):**
creatinine (1.4) 3-methyl histidine A
glucose (0.1)
glutamic acid (0.3) Bone Loss Indicators(<mg/L):
hippuric acid (0.9) hydroxyproline
hydroxyproline (0.9) deoxypyridinoline
lactic acid (0.2) B
nicotinic acid (0.25) Stone Formation Indicators (<mg/L):
PABA (0.2) calcium oxalate
uric acid (0.2) calcium phosphate
thiamine (0.2) uric acid C
histidine (0.2)
pyridoxamine (0.1) Drugs (~microg/L):
Hormones (g/L): alendronate - for Anti bone loss
pregnanediol (0.9) scopolamine - for Anti motion sickness D
pregnanetriol (2.2) D-penicilamine - for Anti stone formation
raloxifene - for Anti bone loss
estradiol lovastatin - for Anti bone loss
Table 1. Partial list of chemicals in urine, muscle loss,
Wavenumbers (∆cm-1)
bone loss, and stone formation indicators, and
Figure 6. SER spectra of A) amobarbital, B) barbital,
administered drugs.
C) phenobarbital, and D) secobarbital. Conditions: 1
*To be measured in Task 3.
**Chemicals in italics to be measured in Task 2. mg/ml (analyte/methanol) in sol-gel coated sample
vials, 80 mW of 1064 nm, 50 averaged scans.
5
5. "fi, sf" RTA P2004#65 NASA Topic No B3.05 CN: NNC05CA09C Phase II Final Report June 2, 2007
Confidential Proprietary Information
accomplished by varying reactant concentrations delivered to 96 well micro-plates. Reactant variables include eight
Si-alkoxide precursors (tetramethylorthosilicate (TMOS), tetraethylorthosilicate (TEOS), methyltrimethoxysilane
(MTMOS), ethyltrimethoxysilane (ETMOS), methyltriethoxysilane (MTEOS), ethyltriethoxysilane (ETEOS),
aminotrimethoxysilane (ATMOS), and aminotriethoxysilane (ATEOS)), and two types of metal particles (silver or
gold). The second task will screen the sol-gel libraries with key physiological chemicals and drugs for SER activity.
This will be accomplished by measuring the SER spectra of library subsets using the following four standard
chemicals: p-aminobenzoic acid (PABA), aniline (AN), benzoic acid (BA), and phenyl acetylene (PA); and twelve
initial target chemicals: 3-methyl histidine, hydroxyproline, deoxypyridinoline, calcium phosphate, uric acid,
alendronate, scopolamine, dextroamphetamine, raloxifene, lovastatin, acetaminophen, and acetylsalicylic acid. The
third task will demonstrate the ability of the proposed sol-gel SERS plates to discriminatively detect and quantify the
key chemicals in a chemical matrix equivalent to a urine specimen. This will be accomplished by analyzing the
chemicals in simulated urine samples prepared according to clinically defined formulations representing an average
human composition. An initial chemometrics urinalysis model will be developed for identifying, quantifying and
correlating key components in urine of physiological interest with the Raman spectra.
2.4. The Probability of Success - Dr. Frank Inscore, as the Principal Investigator, and Dr. Stuart Farquharson, as
Program Manager, and Dr. John Murren of Yale University as a Consultant have the required expertise to perform
the proposed research. The PI has over eight years experience in designing Raman systems to make difficult and
demanding measurements requiring extreme sample preparation protocols and rigorous optical alignment procedures
for collecting reproducible spectral data. This includes the implementation of continuous wave (CW), pulsed, and
solid-state lasers combined with dispersive instrumentation and multichannel detection employing a charge coupled
device (CCD) for acquiring normal Raman and resonance enhanced Raman spectra of various inorganic-organic
models of related metalloprotein enzymatic systems.40,41,42,43 The PI also has extensive experience in designing and
collecting Raman data for various sampling configurations, sample states and conditions (e.g., in vacuo and at
cryogenic temperatures). The PI also has acquired considerable expertise and experience in the analysis and
application of FT-Raman, SERS and metal-doped sol-gel chemistry at RTA that is relevant to the successful
completion of the proposed project. The PM has the experience and expertise in the analysis and application of FT-
Raman.25,44,45,47 The PM also has considerable experience and expertise in designing new Raman analyzers for
many applications including sensor design for Raman and surface-enhanced Raman spectroscopy applications.24-,46-
52
This includes numerous sampling systems, and several Raman systems, including a state-of-the-art fiber optic FT-
Raman spectrometer.52,53 He has designed, patented, and implemented several fiber optic probes for in-situ remote
monitoring in harsh physical and chemical environments.54 Dr. Farquharson also has extensive experience in
performing and managing large interdisciplinary experimental research projects. He has been the Principal
Investigator or Manager on contracts from DOD, DOE, NASA, NIH and NSF. Dr. John Murren is a Professor at
Yale University School of Medicine (Medical Oncology) and Director of the Lung Cancer Treatment Unit. Dr.
Murren is very active in the evaluation of new chemotherapy drugs and drug combinations used for cancer
treatment. He will provide guidance in our urinalysis experiments (e.g. likely interferents), and understanding of
drug metabolic pathways.55 Finally, we presented a conceptual Urine Analyzer design to Hamilton Sundstrand,
which was very well received. Based on their design review, and our previous working relationship, Hamilton
Sundstrand will support our Phase II research and Phase III commercialization efforts (see support letter).
2.5. Background and Technical Approach - We at Real-Time Analyzers believe that a method based on surface-
enhanced Raman spectroscopy can be developed to provide real-time detection and quantification of several key
chemicals, biochemicals, and metabolites in urine to monitor astronaut health and indicate appropriate preventive
treatment. This is based on our SERS detection of several chemicals, such as creatinine, lactic acid, and uric acid in
urine specimens, the DNA bases, amino acids, including 3-methylhistidine, and numerous drugs and their
metabolites (see Figures 4 – 6).24 A background to this approach follows.
Microgravity and Human Physiology - Extended weightlessness causes numerous deleterious changes in human
physiology, including space motion sickness (SMS), cephalad fluid shifts, reduced immune response, and loss of
bone and muscle mass. The signs of SMS (nausea, dizziness) and fluid shifts (headaches, increased heart rate) are
easily detected, while changes in hormone and bone metabolism are not. Consequently, a more detailed analysis of
astronaut physiology is required to assess these effects. Many of these physiological changes are reflected in the
chemical composition of urine. For example, 3-methylhistidine is a known product of muscle protein breakdown
and is quantitatively excreted in urine,8-10 while the urinary concentration of hydroxyproline and deoxypyridinoline
released during collagen breakdown show promise as indicators of bone turnover.11,12 Renal stone formation,
6
6. "fi, sf" RTA P2004#65 NASA Topic No B3.05 CN: NNC05CA09C Phase II Final Report June 2, 2007
associated with bone loss, can be evaluated by analyzing for calcium oxalate, calcium phosphate, uric acid, citrate,
magnesium ammonium phosphate, and other stone-forming salts. Furthermore, the metabolic products of drugs
administered to relieve SMS (e.g. promethazine and scopolamine),56-58 reduce muscle loss (amino acid infusion59) or
bone loss (alendronate, lovastatin,60 raloxifene61), or renal stone formation (e.g. D-penicilamine) can be analyzed to
regulate dosage and adjust diet. Unfortunately, the approach used in previous missions (shuttle and Mir), astronauts
logging their diet, collecting and sending urine samples back to earth for analysis, would not allow timely preventive
measures. This wait may further jeopardize the health of astronauts performing physical labor associated with the
construction of the International Space Station. In particular, a normal dose of an anti-SMS drug for one astronaut
may metabolize as a high dose for another, causing drowsiness and making tasks difficult to perform and potentially
dangerous.7,62,63,64
Earth based urinalysis employs multiple steps to separate the chemicals and perform the required detection. This
typically includes particulate filtration, pH adjustment, and chromatographic separation (usually high performance
liquid chromatographic, HPLC), prior to introduction into a mass spectrometer (MS). Inclusion of standards
throughout this process is required to ensure measurement accuracy. These methods are labor intensive and time
consuming, and the massive instruments (e.g. MS) are inappropriate for the ISS. It should be noted, however, that
an effort to make this traditional approach to urinalysis practical for the ISS has been undertaken by a research team
at Johns Hopkins University headed by Dr. Potember.18,65 They have developed a rugged time-of-flight mass
spectrometer (TOFMS) to measure biomarkers. Virtues of the TOFMS technologies are that it is small (less than one
cubic ft), lightweight (less than 5 kg), and requires low power (less than 50 watts). To introduce quantitative
samples into the TOFMS, without time consuming chromatographic columns (>30 minutes analysis times), the
Johns Hopkins team has been investigating matrix-assisted laser desorption ionization (MALDI) sampling. With
MALDI sampling, a matrix standard must be used (and supplied), and high-powered ultraviolet pulse lasers are
required. Unfortunately, these lasers are inefficient and typical power requirements are near 100 W.
The ability to monitor and assess the effectiveness of therapeutic agents used by astronauts during space flight is
also problematic. Evidence exists that suggest the therapeutic effectiveness of some drugs, such as
scopolamine/dextroamphetamine (a drug combination used to prevent motion sickness) and acetaminophen (a drug
used frequently for pain relief by astronauts) may change in space. This is reflected by the fact that concentration
levels of such drugs (and hence their pharmacokinetic behavior) measured in bio-fluid samples (blood-plasma,
urine, and saliva) during the course of pre- and post-flight time by typical chromatographic, mass spectrometric and
immuno-assay techniques on earth are not invariant, and that these subsequent changes ultimately depend on
mission length and individual physiological responses to space flight.
According to the National Research Council Space Studies Board "Analysis of in-flight specimens for markers of
bone resorption and formation would offer a unique opportunity to determine relative efficacy of these various
exercise programs."15 The Board further states that the current exercise regimes are ineffective and physiological
data is inadequate to properly develop methods to offset the maladies of weightlessness. The proposed system will
allow pre- and post-flight ground analysis at the end of Phase II and on-station analysis shortly thereafter (through
Phase II production by Hamilton Sundstrand).
Raman Spectroscopy - Similar to an infrared spectrum, a Raman spectrum consists of a wavelength distribution of
bands specific to molecular vibrations corresponding to the sample being analyzed, which allows confident
identification of chemicals and biochemicals (selectivity). For example, Figure 5 shows the Raman spectrum of 3-
methyl histidine, which is slightly different from that of histidine. In practice, a laser is focused on the sample, the
inelastically scattered radiation (Raman) is optically collected, and directed into a spectrometer, which provides
wavelength dispersion, and a detector converts photon energy to electrical signal intensity. Historically, the very
low conversion of incident radiation to inelastic scattered radiation limited Raman spectroscopy to applications,
which were difficult to perform by infrared spectroscopy, in particular, aqueous solutions. In addition to sensitivity,
Raman spectroscopy has been limited by long-term instrument stability, fluorescence interference, and wavelength
reproducibility. These four limitations have been largely overcome in the past decade by several technological
advances, principally: air cooled stable diode lasers, notch filters, full spectrum detectors (i.e. no scanning), high
quantum efficiency detectors, and associated fast electronics, data acquisition and analysis, which have made Raman
spectroscopy standard equipment in analytical laboratories,66 and allowed the development of portable systems. An
attractive advantage to this technique is that in many cases samples do not have to be extracted or prepared, and a
fiber optic probe can simply be aimed at a sample to perform chemical analysis. In this regard, Raman spectroscopy
7
7. "fi, sf" RTA P2004#65 NASA Topic No B3.05 CN: NNC05CA09C Phase II Final Report June 2, 2007
has been used to identify various chemicals (within glass cylinders). However, these measurements are best
performed for pure or at least highly concentrated samples. Further improvements can be realized by using a
Fourier transform Raman spectrometer.67 These systems employ diode pumped Nd:YAG lasers that provide
excitation in the near infrared, virtually eliminating fluorescence interference associated with visible laser excitation.
Another advantage of FT systems is high wavelength accuracy (Connes advantage)68afforded by the HeNe
wavelength reference laser. This allows reliable spectral subtraction and library matching,69 as well as continuous or
"on-demand" monitoring. Spectral subtractions can be used to isolate contributions of trace chemicals in the
presence of much more concentrated interferent chemicals,69,69 and library matching can provide rapid chemical
identification. The former may be very important, in that uric acid produces a significant SER spectrum that might
need to be subtracted to observe other key chemicals. It also allows employing other urine components as internal
concentration standards, such as creatinine to quantify 3-methyl histidine. Here, however, spectral analysis will be
augmented by the chemical selectivity of the sol-gels to be developed (see below). Nevertheless, even with these
improvements, the very low conversion of incident radiation to inelastic scattered radiation limits the sensitivity of
Raman spectroscopy and provides only moderate detection limits for normal Raman scattering. Relatively high
laser powers and long acquisition times are required to obtain a spectrum with a reasonable S/N, which in general
still allow only modest detection limits to be estimated for normal Raman. For example, Figure 5 shows Raman
spectra of pure 3-methyl histidine. The detection limit for 3-methyl histidine in water or lactic acid is ~1% (Figure 5
is a pure solid sample). Thus, normal Raman scattering would be capable of only moderate detection limits, such as
100 mg/mL.
Surface Enhanced Raman Spectroscopy - In 1974,70 it was discovered that when a molecule is in close proximity
to a roughened silver electrode, the Raman signal was increased by as much as six orders of magnitude.49 The
mechanism responsible for this large increase in scattering efficiency has been the subject of considerable research.71
Briefly, the incident laser photons generate a surface plasmon field at the metal surface that provides an efficient
pathway to transfer energy to the molecular vibrational modes, and produce Raman photons.71 This is possible only
if: 1) the material is in the form of particles much smaller than the laser incident wavelength (Raleigh regime,
surface imperfections of similar size also work) to couple the energy, 2) the material has the appropriate optical
properties to couple the light (extinction), 3) the available free electrons, when excited, are confined by the particle
size forming surface modes or generating surface plasmons, and 4) the molecule has matching optical properties
(absorption) to couple to the plasmon field.49,72 These very specific conditions, restrict SERS to the coinage metals,
silver, gold, and copper with diameters between 5 and 200 nm.72,73
SERS has been demonstrated for a number of inorganics, organics, and biochemicals, using three primary methods
developed to produce SER active media: activated electrodes in electrolytic cells,48 activated silver and gold colloid
reagents,74,75,76 and metal coated substrates.77,78,79,80,81 Unfortunately, these methods have not been reduced to a
product because it has proven difficult to manufacture a surface by these methods that yields reproducible
enhancements or reversible adsorptions or both. Oxidation-reduction cycles are used to create surface features
(roughness) on electrodes with the appropriate size to generate surface plasmons, but this roughness is difficult to
reproduce from one measurement to the next.49,82 Reducing a metal salt solution can be used to produce a colloid
containing metal particles capable of generating surface plasmons. The resultant particle size and aggregate size are
strongly influenced by the initial chemical concentrations, temperature, pH, and rate of mixing, and consequently are
also difficult to reproduce.75 Depositing one of the SER active metals onto a surface with the appropriate roughness
can also be used to prepare a surface capable of supporting surface plasmons. The largest enhancements are
obtained when the sample is dried onto the surface, in effect concentrating the analyte on the metal. This also
results in measurements that are difficult to reproduce. The relative merits and limitations of these methods have
recently been reviewed.83
In an effort to overcome these limitations, we have been developing metal-doped sol-gels as an active SER medium.
This medium should be capable of providing SER measurements that are reproducible, reversible, and quantitative,
yet are not restricted to specific environments, such as electrolytes, solvents, or evaporated surfaces. 24 The general
concept is shown Figure 1, where nanocomposite material has been coated on the inside walls of glass vials to yield
a general use SER product: Simple SERS Sample Vials. We have 1) measured the SER spectrum of 1
nanogram/milliliter of PABA in methanol (estimated detection limit of 10 pg/mL), and achieved a signal increase of
a factor of 107,25 2) have reproduced measurements from vial-to-vial with a standard deviation less than 10%, 3)
have demonstrated reversibility using a flowing system (within 5 minutes at 1 ml/min flow through a coated NMR
tube,25 and 4) we have successfully measured the amino acids, DNA bases, several drugs and their metabolites in
8
8. "fi, sf" RTA P2004#65 NASA Topic No B3.05 CN: NNC05CA09C Phase II Final Report June 2, 2007
Confidential Proprietary Information
both aqueous and non-aqueous solutions using our Simple SERS Sample Vials. In particular, we measured 1 mg of
3-methyl histidine in 1 mL of water and the signal-to-noise ratio (S/N) of 52 suggests a current detection limit of 60
microg/mL (defined as S/N=3, Figure 5). Measurements at the required detection limits (<1 microg/mL, Table 1) is
anticipated to be straightforward using a new hybrid FT-Raman spectrometer (increased sensitivity with 785 nm
laser and Si-APD) developed under another SBIR program (see Related R&D). However, we recently employed
785 nm laser excitation and found near-equivalent SERS-enhancement compared to previous 1064 nm laser
excitation, even when taking the ν4 wavelength dependency of Raman scattering into account. This suggested that
our particle size, distribution, and/or aggregation were far from optimum. In recent years we have used our Simple
SERS Sample Vials to measure several hundred different chemicals. In general, we calculate enhancement factors
between 104 and 106. (The difference is due to the polarizability of the analyte and/or the extent of interaction with
the metal.) These values may prove insufficient for detecting certain drugs and/or metabolites present at very low
concentration levels in the body fluids (e.g. 1ng/L to 1ng/mL). Except for highly polarizable molecules, we
typically measure LODs of 10 microg/L, suggesting that an improvement of 2 to 4-orders of magnitude is required
to achieve the lower detection limits. Recently, we re-evaluated our metal-doped sol-gels in regards to optimum
particle size and aggregation. TEM measurements show that the silver particles are largely unnaggregated and small
(5-20 nm). We are currently examining methods to increase particle size and aggregation (variations in
concentration and heating). According to theory improvements of 2 to 6 orders of magnitude can be expected.
Such improvements in both the instrumentation and metal-doped sol-gel chemistry will be important for
achieving the sensitivity required in this proposal.
Sol-Gel Chemistry - The sol-gel process is a chemical route for the preparation of metal oxides and other inorganic
materials such as glasses and ceramics.84,85 The sol-gel process involves the preparation of a sol of metal-alkoxide
precursors in a suitable solvent, which undergo a series of reactions including their initial hydrolysis followed by
poly-condensation to form a gel. Expulsion of the solvent from the gel by a drying process, results in a highly
porous xerogel consisting of the metal oxides and any other additives that may have been introduced during the
process. Additional heating (fired) can be used to crystallize and/or densify the material. Typically, the sol-gel
process involves a silicon alkoxide (such as tetramethyl orthosilicate), water and a solvent (methanol or ethanol),
which are mixed thoroughly to achieve homogeneity on a molecular scale. The sol-gel matrixes offer several
additional properties useful to the proposed ISS application: physical rigidity and high abrasion resistance,
negligible swelling in aqueous solutions, chemical inertness, high photochemical and thermal stability, and excellent
optical transparency, and low intrinsic fluorescence.86 We have successfully developed metal-doped sol-gels that
can coat a variety of substrate-surfaces to produce a wide range of sensor designs, including glass vials, multi-well
microplates (glass and polystyrene), and glass capillaries. We have used the latter to detect flowing samples as well
as to perform chemical separations.
The Simple SERS Sample Vials are produced according to the following procedure. First, a silver amine precursor
complex is prepared from a solution of ammonium hydroxide and silver nitrate. Second, the sol-gel solution is
prepared from TMOS and methanol. Third, the amine complex and sol-gel solution are mixed, then the solution is
spin-coated onto the inner walls of a glass vial, and dried. Fourth, the substrate is heated to form the xerogel. This
step defines the porosity (size and distribution) and silver particle size. Fifth, the silver ion is reduced to silver metal
particles (Ago) using dilute sodium borohydride. And sixth, the substrate is washed and dried prior to the addition of
a sample. Previously, we established that a volume ratio of 1:5:4, silver amine complex to TMOS to methanol
heated at 120 oC for 2 hours yielded optimum SERS signals for PABA.25 It is worth noting that gold-doped sol-gel
coated vials have also been prepared in a similar fashion by using an aqueous solution of HAuCl4 (or NaAuCl4),
nitric acid as a gellation catalyst, and a Si-alkoxide precursor (e.g. TMOS). These conditions were optimized using
a simplistic experimental design approach. Knowledge of sol-gel chemistry and surface-enhancement theory was
used to optimize chemistry and physical properties, while performing a minimum number of experiments.
Nevertheless, the use of only PABA to maximize the sensitivity may have reduced the sensitivity to other analytes.
For example, we estimate a surface enhancement of <105 for 3-methyle histidine. Unfortunately, tailoring
sensitivity to every analyte of interest would be time consuming and tedious.
Combinatorial Chemical Synthesis - To alleviate this problem, we are employing combinatorial chemistry to
systematically synthesize large numbers of well-defined sol-gel compositions (libraries) by combining the reactants
in all combinations.87 We are employing 96-well micro-plates to develop the chemistry. Initially two reservoirs (8
and 12-cell) are filled with the two starting solutions (here TMOS and the amine complex) with incrementally
increasing concentrations. Then multi-channel pipettes (8 and 12) are used to deliver microliter samples to each
9
9. "fi, sf" RTA P2004#65 NASA Topic No B3.05 CN: NNC05CA09C Phase II Final Report June 2, 2007
well fairly rapidly (by hand it takes ~4 minutes). Once completed, the plate is placed into an oven to cure the sol-
gel. We are able to prepare as many as 20 plates per day or 1892 sol-gels with different SERS activity. The success
of a library is determined by testing the activity of the sol-gel coated well. Since the number of wells quickly
escalates using this procedure, testing of each well becomes impossible and high-throughput screening techniques
are used. This is accomplished by selecting and testing an ordered subset of the 96 wells. The most active wells can
be used to refine the chemistry and improve SERS activity.
Using this approach, we have modified the alkoxide chemistry to obtain SERS active sol-gels that preferentially
"solvate" polar or non-polar analytes. For example, the alkoxide precursor MTMOS has a higher -CH3
concentration (lower -OH) than TMOS, and consequently a higher affinity for non-polar chemicals
(hydrophobic).86,88 Task I will focus on employing combinatorial chemistry to develop sol-gels that are selective
and active (and stable) towards various key analytes to be screened for in Task II and Task III. During the past year
we successfully developed our first chemically selective SER-active sol-gels, consisting of the four Libraries
outlined in Table 2.
Table 2. Summary of chemically selective surface-enhanced Raman active metal-doped sol-gels.
Library 1 Ag + TMOS Selective for polar-negative species
Library 2 Ag + (TMOS+MTMS) Selective for weakly polar-negative species
Library 3 Au +TMOS Selective for polar-positive species
Library 4 Au + TEOS Selective for weakly polar-positive species
Figure 7 shows surface-enhanced Raman spectra of p-aminobenzoic acid (PABA) using Library 1 and 3, and phenyl
acetylene (PA) using Library 2 and 4. For Libraries 1 and 3, the polar PABA passes through the polar sol-gel and is
enhanced by either the silver or gold particles. For electropositive silver, the PABA anion (pKa = 4.8) interacts
through the carboxylate group and COO- bands appear at 840 and 1405 cm-1. For electronegative gold, PABA
interacts through the amine group and -NH2 bands appear at 1355 and 1585 cm-1. For Libraries 2 and 4, the non-
polar PA passes through the non-polar sol-gel and is enhanced by either the silver or gold particles. For
electropositive silver, PA interacts strongly through the cylindrical π cloud around the carbon-carbon triple bond and
a -C≡C- doublet occurs near 2000 cm-1. For electronegative gold, this interaction is unlikely and only very weak
bands occur near 2000 cm-1. The polar/non-polar selectivity of the polar-negative and weakly polar-negative sol-
gels was tested by adding a 1:1 molar mixture of PABA and PA. The selective enhancement is quite good (Figure
8). The spectrum obtained using the polar sol-gel suggests 78% PABA and 22% PA reached or is active at the metal
surface, while the spectrum obtained using the weakly polar sol-gel suggests a 9% PABA and 91% PA activity. The
band peak intensities at 2000 cm-1 for PA and 1450 cm-1 for PABA were used for these calculations, and are
expanded in Figure 8 for clarity. Silver-doped TMOS favored more rapid transit of the polar PABA than the non-
polar PA.
A B
C CH
H2N COOH
relative intensity
relative intensity
Wavenumber (∆cm-1) Wavenumber (∆cm-1)
Figure 7. SER spectra of A) PABA using Libraries 1 (top) and 3 (polar-negative and polar-positive sol-gels), and B)
PA using Libraries 2 (top) and 4 (weakly polar-negative and weakly polar-positive sol-gels). PABA is 1 mg/mL,
PA is 1% v/v. Spectral conditions: 75 mw 1064 nm, 100 scans (1.5 min), 8 cm-1 resolution. The y-axis for all
spectra represent intensity in arbitrary units.
10
10. "fi, sf" RTA P2004#65 NASA Topic No B3.05 CN: NNC05CA09C Phase II Final Report June 2, 2007
Confidential Proprietary Information
A C
relative intensity
relative intensity
B D
Wavenumber (∆cm-1) Wavenumber (∆cm-1)
Figure 8. SERS of 1:1 M/M of PABA and PA in A) polar-negative and C) weakly polar-negative sol-gels. The
lower traces, compare the pure chemicals; B) 1 mg/ml PABA in polar-negative sol-gel and D) 1% PA in weakly
polar-negative sol-gel, while the insets magnify the minority species for clarity (x5 in A and x10 in B). Spectral
conditions as in Figure 5.
Part 3: Technical Objectives
The overall objective of the proposed program (through Phase III) is the development of an analyzer integrated into
the International Space Station (ISS) toilets capable of immediate detection of key chemicals in urine to monitor and
assess astronaut health.
The following six comprehensive tasks have been designed to develop this proposed analyzer, as well as the
required method of analysis with the following objectives and specific questions to be answered.
Task 1 - Spectral Library Development. The overall objective of this task is to build a SER spectral library to
allow rapid spectral matching (or functional group analysis) for identification of biochemical markers, drugs and
their metabolites present in human urine. This will be accomplished by extending the Phase I measurements to
include an in-depth analysis of 12 primary bio-indicators specific for assessing muscle/bone loss and renal stone
formation, and 12 priority drugs (and their metabolites) that may be used to minimize or counter the adverse
physiological affects associated with changes in the concentration levels of these biomarkers present in urine.
Questions to be answered? Are all of the 24 chemicals SER-active? What is the preferred sol-gel for each bio-
indicator and target drug? Are there potential interferants? How well does the spectral match software identify
each? How well does it identify a chemical not in the library?
Task 2 – Chemical Selectivity Development. The overall objective of this task is to refine the ability of the 4 basic
SER-active sol-gels developed in Phase I to selectively extract biochemicals and drugs present in human urine, and
enhance their Raman spectra. This will be accomplished by measuring reversibility of representative bio-indicators
and drugs drawn through the 4 sol-gels.
Questions to be answered? Which sol-gels provide irreversible adsorption of the bio-indicators and target drugs
and SER-activity? What are the estimated LODs? Can the spectral deconvolution software identify each urine
component (bio-indicators and drugs) on each sol-gel?
Task 3. Component selection and testing. The overall goal of this task is to design a lab-on-a-chip that can be
used to analyze chemical components present in human urine by SERS. This will be accomplished by designing a
chip based on the Phase I results and the background information provided above.
Questions to be answered: Are there components available to perform the desired extractions and separations?
Are they effective in the context of our SER-active sol-gels, separately, and together? What is the best sequence of
sol-gels? How universal is it for various urine components and drugs? Are the mixtures effectively separated and
11
11. "fi, sf" RTA P2004#65 NASA Topic No B3.05 CN: NNC05CA09C Phase II Final Report June 2, 2007
detected? What happens when other chemicals from Task 1 are analyzed? What are the detection limits?
Task 4. Lab-on-a-chip fabrication (with Advanced Fuel Research as subcontractor). The overall goal of this
task is to build many microfluidic chips that can be used to test the preliminary lab-on-a-chip design. This will be
accomplished by fabricating poly(methyl methacrylate) chips. The process of Muck et al., slightly modified, will be
followed.89 The microfluidic chips will be prepared in a class 10 clean room at AFR, and all safety (HF) procedures
will be followed.
Questions to be answered: Can AFR produce the test chips? Does the process need further modification? Does
the interface perform as planned (no leaks)? Can the various channels be loaded, reduced? What size, length is
best? Can separation materials be introduced?
Task 5. Define Analytical Figures of Merit. The aim of this task is to establish performance criteria for the lab-
on-a-chip. This will be accomplished by measuring the analytical figures of merit for the analyzer, as outlined by
the FDA: sensitivity, reproducibility, linearity, accuracy, precision, resolution, and selectivity.
Questions to be answered: What are the LODs for each of the biomarkers, drugs and their metabolites? What is
the reproducibility of the chips? Which channel design provides the best selectivity, reproducibility, and sensitivity?
What is the best standardization method for quantitating target analyte concentrations?
Task 6 - Prototype Design. The overall goal of this task is to design a prototype system to be used and tested by
NASA in Phase III. This will be accomplished by redesigning the lab-on-a-chip for system integration and
autonomous operation. No questions to be answered.
12
12. "fi, sf" RTA P2004#65 NASA Topic No B3.05 CN: NNC05CA09C Phase II Final Report June 2, 2007
Confidential Proprietary Information
Part 4: Work Plan (Phase II Results)
Task 1 - Spectral Library Development. The overall objective of this task was to build a surface-enhanced Raman
spectral library to allow rapid spectral matching (or functional group analysis) for identification of biochemical
markers, drugs and their metabolites present in human urine. This was accomplished by measuring the SERS-
activity of 25 analytes and 25 potential interferents using some 20 different chemically-selective sol-gels
(Libraries).
The proposed 24 analytes (12 biomarkers and 12 drugs) that were the focus of this program are listed in Table T1.1.
Ten of the 12 biomarkers were commercially available (the two collagen bound bone-loss markers were not) and all
were SERS-active. Similarly, 10 of the 12 proposed drugs were commercially available, and all were SERS-active.
Three additional drugs (secondary) were also measured, including the metabolites of acetaminophen and allopurinol.
Table T1.1. List of biomarkers and associated drugs studied during Phase II.
Biomarkers Drugs
Muscle loss indicators: Deoxypyridinoline – Anti-bone loss: Anti-stone formation:
Creatinine (CRE) collagen bound* Etidronate (ETI) Hydrochlorothiazide (HCT)
3-Methylhistidine (3-MeHIS) Clodronate (CLO) Allopurinol (ALLO)
Bone loss indicators: Stone formation indicators: Pamidronate (PAM) Penicillamine (PEN)
Hydroxyproline (HO-PRO) Calcium oxalate (CaOx) Alendronate (ALE) Anti-motion sickness:
Hydroxylysine (HO-LYS) Calcium phosphate (CaP) Risedronate (RIS) Promethazine (PROM)**
Pyridinoline (H-Pyd) Uric acid (UA) Ibandronate (IBA) Scopolamine (SCOP) **
Pyridinoline-collagen bound* Cystine (CYST) Raloxifene (RAL) Anti-inflammatory:
Deoxypyridinoline (H-dPyd) Tiludronate*/Zoldronic acid* Acetaminophen (AM)**
* **
Four analytes not available. Additional drugs measured.
In the Phase I proposal we described 4 chemically-selective sol-gels (Libraries 1-4) to be used for this study. During
the Phase I program we modified the Library 1 and 2 chemistries to produce 4 additional sol-gels. During the Phase
II program, the number of chemistries was further expanded to some 20 available sol-gels that could be used for
screening chemical selectivity (see Quarterly Report 7). By examining many biomarkers and drugs using all 20
libraries it was found that 6 proved most useful. L1, L2, and L4 correspond to the chemistries designated 1, 2, and 4
while L3 corresponds to the chemistry designated 2d in the Phase I Final Report. We also developed and used two
new chemistries, which essentially are chemistry 1 (or L1) modified by the inclusion of polymers, either
poly(ethyleneglycol) or poly(dimethylsiloxane) (PEG and PDMS, respectively), designated L5 and L6. The relative
concentrations of the precursors used to prepare these 6 libraries are summarized in Table T1.2.
Table T1.2. Synthesis summary for SERS-active, chemically-selective, sol-gel chemical libraries (L1-L6).
Sol-Gel Metal Precursor (A) Sol-Gel Precursor (B) A B Selective for:
(µL) (µL)
L1 5/1/10: 1N AgNO3/28%NH3OH/MeOH 1/5: TMOS/MTMS 100 120 mildly polar - negative
L2 5/5/10: 1N AgNO3/28%NH3OH/MeOH MTMS 100 100 non-polar - negative
L3 5/5/10: 1N AgNO3/28%NH3OH/MeOH 1/5/1:TMOS/MTMS/ODS 100 175 very non-polar-negative
L4 4/1: 0.25N HAuCl4(aq)/70% HNO3 TMOS 100 100 very polar - positive
L5 5/1/10: 1N AgNO3/28%NH3OH/MeOH 1/5: TMOS/MTMS 100 120 polar – negative
(+ 10 µL PEG)
L6 5/1/10: 1N AgNO3/28%NH3OH/MeOH 1/5: TMOS/MTMS 100 120 non-polar - negative
(+ 10 µL PDMS)
APTMS: aminopropyltrimethoxysilane, MTMS: methyltrimethoxysilane, PDMS: polydimethylsiloxane, PEG: polyethylene
glycol, ODS: octadecyltrimethoxysilane, TMOS: tetramethylorthosilicate.
During the Phase I program, screening SERS-activity for the analytes using different sol-gels was initially
performed in 96-well microplates. It was found that better results were obtained using glass capillaries (1.1 mm
13
13. "fi, sf" RTA P2004#65 NASA Topic No B3.05 CN: NNC05CA09C Phase II Final Report June 2, 2007
Confidential Proprietary Information
outer diameter, 800 micron inner diameter) filled with metal-doped sol-gels. These capillaries operate in the active
mode, in that the sample is forced to flow through the sol-gel. We therefore used these capillaries to test SER-
activity for the analytes throughout the Phase II program. Furthermore, the capillaries became the basis of the Phase
II micro-chip sampling system. The basic design and use of the SER-active capillaries is shown in Figure T1.1, and
are prepared as follows. The alkoxide and amine precursors are prepared according to Table T1.2, mixed, and then
drawn into the capillary by syringe. Typically 0.4 mL of solution coats a 4 cm length of capillary. The sol solution
gels in 5 minutes, and a more rigid structure is obtained after 24 hours. A solution of 0.1g/100mL NaBH4 is drawn
through the capillary to reduce the metal. This is followed by a 0.035% HNO3 acid wash, and then the capillary is
then ready to be used.
Figure T1.1. Photograph of sol-gel coated melting point capillaries attached to syringes, before (top) and after
reduction with sodium borohydride.
Initial SERS-activity screening on the various sol-gels employed 1 mg samples in 1 mL HPLC water. The samples
were drawn into the capillaries, which were mounted on an XY sample stage above a fiber optic probe coupled to
RTA’s Industrial Raman Analyzer. Spectra were obtained using 80 or 100 mW of 785 nm excitation at the sample
and 1 minute acquisition time. Once the initial screening was performed, the samples were serially diluted over 4
orders of magnitude to 0.01 mg/L to determine sensitivity. The required sensitivity is ~ 1 mg/L for the metabolites
and 10s of microg/L for the drugs. Tables T1.3 and T1.4 summarize the SERS-activity in terms of the lowest
measured concentration (LMC) for the 10 biomarkers and 13 drugs, respectively. The best measurements were
ultimately obtained by concentrating the sample using ion exchange resins (Task 3), and are included in the tables
for comparison.
Also, normal Raman spectra (NRS) of the analytes were acquired as neat liquids or pure solids in the same glass
capillaries using 300 mW at 785 nm for 5 minutes. The NRS and SERS are shown for the 10 urinary biomarkers in
Figures T1.2-T1.11. This includes the two muscle loss indicators, CRE and 3-MeHIS, the quantifiable bone loss
indicators H-Pyd and H-dPyd, the non-quantifiable bone loss indicators HO-PRO and HO-LYS, and the stone
formation indicators, UA, CaP, CaOx and CYST. During the Phase I program we focused on hydroxyproline as an
indicator of bone loss, however, research into the chemical and metabolic reaction pathways associated with
osteoporosis indicates that free and bound pyridinoline and deoxypyridinoline, associated with collagen cross-
linking, are more quantitative indicators of bone loss. And they are present in urine. We were able to obtain the free
forms of pyridinoline and deoxypyridinoline from Quidel Corporation, but not their bound form. Analysis of
hydroxyproline is still important, and remained part of this study
Table T1.3. Summary of Biomarker screening results: SERS-response on select chemistries in mg/L.
CRE 3-MeHis HO-PRO HO-LYS H-Pyd H-Dpd CaP CaOx UA CYST
t
L1 1 1 neg 1000 dnt dnt 500 neg 500 1000
L2 1000 10 neg neg neg dnt 500 500 500 neg
L3 1000 1000 1000 neg 1.8 neg 1.8 500 500 500 neg
L4 neg neg 1 f
neg neg dnt neg neg neg neg
L5 neg 1000 neg neg dnt neg 1.8 500 500 500 1000
L6 1000 1000 neg neg dnt dnt 500 neg 500 neg
IEX
Library L1sL3d L5 L1t L3 L5 L5 L2 L1 L1
LMC 0.1 0.001 dnt 0.01 0.018 1.8 1 1 0.05 0.1
Peaks 1421 1563 1534 1397 1393 1372 925 894 633 613
dnt=did not try, f = flow method, t = TMOS only, S = SPE, d = +PDMS
14
14. "fi, sf" RTA P2004#65 NASA Topic No B3.05 CN: NNC05CA09C Phase II Final Report June 2, 2007
Confidential Proprietary Information
Table T1.4. Summary of Drug screening results: SERS-response on select chemistries in mg/L.
CLO ETI PAM ALE IBA RIS RAL HCT ALLO PEN SCOP PROM AM
L1 100 1000 1000 100 10t 1 10 1000 10 1000 neg 1000 1000
L2 1000 1000 1000 100 neg 100 100 neg 0.1 1000 neg 1000 1000
L3 1000 1000 1000 1000 neg 1000 1000 100 1000 1000 neg 1000 1
L4 neg neg neg neg neg neg neg 0.01 f
neg 100 0.01 f
0.01 f
0.01f
L5 neg 100 100 1000 neg 100 1000 1000 500 neg neg dnt dnt
L6 100 1000 1000 1000 neg 1 1000 100 500 1000 neg dnt dnt
IEX
Library L1 L3s L1 L1 L1t L5 L3d L1 L5 L1
LMC 0.01 0.01 0.01 0.01 0.01 0.001 0.01 1 0.001 0.01 dnt dnt dnt
Peaks 674 644 639 647 1010 1034 1593 678 721 1110 999 1025 1578
dnt = did not try, f = flow method, t = TMOS only, S = SPE, d = +PDMS; Note: OxP (ALLO metabolite) LMC
0.01 mg/L on L5; PAM, IBA, ALE LMC 0.01 mg/L on both IEX and SPE with L1 (L1t for IBA)
N
O
A A
N NH2
OH
B N
O B
N NH2
Fig. T1.2. A) NRS and B) SERS of Creatinine on L1. Fig.T1.3. A) NRS and B) SERS of 3-Methylhistidine on L1
Note: 1-methyl histidine was measured in Phase 1, see Fig T5.2)
.
OH A
O
H2N A
HO O
NH
HO OH
NH2
B
B
Fig. T1.4. A) NRS and B) SERS of Hydroxy-proline, 0.01 Fig. T1.5. A) NRS and B) SERS of Hydroxy-lysine on L1t
mg/L on gold L4. (with HCl wash, and 2nd reduction step.
15
15. "fi, sf" RTA P2004#65 NASA Topic No B3.05 CN: NNC05CA09C Phase II Final Report June 2, 2007
A
NH2
HO
NH2
O
O
NH2
HO
OH
HO
OH
O
B
Fig. T1.6. SERS of H-Pyridinoline in 0.2M acetic acid A) 1.8 Fig. T1.7. SERS of H-deoxyPyridinoline 1.8 mg/L on L5
mg/L on L3; and B) L3 (chem2c, reported in Phase I) with (conditions same as in Fig. T1.6).
acetic acid (SERS) subtracted.
-
O
O
P O
Ca+2
-
O
O- Ca+2 O- A O
A
- O-
O P O-
Ca+2 O-
O Ca+2
B B
Fig. T1.8. A) NRS and B) SERS of Calcium phosphate on Fig. T1.9. A) NRS and B) SERS of Calcium oxalate on L2.
L2.
O NH2 A
A S
O
HO S
HO
NH2
OH
H
N
N
B
O B
N
HO N H
Fig. T1.10. A) NRS and B) SERS of Uric acid on L1. Fig. T1.11. A) NRS and B) SERS of L-Cystine on L1.
16
16. "fi, sf" RTA P2004#65 NASA Topic No B3.05 CN: NNC05CA09C Phase II Final Report June 2, 2007
The NRS and SERS are shown for the 13 drugs in Figures T1.12-T1.24. This includes the anti-bone loss drugs
CLO, ETI, PAM, ALE, IBA and RIS), a selective estrogen receptor modulator, RAL, the anti-stone formation drugs
HCT, PEN and ALLO, the anti-motion sickness drugs SCOP and PROM, and the anti-inflammation drug AM.
O Cl
HO
P
A A
Cl
HO
P OH
HO
O
O CH3
B HO P OH
B
HO
P OH
HO
O
Fig. T1.12. A) NRS and B) SERS of Clodronate disodium on Fig. T1.13. A) NRS and B) SERS of Etidronate disodium on
L1. L1.
NH2
O
HO
NH2
A O
A
P OH HO
P OH
HO
OH HO
P OH
HO P
HO
O
O
B B
Fig. T1.14. A) NRS and B) SERS of Pamidronate disodium on Fig. T1.15. A) NRS and B) SERS of Alendronate sodium on
L1. L1.
O
HO
P OH
N
CH3
CH3 A O
N
A
HO P OH
HO
P OH
HO
HO OH
P
HO
O
O
B B
Fig. T1.16. A) NRS and B) SERS of Ibandronate sodium on Fig. 16 T1.17. A) NRS and B) SERS of Risedronate sodium
L1t. on L1.
17
17. "fi, sf" RTA P2004#65 NASA Topic No B3.05 CN: NNC05CA09C Phase II Final Report June 2, 2007
O
N
O A
HO A
S
OH
B
B H2N
O
O O
S S
NH
O
Cl
N
H C
Fig. T1.18. A) NRS and B) SERS of Raloxifene in MeOH on Fig. T1.19. A) NRS and SERS of Hydrochlorothiazide on B)
L2. L3, and C) 0.01 mg/L on gold L4.
OH
A
N A
N
N
N H
NH2
B
B HS
O
H3C
HO
H3C
C
Fig. T1.20. A) NRS and B) SERS of Allopurinol on L2. Fig. T1.21. A) NRS and SERS of Penicillamine on B) L2,
and C) 0.01 mg/L on gold L4.
H3C
N
CH3
A A
CH3 H
O
N
O N O OH
S
B H
B
C C
Fig. T1.22. A) NRS and SERS of Promethazine HCl on B) Fig. T1.23. A) NRS and SERS of Scopolamine HCl on B)
L2, and C) 0.01 mg/L on gold L4. gold L4 (chem3a, from Phase I) and C) 0.01 mg/L on gold
L4.
18
18. "fi, sf" RTA P2004#65 NASA Topic No B3.05 CN: NNC05CA09C Phase II Final Report June 2, 2007
A
A
O
B O O O NH
O
HN OH
O O O
O
B
C
Fig. T1.24. Acetaminophen, A) NRS and SERS B) 0.1 Fig. T1.25. A) NR and B) SERS of AM-G; 0.1 mg/mL on
mg/mL on L2, and C) L4 (gold). L2.
Although the majority of primary target drugs in this study, such as the bis-phosphonate bone-loss drugs, are
generally excreted unchanged in urine, other drugs metabolize, such as acetaminophen and allopurinol. The SERS
(and NRS) of the metabolites of these two drugs, acetaminophen-glucuronide (AM-G) and oxipurinol (OxP), were
also measured (metabolites from other drugs were not readily available). As shown in Figures T1.25 and T1.25,
acetaminophen and its metabolite produce different SER spectra. ALLO is a xanthine oxidase inhibitor that lowers
the level of uric acid in urine. Approximately 90% of ALLO is metabolized to OxP. ALLO is rapidly excreted in
urine (T1/2 = 40 min), while OxP is excreted over a much longer period (T1/2 =14-30 hrs). The NRS and SERS for
OxP are shown in Figure T1.26 (compare to ALLO Fig T1.20).
OH
A OH
N N
B N N
N N
N H HO N H
C Allopurinol Oxypurinol
Fig. T1.26. A) NRS and B) SERS of Allopurinol; C) NRS and
D D) SERS of Oxypurinol; 0.5 mg/mL on L5.
In addition to these 25 measured analytes, 25 additional chemicals that may be present in astronaut urine and could
be potential interferents were measured (Table T1.5). This included five additional drugs, the pain reliever -
acetylsalicylic acid (ASA, aspirin), representative sleeping aids – barbitol and phenobarbitol, and stimulants caffeine
and Adderall (Figures T1.27-T1.30). The latter drug is a single entity amphetamine product combining the neutral
sulfate salts of dextroamphetamine and amphetamine, with the dextro isomer of amphetamine saccharate and d,l-
amphetamine aspartate monohydrate.
Table T1.5. List of drugs, vitamins, and natural products of metabolism as interferents that may appear in urine.
Drugs Vitamins/Supplements Natural metabolites
Acetylsalicylic acid (ASA) Vitamin A Lactic acid Glucose
Barbital Vitamin E Hippuric acid Gluconic acid
Phenobarbital Thiamine Nicotinic acid Cholesterol
Caffeine Pyridoxamine Glutamic acid Estradiol
Allderall Citric Acid Histidine Pregnane-diol
1-methylhistidine Theophyllene
Cystine/cysteine Xanthene/Hypoxanthene
19