Call Girls Navi Mumbai Just Call 9907093804 Top Class Call Girl Service Avail...
Sg Worst Case Debt Scenario
1. Special report
Global
Fourth quarter 2009
EQUITY
CREDIT
VIEW
OBAL
A GL EUROPE
FROM
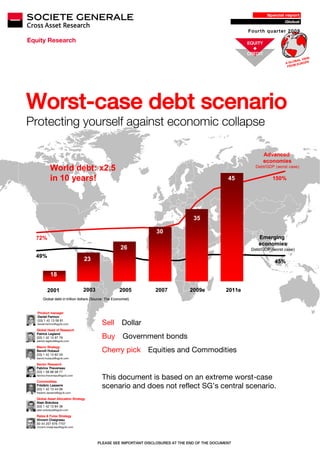
Worst-case debt scenario
Protecting yourself against economic collapse
Advanced
economies
World debt: x2.5 Debt/GDP (worst case)
in 10 years! 45 150%
35
30
72% Emerging
economies
26 Debt/GDP (worst case)
49%
23 45%
18
2001 2003 2005 2007 2009e 2011e
Global debt in trillion dollars (Source: The Economist)
Product manager
Daniel Fermon
(33) 1 42 13 58 81
daniel.fermon@sgcib.com Sell Dollar
Global Head of Research
Patrick Legland
(33) 1 42 13 97 79
patrick.legland@sgcib.com
Buy Government bonds
Macro Strategy
Benoît Hubaud
(33) 1 42 13 62 04
Cherry pick Equities and Commodities
benoit.hubaud@sgcib.com
Sector Research
Fabrice Theveneau
(33) 1 58 98 08 77
fabrice.theveneau@sgcib.com
Commodities
This document is based on an extreme worst-case
Frédéric Lasserre
(33) 1 42 13 44 06
scenario and does not reflect SG’s central scenario.
frederic.lasserre@sgcib.com
Global Asset Allocation Strategy
Alain Bokobza
(33) 1 42 13 84 38
alain.bokobza@sgcib.com
Rates & Forex Strategy
Vincent Chaigneau
00 44 207 676 7707
vincent.chaigneau@sgcib.com
PLEASE SEE IMPORTANT DISCLOSURES AT THE END OF THE DOCUMENT
3. Worst Case Debt Scenario
Contents
4 The worst case debt scenario
4 Hope for the best, be prepared for the worst
5 How to position for our bear scenario
6 Analogies with Japan’s lost decade & investment ideas
6 Debt explosion in 2009
7 The current economic crisis displays compelling similarities with Japan in the 1990s
9 End of market rally for equities? Look at Japan!
9 Worried about inflation? Japan suggests deflation more of a risk
10 Stress-testing performance by asset class under a bear scenario
12 How to invest under a bear scenario
13 Focusing on roots to forecast consequences
13 Flashback to the origins of the economic crisis
14 Governments bailing out the financial system, but at what price
15 Counting on a comeback for the US consumer
17 Counting on governments to survive debt mountains!
19 The painful task of removing the excess debt
20 Governments: choose the route to debt reduction
22 Indebted developed economies can’t compete with debt “free” emerging markets
26 Three economic scenarios, one constraint: debt!
30 Bear scenario Lengthy deleveraging, and slow recovery over five years
32 Fixed Income & Credit under a Bear scenario
33 Investment Grade Credit under a Bear scenario
34 High Yield Credit under a Bear scenario
35 Equity Strategy under a Bear scenario
37 Oil & Gas under a Bear scenario
38 Metals & Mining under a Bear scenario
39 Agricultural commodities under a Bear scenario
41 Appendix: Bottom-up approach: central and bull scenarios
42 Central scenario Back to potential economic growth in three years
43 Currencies - Protracted dollar weakness
45 Fixed Income & Credit under a Central scenario
46 Investment Grade Credit under a Central scenario
47 High Yield Credit under a Central scenario
48 Equity Strategy under a Central scenario
50 Equity volatility under a Central scenario
51 Oil & Gas under a Central scenario
52 Metals & Mining under a Central scenario
53 Agricultural commodities under a Central scenario
55 Bull scenario Strong boom one year out
56 Fixed Income & Credit under a Bull Scenario
57 Investment Grade Credit under a Bull scenario
58 High Yield Credit under a Bull scenario
59 Equity Strategy under a Bull scenario
61 Oil & Gas under a Bull scenario
62 Metals & Mining under a Bull scenario
63 Agricultural commodities under a Bull scenario
Report completed on 13 October 2009
Thanks to Benjamin Sigel and Nicolas Greilsamer for their assistance in preparing this report
Fourth quarter 2009 3
4. Worst Case Debt Scenario
The worst case debt scenario
Hope for the best, be prepared for the worst
SG’s central scenario is for a slow Much has been written about the credit crisis, the government stimulus response, the
global recovery…
mountains of debt and the possible resulting emergence of a new world order, but as yet no-
one can say with any certainty whether we have in fact yet escaped the prospect of a global
economic collapse. Perhaps ‘global economic collapse’ is too strong a term. There are
degrees of collapse, from severe interruptions in the pace of progress to a scenario more like
a global economic meltdown, with unthinkable consequences. Happily we are more sanguine.
But while we believe the greatest danger is past, we also recognise that the price of our
salvation has yet to be paid in full.
Our central economic scenario assumes a slow recovery for the global economy, but with
government debt at all-time highs, in this report we spend some time taking a hard look at the
downside risks. Using debt as the key variable we also draw up two alternative economic
scenarios (bull and bear) and consider the implications for strategic asset recommendations.
In particular we focus on strategies for those who believe we may be set for a Japanese-style
(non) recovery.
…but we think it wise to consider A Japanese-style recovery implies persistent government debt, economic anaemia, low interest
the risks of a Japanese-style (non)
rates and weak equity markets. We would not qualify expanding government debt as a bubble.
recovery as well
But we do believe it represents a threat to future economic growth, constraining governments’
freedom to spend and potentially requiring tax increases, which could in turn hold back
consumption. The inevitable – and lengthy – period of deleveraging which lies ahead could lead
to weak or even negative GDP growth, substantially affecting asset class performance. This is
the thesis underpinning the bear scenario on debt discussed in this report.
Under this bear scenario (worst case), we combine a quantitative and qualitative screening
approach, crossing top-down fundamental analysis with the results given by our econometric
model, to draw up a series of recommendations, as summarised in the table below.
Key recommendations under a bear (worst case) debt scenario
Asset class Bear debt Bear scenario comments
scenario
(12 m)
Currencies Dollar - Future dollar worries stemming from US debt funding imbalance
Fixed income Government bonds (10Y) + 10 YR bonds should perform well as long-term rates decline
Investment Grade (5-7Y) = Lower government yields should offset wider credit spreads
High Yield (3-5Y) - Stay away from high-yield cyclicals as high risk aversion will heavily penalise these bonds
Equities Indices - Risk of a double bottom for equity markets as observed during past crisis
Penalised by the weakness of the economy but benefiting from US corporates’ global
US -
positioning
Europe - Very fragile recovery. European companies penalised by a strong euro
Emerging markets = Difficult trade conditions should subdue any increase in domestic consumption
Commodities
Oil - Short-term demand to fall, bringing Brent down to $50 per barrel
Mining = Mainly dependent on Chinese growth, with discrepancies between mining stocks
Agricultural + Good trend in some agricultural products given lack of supply. Looks defensive
Source: SG Research
4 Fourth quarter 2009
5. Worst Case Debt Scenario
How to position for our bear scenario
Sell the dollar as a declining dollar could provide a means to reduce global imbalances.
Positive on fixed income as rates would fall in a Japanese-style recovery. Prefer defensive
corporates (telecom, utilities) which have the lowest risk of transitioning into high-yield and
should perform well in a more risk averse environment.
Sell European equities as markets have already priced an economic recovery in 2010e.
Under a bear scenario, this optimism could be dashed once restocking is over and fiscal
stimulus (especially for the auto sector) has dried up.
Cherry pick commodities given the diverse nature of this asset class. Agricultural
commodities would probably fare best, but are difficult to forecast given high exposure to
weather conditions. Mining commodities (particularly gold) are also a hedge against a
softening dollar and could be favoured by persistently strong demand from emerging markets,
particularly China.
3 scenarios, 1 constraint…
Worst case Bull economic scenario
Bear economic scenario
Rapid rise in public Reducing deficit but
deficit still high
No GDP growth High GDP growth
Deflation
Central scenario High inflation
Low interest rates (SG MAP*) Higher interest rates
Public deficit rises
Limited GDP growth
Limited inflation, no deflation
Slow increase in interest rates
Overweight
Commodities
Equities
Underweight
Government bonds
Yen
10-Year Government Bonds Oil, Mining
Gold, Agricultural Emerging equities
commodities High-Yield
Equities
High Yield Dollar Government bonds
Source: SG Cross Asset Research, SG Global Asset Allocation * SG MAP = SG Multi Asset Portfolio
Fourth quarter 2009 5
6. Worst Case Debt Scenario
Analogies with Japan’s lost decade &
investment ideas
Debt explosion in 2009
With US government debt approaching 100% of GDP by 2010e, signs of a constrained
recovery are becoming apparent as the $787bn stimulus package takes effect. Government
receipts are falling, while expenditure is at an all-time high
US debt explosion (US$bn)
Debt is a key issue for the US:
with population ageing burdening Even the estimates provided by the US
a smaller workforce, government Congressional Budget Office predict further
spending is set to increase
increases in public expenditure out to 2011
considerably
source: Congressional Budget Office, SG Cross Asset Research
Further transfer of debt from the private sector to the state and rising healthcare costs,
particularly for ageing baby boomers, are among the factors behind soaring US public debt.
These poor demographics and the complexity of the current crisis serve as reminders that we
may not have escaped the prospects of a ‘lost decade’, implying years of sub-par economic
growth ahead. The US is not the only country facing such a gloomy outlook for public
finances. In Europe also, public debt to GDP should exceed 100% within a few years.
Public debt as % of GDP
250% 140%
120%
Italy
200%
100%
Japan Public
Debt Germany
150% 80%
60% UK
100%
40%
US Public Debt
50% 20% France
Debt has increased dramatically- 0%
0% how long will this continue
1981 1985 1989 1993 1997 2001 2005 2009
1990 1994 1998 2002 2006 2010 2014
UK Italy Germany France
Japan Public Debt US Public Debt
Source: SG Cross Asset Research, FMI
6 Fourth quarter 2009
7. Worst Case Debt Scenario
The problem facing governments is that if they cut off the fiscal stimulus too soon, we could
fall back into recession, but if the gap is not closed rapidly, there would be a risk of high
inflation and high interest rates by 2011. Taking an extreme view, US debt could result in a
collapse in the dollar as large US debt holders reduce their exposure and inflation rises as a
result. We do not see this as a likely scenario over the next 12 months as debt is currently an
issue in practically all developed countries, so no other currency could realistically replace the
dollar at the moment.
The current economic crisis displays compelling similarities
with Japan in the 1990s
A return to recession would bring echoes of Japan’s ‘lost decade’. As highlighted in the
following chart, there are striking similarities between that period and the decade starting with
the dotcom crisis in 2000/2001 and ending with the current crisis seen in the US from 2007.
Counting the similarities
Taking a different perspective, we
can see that the current crisis has
its roots in the dotcom crisis at
the beginning of this decade.
Combining these two crises, as
shown in the chart on our right,
brings back memories of Japan…
Source: SG Cross Asset Research
In the following chart we shift forward Japan’s rate hikes and debt deployment trends by
10 years to compare these with the US experience, underlining the huge risks ahead if the US
continues to make full use of unconventional measures to support the economy.
Fourth quarter 2009 7
8. Worst Case Debt Scenario
Shifting forward Japan’s interest rates and debt by 10 years suggests a similar story
7 7
4
Rate hike discrepancy
6 6 2 JP FISCAL DEFICIT
Japan BOJ rate 0
5 5 1 2 3 4 5 6 7 8 9 10 11 12 13 14 15 16 17 18 19 20
-2
4 4
-4
US Fed Reserve rate
-6 US FISCAL
3 3
DEFICIT
-8
2 2
-10
1 1
-12
0 0 Japan Fiscal Deficit %GDP (Starting in 1990)
1 713 25 37 49 61 73 85 97 03115127139151163175187199211223235
19 31 43 55 67 79 91 1 109121133145157169181193205217229 US Fiscal Deficit %GDP (Starting in 2000)
Japan BOJ (Starting in 1990) US Fed Reserve (Starting in 2000)
Source: SG Cross Asset Research
In a normal downturn, debt would naturally be reduced by higher receipts, stemming from a
return to normal GDP growth. Looking at Japan, we can see that when debt started to narrow
in 2006, GDP was slow to increase as consumption was impaired by lower government
spending. The boom at that time in western economies was the only factor which alleviated
some of the pressure on the Japanese economy.
In our bear scenario, much like Japan, debt is the main constraint on US GDP growth. And as
shown below, reducing the excessive debt burden is likely to stall economic activity under that
scenario. Thus, given the hefty public debt constraint, our pessimistic scenario would see a
repeat of Japan’s ‘lost decade’, this time with the US experiencing zero growth and fighting a
battle against deflation, with debt continuing to weigh on the economy.
Debt’s toll on GDP during Japan’s ‘lost decade’… And the US is heading in the same direction!
14% 20.0%
12%
Debt to GDP % yoy 15.0%
10%
Debt to GDP % yoy
8% 10.0%
6%
5.0%
4% GDP growth yoy%
GDP Growth % yoy
2% 0.0%
2000 2001 2002 2003 2004 2005 2006 2007 2008 2009 2010 2011
0%
-5.0%
2003
2005
2006
2007
2008
1990
1991
1992
1993
1994
1995
1996
1997
1998
1999
2000
2001
2002
2004
-2%
-10.0%
-4%
Debt and GDP during the ‘lost decade’ show a high negative correlation
-6% -15.0%
Japanese Debt to GDP % yoy Japanese GDP Growth % yoy US Debt to GDP yoy% GDP growth yoy%
Source: OECD, SG Cross Asset Research Source: SG Cross Asset Research, IMF International Statistics
8 Fourth quarter 2009
9. Worst Case Debt Scenario
End of market rally for equities? Look at Japan!
If we accept the idea of a two-stage crisis (taking as our starting points 2000/01 + 2007/08),
we have probably reached a situation similar to that of Japan in the 1990s. This analogy would
suggest that we are now exiting a bear market rally, which was fuelled by restocking and fiscal
stimulus. If the fiscal incentives boosting auto consumption are reduced, “normal” consumer
spending will be unable to pick up the running so long as unemployment remains depressed.
Comparing the S&P today to the Nikkei in Japan’s lost decade
7
Japanese Real Estate
6 and Valuation Crisis
5
Bear market rally
4
3
2 US Valuation
Crisis
1
Nikkei 225 (starting in 1980) S&P 500 (starting in 1990)
0
241
361
1
16
31
46
76
91
136
151
166
181
196
211
226
256
271
286
301
316
331
346
61
106
121
Duration (Months)
Source: Datastream, SG Cross Asset Research
Worried about inflation? Japan suggests deflation more of a risk
With unemployment peaking, it seems illusory to expect inflation in the coming 12 months and
hence a higher risk of increasing bond yields. The bond market suggests the real risk is one of
deflation, again calling to mind the Japanese scenario.
Comparing Japanese and US 10YR bond yields
9
8
Japan (1990-2009) US (2000-2009)
7 Bond yields on a continuing
downward trend …
6
5 Short lived recovery
4 from Japan’s ‘lost
decade’ …maybe in 3
3 years time in the US
2
1
0
1 368 735 1102 1469 1836 2203 2570 2937 3304 3671 4038 4405 4772
Source: Datastream, SG Cross Asset Research
Fourth quarter 2009 9
10. Worst Case Debt Scenario
Stress-testing performance by asset class under a bear scenario
We have developed a quantitative approach to assess the return for different asset classes on
the assumption of zero US GDP growth for the next two years due to high debt. Our model
provides clear guidelines for investment under the bear scenario, with fixed income naturally
benefiting, followed by some commodities, whereas equity markets and the dollar suffer.
Estimated correlation with US GDP by asset class
EUROPE Oil
S&P 500 7.4
Emerging
JAPAN DOW JONES 6.4
FTSE 100 5.4
Gold, government bonds and the
Linear correlation
Metals
yen are the best placed assets in 4.4
the bear scenario
3.4
2.4
Global HIGH YIELD
Agro
1.4
USD/JPY 0.4
-0.2 -0.1 -0.1 0.0 0.0 0.1
-0.6
US Investment Grade
-1.6
10Y US Gold
Estimated average return for 0% US GDP growth
Source: SG Cross Asset Research, Datastream, MSCI Inc.
With equities proving highly correlated to US GDP, the indices expected to suffer most under
our zero GDP growth model are those with the greatest GDP correlation. The emerging market
indices (the Indian Sensex and Asia’s Hang Seng and Shenzen) have historically outperformed
US GDP. This suggests that the emerging market indices have a high linear correlation to US
GDP. Surprisingly, it is the Dow Jones and the FTSE that are the Western indices least
sensitive to US GDP. However, despite their previous high correlation, we find the emerging
markets have recently decoupled from the US and going forward we expect this to continue.
Estimated correlation with US GDP among equity indices
CAC 40 DAX 30
8.9
DJ STOXX 600 8.4
7.9
Linear correlation
Emerging
7.4
HANG SENG
6.9
WORLD
S&P 500
6.4
DOW JONES 5.9
NIKKEI
5.4
FTSE 100
4.9
-18.5 -13.5 CHINA -8.5 -3.5 1.5
Estimated average return for 0% US GDP growth
Source: SG Cross Asset Research, Datastream, MSCI Inc.
10 Fourth quarter 2009
11. Worst Case Debt Scenario
Seeking refuge in the largest government bond issues has historically proved beneficial during
periods of market stress. Investment grade bonds would also be expected to perform well
under the scenario, although there is a slight risk of some bonds transitioning to lower class
ratings. High yield bonds, however, would be hard hit under our model, with default rates
peaking.
Estimated correlation with US GDP within fixed income & credit
R 2 = 0.6029 JP 5 Y BD 10 Y JP 10 Y
BD 2 Y JP 7 Y
0.0 2.0 3.0 4.0 5.0
-0.3 1.0
BD 5 Y
JP 2 Y BD 7 Y
-0.5
Linear correlation
UK 2 Y UK 5 Y UK 10 Y
-0.7
US 2 Y
UK 7 Y
-0.9
-1.1
-1.3 US 5 Y US 7 Y
-1.5 US 10 Y
Estimated average return for 0% US GDP growth
Source: SG Cross Asset Research, Datastream
Commodities are less sensitive to GDP. Opportunities could still arise, with gold and
agricultural commodities likely to prove resilient if attractively priced.
Estimated correlation with US GDP within commodities
Nickel 8.0
6.0 Lead
LMEX
Copper
4.0 Oil-Brent
Aluminium
Linear correlation
Silver Gas Oil
2.0
CRB Wheat
0.0
-7.5 -3.5 0.5 4.5 8.5 12.5 16.5 20.5 24.5
-2.0 Raw Sugar
Soyabeans Gold
-4.0 Corn
Cocoa
-6.0
Estimated average return for 0% US GDP growth
Source: SG Cross Asset Research, Datastream, MSCI Inc
Fourth quarter 2009 11
12. Worst Case Debt Scenario
How to invest under a bear scenario
Having considered the similarities and differences between the current situation in the US and
Japan’s lost decade, we summarise below the investment implications of a bear scenario for
debt, showing 12-month recommendations by asset class and sub sector under market stress
conditions. This list was obtained using a quantitative and qualitative screening approach,
which combines top-down fundamental analysis crossed with the results given by our
econometric model. We also indicate the investment recommendations under SG’s central
scenario (SG Global Asset Allocation Research, Multi Asset Portfolio).
Key recommendations under a bear debt scenario and under SG’s central scenario
Asset class Bear debt SG MAP Comments under a bear scenario
scenario
(12m)
Currencies Dollar - N Future dollar worries stemming from US debt funding imbalance
Fixed income Government bonds (10Y) + UW 10 YR bonds should perform well as long-term rates decline
Investment grade (5-7Y) = N Lower government yields should offset wider credit spreads
High yield (3-5Y) - NA Stay away from high-yield cyclicals as high risk aversion will heavily penalise these bonds
Equities Indices - OW Risk of a double bottom for equity markets as observed during past crisis
Penalised by the weakness of the economy but benefiting from US corporates’ global
US - N
positioning
Europe - N Very fragile recovery. European companies penalised by a strong euro
Emerging markets = UW Difficult trade conditions should subdue any increase in domestic consumption
Commodities OW
Oil - Short-term demand to fall, bringing Brent down to $50 per barrel
Mining = Mainly dependent on Chinese growth, with discrepancies between mining stocks
Agricultural + Good trend in some agricultural products given lack of supply. Looks defensive
Source: SG Cross Asset Research, SG Global Asset Allocation Research and MAP Multi Asset Portfolio (UW = Underweight, N + Neutral, OW = Overweight)
12 Fourth quarter 2009
13. Worst Case Debt Scenario
Focusing on roots to forecast consequences
If we truly are in a bear market rally, albeit a long one, with equities diverging from the
underlying factors, then understanding the fundamentals will help us avoid disappointing
outcomes when markets converge with economic reality.
Flashback to the origins of the economic crisis
The global recession which started in 2008 stemmed directly from US financials and
households being excessively leveraged on loss generating underlying property assets.
Demonstrating the severity of the global crisis, in April 2009 the IMF estimated the total cost of
the global crisis at slightly over 4 trillion dollars in nominal terms.
The depth of the economic crisis has been attributed to a number of factors:
The crisis spread from sub-prime Complex debt securitisation mixing toxic assets with healthy assets, with credit ratings
to prime households and from
which downplayed the risks of such products.
toxic to healthy assets
A massive increase in defaults by sub-prime households led to a global decrease in house
prices and therefore bank collateral, prompting a deterioration in bank balance sheets and a
necessary deleveraging by these institutions to contain the damage.
Forced deleveraging amplified drops in real estate and securitised asset prices, with a
confidence crisis leading to a liquidity crisis.
The crisis spread from sub-prime to prime households and from toxic to healthy assets.
The liquidity and confidence crises started to contaminate the rest of the US economy and
spread to other economies due to globalisation and the interconnectedness of financial
institutions in global markets.
A three-step crisis: markets, banks, real economy
Increase in default rates for sub- prime loans
prime loans
Increase in real - estate prices
Drop in default rates for sub
Drop in real estate prices
-
Accelerators
Accelerators Markets
Rating agencies Markets
Rating agencies Tension on structured products Tension on onSIVs
Tensions SIVs Tension on monetary funds
Tension on structured products (Structured investment vehicles)
(Structured investment vehicles)
Valuation Valuation Liquidity
Liquidity
Monolines
Monolines Banks
Depreciation Income statement channel Balance sheet channel: reintermediation
Balance sheet channel:
Depreciation of market value value Depreciations
Depreciation of market Income statement channel
Risk of derating
Risk of derating Value adjustment Return of off off
balance
Return of - balance Freezing of current
Value adjustment sheet assets
sheet assets equity syndication
equity syndication
PRESSUREPRESSURE ON BANKS CAPITAL
ON BANKS’ CAPITAL
Real Economy Pressure on Real estate
CreditCredit restrictions
restrictions
Negative wealth effect
Source: SG Cross Asset Research, Banque de France
Fourth quarter 2009 13
14. Worst Case Debt Scenario
Governments bailing out the financial system, but at what price
At the end of 2008, the ratio of total debt to GDP had risen to over 350% in the US and should
only stabilise in 2009. We have now reached a point where the developed economies,
particularly the US, appear to have no option but to deleverage.
Historical and projected breakdown of US debt by category
400%
Household Business Financials Government
350%
300%
250%
200%
150%
100%
50%
0%
1939
1944
1949
1954
1964
1969
1974
1979
1984
1989
1994
1999
2004
2009
2014
1959
1934
1929
Source: SG Global Strategy, Bloomberg , US Federal Reserve
Central bank and government intervention has shifted the debt burden from financial
institutions to governments in a drive to quell the financial crisis and revive an ailing global
economy, provoking an explosion in public debt. The resulting huge liquidity injections left the
markets with little alternative but to rally!
Rapid central bank and government intervention to revive the economy
The depth of the crisis stemmed A typical economic cycle shows that slowdowns come after a rise in interest rates. An
from a bubble created by an
“appropriate” decrease in interest rates brings mechanical support for consumption and future
extended period of low interest
rates, and followed by an corporate investments and economic development. In the current crisis, central banks have
unprecedented increase in cooperated to implement a broad range of measures to stimulate the global economy and
interest rates!
avoid a collapse in the financial system.
Unprecedented decrease in interest rates by the main central banks
12 12
US UK Europe Japan China
10 10
8 8
6 6
4 4
2 2
0 0
May-94 Feb-97 Oct-99 Jul-02 Apr-05 Jan-08
Source: SG Economic Research, SG Cross Asset and Hedge Fund Research, DataStream
14 Fourth quarter 2009
15. Worst Case Debt Scenario
In theory, the unorthodox monetary policy unveiled during the crisis is not without risk, as
quantitative easing should be inflationary – except that for the moment the printing of money
by western economies has been used only to replace the credit destroyed. The continued fall
in corporate borrowing reflects a net repayment of debt, as demand continues to be very
weak.
With bank lending still in decline, It has now been a year since the implementation of quantitative easing. Going forward, we see
QE and stimulus are essential to
central banks gradually cutting back on these measures, although it is still too early to
sustain a recovery, but at a
considerable cost… eliminate quantitative easing entirely.
Along with the sharp cut in interest rates, governments launched stimulus packages to replace
forgone private expenditure. This global stimulus package was vital to revive an ailing
economy and compensate for a decrease in corporate and household spending, acting as an
automatic stabiliser.
Stimulus plan
Country US$bn As % of national GDP
US 787 6
China 586 15
Europe 298 2
Japan 154 3
Latin America 149 4
Emerging Asia 52 2
CEE 23 2
Russia 20 1
Total 3% of global GDP
Source: SG Cross Asset Research, FactSet
Total stimulus, which represents 3% of global GDP, is set to generate excessive public debt
levels, implying a need for deleveraging for years to come (see SG Economic Research report
4
dated 21 September 2009).
Counting on a comeback for the US consumer
While the transfer of debt from financials and households to governments did not solve all our
economic woes, it probably saved the economic system, rescuing the financial system from
the possible domino effect of one bank’s bankruptcy leading to another.
Consumers hesitating between saving and spending
The household deleveraging needed after years of excessive consumption is seeing previously
overvalued properties find their equilibrium as spending and borrowing move towards
normalised levels. Finding a new equilibrium for output is also necessary, as we believe that
production could further cut excesses as we seek a new balance for supply and demand.
Reducing the output gap, therefore, is not necessarily a good sign or an objective, as previous
output was largely the product of a consumption bubble.
Total US consumer debt now stands at about 130% of disposable income (105% of GDP).
Paying down debt will be a Prior to the 20-some year long credit boom, it averaged 60%-70%. In order to get back to
lengthy process, accentuated by
those levels – assuming they reflect some sort of equilibrium – consumers would have to pay
an unemployment rate set to
surpass 10% in 2010 down an amount of debt equal to 65% of disposable income. To achieve that in just two years
would require a jump in the savings rate above 30%. That is close to impossible. What if the
savings rate stabilises at 7%, which is near current levels? Assuming that all the savings are
Fourth quarter 2009 15
16. Worst Case Debt Scenario
used to pay down debt, and that nominal income remains stagnant, it would take over nine
years to reduce debt/income ratios to the levels seen in the 1980s.
Household debt to GDP
120% Target savings rate
100% Household savings to disposable Income
Household debt to GDP All time peak in 2007
80%
“Normal” savings rate level
60%
40%
20%
0%
1941
1944
1947
1959
1962
1965
1968
1971
1974
1977
1980
1983
1986
1989
1992
1995
1998
2001
2004
2007
2010
1950
1953
1956
1929
1932
1935
1938
-20%
Source: SG Economic Research, Bureau of Economic Analysis
In the US, although higher than a year ago, the saving rate is well below 10% – the average
observed in developed countries – with Japan and Italy peaking at 15% of disposable income.
Although low interest rates should normally increase the demand for credit, this has not been
the case up to now and demand for credit is unlikely to rise as long as unemployment remains
With credit reducing and low
so high (currently 9.7% in the US, expected to rise above 10% by next year). Household debt
interest rates forcing consumers
to deleverage, we believe gives less cause for concern once property markets stabilise, as the collateral put up against
stabilisation has started to occur house values stops eroding in value. Stabilising prices is the first step needed before we see a
as consumers pay down their
reduction in foreclosures, as homeowners tend to become more delinquent as house prices
debt.
fall. We therefore do not see household debt as a problem as long as rates remain low and
real estate valuations stop falling.
If US consumers increase the savings rate to 8%, the average observed in the past 50 years,
this would severely impact consumption and hence the global economy.
US personal savings rate could rise to 8% to reach an equilibrium level
Equilibrium US personal savings rate
16
14
12
10
8
6
4
2
0
57 61 65 69 73 78 82 86 90 94 98 02 06 10
Source: SG Cross Asset Research, Datastream
16 Fourth quarter 2009
17. Worst Case Debt Scenario
Better news for the US property market
Confirmation of a bottoming in the US housing market could support a further improvement in
consumer confidence and could, in the medium term, help to relax lending policies which
have damaged liquidity in the real estate sector throughout the recession.
US home price indices
Source: SG Economic Research, Global Insight
Supply is still increasing, eliminating the boost from new home sales. We can also expect that
once there is a rise in home prices, homeowners who have held off selling their homes at
depressed prices could flood the market with further supply, pushing prices down.
The US government’s tax incentives for first time homebuyers have helped boost lower-priced
property sales. The non-refundable tax credit worth $8,000 is set to expire in November 2009,
though prolonging it and making it more widely available could stimulate recovery in a market
with tainted fundamentals linked to excess debt.
Counting on governments to survive debt mountains!
Mechanically, the fiscal stimulus
As we can see in the chart below, apart from during World War II, when debt shot up in
measures and depressed countries such as the UK to 250% of GDP, the developed world has never before experienced
economic environment take deficits such high public debt. These unprecedented levels of government debt also coincide with
to unprecedented levels
high liabilities linked to demographic transition due to population ageing. The consequence is
that government spending in developed economies cannot last forever and high public debt
looks entirely unsustainable in the long run.
Fourth quarter 2009 17
18. Worst Case Debt Scenario
Public debt/GDP - 1900/2015e
300% 300%
US
UK
Japan
250% 250%
200% 200%
150% 150%
100% 100%
50% 50%
0% 0%
1900 1905 1910 1915 1920 1925 1930 1935 1940 1945 1950 1955 1960 1965 1970 1975 1980 1985 1990 1995 2000 2005 2010e 2015e
Source: SG Cross Asset Research, IMF
Contrary to developed countries where stimulus plans only brought a halt to the economic
meltdown, emerging markets’ stimulus plans, specifically China’s, are working very well. Debt
is not a problem for emerging markets as debt/GDP is below 50% in most countries (apart
from India where it stands at 80%). The most visible success of these plans has been in China
which returned to an 8% growth estimate for 2009, and is driving the recovery in commodity
prices. But, emerging market economies may no longer be prepared to finance the western
world’s exponential debt, particularly that of the US, as borne out by recent declarations from
Chinese officials.
Developed countries’ governments We have almost reached a point of no return for federal debt, where a beginning to the end of
face unprecedented public debt
the crisis now looks crucial to give governments a chance to cut back their debt load.
levels and this will determine their
future fiscal policies. Depending on the scenario used, we could expect public debt to GDP to reach historical
records in most western countries, well above the 60% Maastricht rule (see chart below).
Historical and projected breakdown of debt
180 180
160 US 160
140 EU 12 140
UK
120 Maastricht (60% GDP) 120
100 Japan 100
80 80
60 60
40 40
20 20
Mar-71 Apr-75 May-79 Jul-83 Aug-87 Sep-91 Oct-95 Dec-99 Jan-04 Feb-08 Apr
Apr-12e
Source: SG Cross Asset Research, Datastream
18 Fourth quarter 2009
19. Worst Case Debt Scenario
In 2009, public debt has been ballooning out of proportion as EU member states reach the
90% public debt to GDP level. The issue with excessive public debt levels as we exit the
recession is the deterioration of sovereign risk, and its adverse affect on debt servicing, as
debt could spiral once concerns over sustainability are factored in. Debt targeting needs to be
a fundamental approach for governments as we come out of the recession, and should be in
line with monetary and fiscal policy. But cutting all public costs at once in an attempt to
reduce debt to an unattainable level of 60% could have serious implications, jeopardising
growth and the recovery. The exit plan being discussed now in the US has already highlighted
the priority of debt reduction.
Once the economy rebounds, however, the estimates of capital destroyed are likely to be
revised, as less risk averse investors rush back into undervalued assets. The capital injected
into the money supply and the assets added to the Fed’s balance sheet must be drained off
by the government in order to avoid inflation.
We conclude that while the deleveraging process appears to be under way for households
and financials – and corporates, specific cases apart, are relatively untouched – it is clearly the
governments who are at risk of not being able to continue their support for the economy. For
now the level of debt is not a major concern, so long as rates remain low and emerging
markets continue to buy developed countries’ debt. But the key question is: will emerging
markets continue to buy developed countries debt? This raises the question whether the
dollar is safe as a reserve currency.
The painful task of removing the excess debt
Even a bull scenario points to debt to GDP of around 90% for Europe and 85% for the US in
2011, as it would take 4-5 years to reduce debt adequately. However, in each of the three
economic scenarios, public debt is far above the 60% target set by the Maastricht treaty,
raising concerns on the effectiveness of EU legislation.
Public debt forecasts under three different scenarios
Source: SG Economic Research
In order to deal with the excessive levels of debt, governments will have to implement new
fiscal policies. However implementing these too early could aggravate the recovering
economy, and too late could lead to a sovereign debt crisis and affect growth prospects. So
timing is key.
Fourth quarter 2009 19
20. Worst Case Debt Scenario
Governments: choose the route to debt reduction
Past history shows a number of roads to debt reduction, including innovation and growth in
the 1945-50 post-war period, inflation in the 1970s and economic reform in the 1980s UK
setting. Low interest rates can help the process, easing the debt servicing burden. The higher
the debt burden, the more interest rates have to come down – but considering the current low
interest rates, debt servicing could not be eased much further!
Debt reduction options
Inflation Innovation & growth
Currency volatility could lead to devaluation and New technologies often lead investors out of a
consequently inflation. downturn, but there i a risk of overvaluation as
investors seeking inexistent profits create new
bubbles
US 1970s Yuan revaluation 2010/11e? Green investing, Technologies and SRI 2010e?
US, UK, Spain
Europe 1970s Property 2002-2007
Japan 1970s
Argentina 2002 US TMT 1998-2001
UK 1949 US 1950
2010e will see unsustainable debt levels and could lead
Reducing the level of state
to government defaults
employment
Canada 1996
California 2010e?
UK 1980
Russia 1998
Eastern Europe 2010e?
Default Economic reform
Source: SG Cross Asset Research
Innovation and growth is the golden ticket
Past history clearly suggests that innovating for growth could be the best way to get out of the
crisis. But it would need a new technology driver – perhaps as in the green revolution (see our
The main interest in future SRI team’s March 2009 reports on green development and new energies).
4
innovation is through green
technologies. This booming Energy efficiency should be the biggest beneficiary of the €3 trillion per year green market
industry is a prime source of which is expected to double in the next decade. Global energy needs are expected to grow
growth according to our SRI
experts.
50% by 2030. Energy efficiency allows us to use current capacity more efficiently with up to
€3 in cost savings for every €1 invested – with all of the technologies and processes available
today. And far from being over-exploited, we have yet to really begin reaping the “lowest
hanging fruit”.
20 Fourth quarter 2009