Economy of USA
•Télécharger en tant que DOCX, PDF•
1 j'aime•268 vues

Development of US economy under Rostow's, Lewis and Solow Model of economic development.

Recommandé
Contenu connexe
Tendances
Tendances (20)
En vedette
Similaire à Economy of USA
Similaire à Economy of USA (20)
Dernier
Dernier (20)
Economy of USA
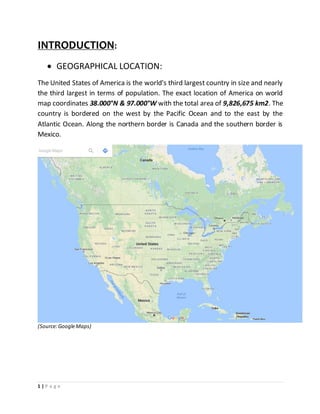
- 1. 1 | P a g e INTRODUCTION: GEOGRAPHICAL LOCATION: The United States of America is the world's third largest country in size and nearly the third largest in terms of population. The exact location of America on world map coordinates 38.000°N & 97.000°W with the total area of 9,826,675 km2. The country is bordered on the west by the Pacific Ocean and to the east by the Atlantic Ocean. Along the northern border is Canada and the southern border is Mexico. (Source:GoogleMaps)
- 2. 2 | P a g e There are 50 states in America. US have high mountains in the West and a vast central plain. The lowest point in the country is in Death Valley which is at -282 feet (-86 meters) and the highest peak is Denali (Mt. McKinley) at 20,320 feet (6,198 meters). Mostof the partof US came under temperatezone. HISTORICAL BACKGROUND: ORIGIN OF USA For centuries native peoples lived across the vast expanse that would become the United States. In the early 17th century, settlers moved from Europe to the New World, established colonies, and displaced the native peoples. By 1733, there were 13 colonies. In 1775, a war between the colonies and Britain called the Revolutionary War started. This war started because the American colonists were upset over changes in British policies. On July 4, 1776, people from the thirteen colonies created the United States Declaration of Independence. This said that they were free fromGreat Britain. ETHINCITY An increasing number of United States citizens identify simply as Americans. According to the United States Census Bureau, the number of people in the United States who reported American and no other ancestry increased from 12.4 million in 1990 to 20.2 million in 2000. This increase represents the largest numerical growth of any ethnic group in the United States. The United States Census officially recognizes six racial categories: White American, Black or African American, Native American and Alaska Native, Asian American & Native Hawaiian.
- 3. 3 | P a g e LANGUAGE and RELIGION: The most common language in the United States is known as American English. However, no official language exists at the federal level. There have been several proposals to make English the national language. Religious affiliation in the U.S. (2014 Affiliation % of U.S. population Christian 70.6 Protestant 46.5 Evangelical Protestant 25.4 Mainline Protestant 14.7 Black church 6.5 Catholic 20.8 Mormon 1.6 Jehovah's Witnesses 0.8 Eastern Orthodox 0.5 Above are the religious categories and their ratio in US.
- 4. 4 | P a g e POLITICAL STRUCTURE: The Government is of Liberal democracy, Presidential system, federal republic and constitutional republic of fifty states that constitute the United States, as well as one capital district, and several other territories. The federal government is composed of three distinct branches: legislative, executive, and judicial, whose powers arevested by the U.S. Constitution in the Congress. STATUS IN INTERNATIONALLEVEL: The United States is a highly developed country, with the world's largest economy by nominal GDP. It ranks highly in several measures of socioeconomic performance, including average wage, human development, per capita GDP, and productivity per person. US is member of following InternationalOrganizations: 1. South Asian Association for Regional Cooperation (SAARC) (observer). 2. United Nations (UN). 3. United Nations Conference on Trade and Development (UNCTAD). 4. United Nations Educational, Scientific, and Cultural Organization (UNESCO). 5. World Health Organization (WHO).
- 5. 5 | P a g e INCOME: GDP (nominal) 2016 estimate • Total $18.558 trillion (1st) • Per capita $57,220 (6th) Gini (2013) 40.8 HDI (2014) 0.915 (8th) Currency US Dollar ($) (USD) OVERVEIW OF ECONOMY: The United States has a capitalist mixed economy which is fueled by abundant natural resources and high productivity. The US is the largest importer of goods and second-largestexporter, though exports per capita are relatively low. 1)AGRICULTURESECTOR Agriculture is a major industry in the United States, which is a net exporter of food. As of the 2007 census of agriculture, there were 2.2 million farms, covering an area of 922 million acres (3,730,000 km2), an average of 418 acres (169 hectares) per farm. Although agricultural activity occurs in all states, it is particularly concentrated in the Great Plains, a vast expanse of flat, arable land in the center of the United States.
- 6. 6 | P a g e NATURE OF CROPS & LIVESTOCK: The National Agricultural Statistics Service maintains agricultural statistics for products that include peanuts, oats, rye, wheat, rice, cotton, corn, barley, hay, sunflowers, and oilseeds. In addition, the United States Department of Agriculture (USDA) provides livestock statistics regarding beef, poultry, pork, and dairy products. Agricultural Statistics shows that US agriculture is based on food crop rather than cash crop. The only other crops to ever appear in the top 20 in the last 40 years were, commonly: tobacco, barley, and oats, and, rarely: peanuts, almonds, and sunflower seeds. Alfalfa and hay. EMPLOYMENT IN AGRICULTURESECTOR: In 2012, there were 3.2 million farmers, ranchers and other agricultural managers and an estimated 757,900 agricultural workers were legally employed in US. Animal breeders accounted for 11,500 of those workers with the rest categorized as miscellaneous agricultural workers. The median pay was $9.12 per hour and $18,970 per year. CONTRIBUTION OF GDP: United States contributes 1.12% of GDP in Agriculture sector for about 4,407,256 USD ($). NO. Country Nominal GDP Agriculture – World 74,699,258 5.9%
- 7. 7 | P a g e NO. Country Nominal GDP Agriculture 1 United States 17,418,925 1.12% 2 China 10,380,380 9.1% 3 Japan 4,616,335 1.2% 4 Germany 3,859,547 0.8% 2)INDUSTRIALSECTOR The United States is the world's second largest manufacturer, with a 2010 industrial output of approximately $1,696.7 billion. The largest manufacturing industries in the United States by revenue include petroleum, steel, automobiles, aerospace, telecommunications, chemicals, electronics, food processing, consumer goods, lumber, and mining. MAIN INDUSTRY: A large portion of U.S. industrial output, the United States leads the world in airplane manufacturing. CONTRIBUTION IN GDP: According to World Bank National Account Data, the contribution of industrial sector in GDP is about 20% (2014).
- 8. 8 | P a g e (Source: World Bank national account) 3)CONTRIUTIONOF GDP IN SERVICE SECTOR: NO Country Nominal GDP Industrial Servic e – World 74,699,258 30.5% 63.6% 1 UnitedStates 17,418,925 19.1% 79.7% 2 China 10,380,380 42.6% 48.3% 3 Japan 4,616,335 27.5% 71.4% 4 Germany 3,859,547 28.1% 71.1% 5 United Kingdom 2,945,146 21% 78.3% (Source: Wikipedia) (2014)
- 9. 9 | P a g e HEALTH: US spend 17.1% of total GDP on health and constantly increaseis observed. EMPLOYMENT: Total nonfarm payroll employment rose by 161,000 in October 2016. Bureau of Labor Statistics reported, employment continued to trend up in health care, professionaland business services and financial activities. 4)EXPORT AND IMPORTOF US The United States is the 2nd largest export economy in the world. The top exports of the United States are Refined Petroleum ($103B), Cars ($60.8B), Planes, Helicopters, and/or Spacecraft ($53.2B), Vehicle Parts ($38.4B). The top export destinations of the United States are Canada ($241B), Mexico ($194B), China ($134B), Japan($67.5B) and Germany ($61.6B). The United States is the world’s largest importer in the world. Its top imports are Crude Petroleum ($230B), Cars ($155B), Computers ($92B), Refined Petroleum ($69.2B) and Vehicle Parts ($62.8B). The top import origins are China ($432B), Canada ($331B), Mexico ($291B), Japan($128B) and Germany ($121B). (Source: http://atlas.media.mit.edu/)
- 10. 10 | P a g e MAGNITUDEANDTRENDSOCIAL ECONOMIC INDIATOR GDP (GROSS DOMESTIC PRODUCT): There is constant increase in the economy of US. World Bank Data shows the GDP of 17.947 trillion US$ in 2015.
- 11. 11 | P a g e GROWTH RATE: World Bank Data shows thegrowth rate of 2.4% in 2015. PER CAPITA INCOME (PCI): Per capita income in US is about 55,836 US$. GDP PER CAPITA GROWTH: Growth rate of Per capita Incomein US is 1.6% in 2015. RATE OF INFLATION: Rate of inflation in US is 1% in 2015. UNEMPLOYMENT: Unemployment rate in US is 4.9% as per August2015. INVESTMENT TO GDP RATIO: The investment as percent of GDP in US was approximately 17% in 2012.
- 12. 12 | P a g e Above figure show approx. 14% of investment to GDP ratio in 2010 which rose to 17% in 2012. SAVING TO GDP RATIO: The saving to GDP ratio is 16.9% in 2015. TAX TO GDP RATIO: Tax to GDP ratio is about 9.8% in 2015 according to World Bank data. SOCIALINDICATOR POVERTY: In 2015, 13.5% (43.1 million) Americans lived in poverty. A 2013 UNICEF report ranked the U.S. as having the second highest relative child poverty rates in the developed world. In June 2016, the IMF warned the United States that its high poverty rate needs to be tackled urgently by raising the minimum wage and offering paid maternity leave to women to encourage them to enter the labor force.
- 13. 13 | P a g e HDI (HEALTH DEVELOPMENT INDEX) Rank Country HDI 2015 estimates for 2014 2015 estimates for 2014 8 United States 0.915 INEQUALITY: Gini coefficient, after taxes and transfers Country 1970 1980s Around 1990 mid- 90s around 2000 mid- 2000s Late 2000s United States 0.316 0.337 0.348 0.361 0.357 0.380 0.378 MULTI DIMENSION INDEX: Multidimensional poverty in the United States (U.S.), measuring and characterizing poverty using multiple dimensions of deprivation provides a more complete picture of poverty since the poor are not only those who lack income but also those who do not possess minimally acceptable standards in a number of dimensions of economics wellbeing. HEALTH EXPENDITURE: According to World Bank data 17.1% of total GDP spend on Health in 2014.
- 14. 14 | P a g e EDUCATION EXPENDITURE: According to UNDP, US spend 5.6% of total GDP on Education in 2012. LITERACY RATE: Literacy rate for the United States would be at most 65-85%. This government study showed that 21% to 23% of adult Americans were not "able to locate information in text". Further, this study showed that 41% to 44% of U.S. adults in the lowestlevel on the literacy scale. LIFE EXPECTENCY RATE: Life expectancy rate was 78.9% recorded in 2014. POPULATION GROWTH RATE: Population recorded in 2015 was 0.8%. MORTALITY RATE: Mortality rate per 1000 births was 6.7% in 2014.
- 15. 15 | P a g e APPLICATIONOF THEORIESANDMODELS: 1. ROSTOW’S STAGES OF ECONOMIC DEVELOPMENT: The above chart explain that in the period of 1843 – 1860 United States was going through take-off stage of Rostow’s stageof economic development. The above chart explains that US regularly growing economy drives to extend modern technology over the whole front of its economic activity. Some 10-20% of the national income is steadily invested, permitting output regularly to outstrip the increasein population. US successfully accomplish all 5 stages of Rostow’s stages of economic development and had been the world’s strongesteconomy.
- 16. 16 | P a g e 2. LEWIS THEORY: Between 1950 and 2000, during the so-called "second agricultural revolution of modern times", U.S. agricultural productivity rose fast, especially due to the development of new technologies. Lewis believes that unemployment and inequality is due to un-utilization of resources. The marginal productivity of labor is negligible, zero or negative. The countries have large population along with surplus of labor. By gainfully utilizing this surplus labor, the rate of capital formation can be accelerated for economic development. Hired workers comprise 33% of people employed on farms but do an estimated 60% of the work performed on US farms. It means 40% of the labor in agriculture sector (subsistent sector) is unproductive which can be shifted to industrial sector (capitalist sector). US being a developed country, the economy is strongest among all countries with a major support of high-tech large and heavy industries. We can say that Lewis theory could apply to US but not perfectly. This is because subsistence sector include unskilled labor which cannot be capable for high-tech heavy industries. Whereas, these unskilled surplus labor can create a new small-scale industry where they could perform work according to their capabilities such as, packaging, mining, construction etc. Surplus labor can also be a part of existing industries and help them to expand. If a quantity of workers moves from the subsistence to the capitalist sector equal to the quantity of surplus labor in the subsistence sector, productivity will improve. Total agricultural product will remain unchanged while total industrial product increases due to the addition of labor, but the additional labor also drives down marginal productivity and wages in the manufacturing sector. The theory proved that utilization of resources reduces the rate of unemployment.
- 17. 17 | P a g e 3. SOLOW GROWTH MODEL: The model explain that how population growth and technological progress affects the economy. When population growth rate increases, capital per worker decreases. The model predicts that economies with higher rates of population growth will have lower levels of capital per worker and lower levels of income. US population growth rate is 0.8 according to the record of 2015. It means US have low population growth rate, high capital per worker and high level of income. Ithelps economy to strengthen its roots. Technological progress is exogenous here (like population growth) because it is determined outside the model. In the steady-state of this model, A change in the savings rate, “s”, A change in the rate of population growth, “n”, or depreciation, “d” and a change in the exogenous rate of technological progress changes the diagram in a manner similar to a change in “n” or “d” and therefore changes the level of “k”, changes the growth rate of per capita income and capital in the steady-state. Thus, if there is increase in technology curve of US, the capital per worker will decrease. Under Solow model, economic expansion will not continue as “k” constantly decreases. This is due to diminishing return of depreciation “d”. Investment is also required to increase the amount of capital available to each worker in the system and thus increase the capital per worker. Overall, the economy will expand, and productivity per worker will increase.