3. History of Land Speed Records
Since the invention of the car, many people have broken the land speed record. In total
the record has been broken 59 times by 29 different people and 24 different cars:
A Table to Show Every Time the Land Speed Record has Been Broken
Year Location Car Diver Nationality
Speed
(M.P.H)
1898 Acheres Jeantaund Gaston de Chasseloup‐ Laubat France 39.240
1899 Acheres Jenatzy Camille Jenatzy Belgium 41.420
1899 Acheres Jeantaund Gaston de Chasseloup‐ Laubat France 43.690
1899 Acheres Jenatzy Camille Jenatzy Belgium 49.920
1899 Acheres Jeantaund Gaston de Chasseloup‐ Laubat France 57.600
1899 Acheres Jenatzy Camille Jenatzy Belgium 65.790
1902 Nice Serpollet Leon Serpollet France 75.060
1902 Ablis Mors William K.Vanderbilt USA 76.080
1902 Ablis Mors Henri Fournier France 76.600
1902 Ablis Mors Augieres France 77.130
1903 Ostend Gobron Brillie Arthur Duray USA 83.470
1903 Dourdan Gobron Brillie Arthur Duray USA 84.730
1904 Daytona Mercedes William K.Vanderbilt USA 92.300
1904 Nice Gobron Brillie Louis Rigolly France 94.780
1904 Ostend Mercedes Pierre de Caters Belgium 97.250
1904 Ostend Gobron Brillie Louis Rigolly France 103.550
1904 Ostend Darracq Paul Baras France 104.520
1905 Daytona Napier Arther E Macdonald France 104.650
1905 Arles‐Salon Darracq Victor Hemery France 109.650
1906 Daytona Stanley Fred Marriot USA 121.570
1909 Brooklands Benz Victor Hemery France 125.950
1910 Daytona Benz Barney Oldfield USA 131.275
1911 Daytona Benz Bob Burman USA 141.370
1914 Brooklands Benz L.G.Hornstead UK 144.100
1924 Arpajon Fiat Ernest Eldridge UK 146.010
1924 Pendine Sunbeam Malcolm Campbell UK 146.160
1925 Pendine Sunbeam Malcolm Campbell UK 150.760
1926 Southport Sunbeam Henry Segrave UK 152.330
1926 Pendine Babs J.G Parry Thomas UK 169.300
1926 Pendine Babs J.G Parry Thomas UK 171.020
1927 Pendine Bluebird Malcolm Campbell UK 174.883
4. 1927 Daytona Sunbeam Henry Segrave UK 203.792
1928 Daytona Bluebird Malcolm Campbell UK 206.956
1929 Daytona Golden Arrow Henry Segrave UK 231.446
1931 Daytona Bluebird Malcolm Campbell UK 246.090
1932 Daytona Bluebird Malcolm Campbell UK 253.970
1933 Daytona Bluebird Malcolm Campbell UK 272.460
1934 Daytona Bluebird Malcolm Campbell UK 276.820
1935 Bonneville Bluebird Malcolm Campbell UK 301.129
1937 Bonneville Thunderbolt Greg Eyston UK 312.000
1938 Bonneville Thunderbolt Greg Eyston UK 345.500
1938 Bonneville Railton Mobil Special John Cobb UK 350.200
1938 Bonneville Thunderbolt Greg Eyston UK 357.500
1939 Bonneville Railton Mobil Special John Cobb UK 369.700
1947 Bonneville Railton Mobil Special John Cobb UK 394.200
1963 Lake Eyre Bluebird Donald Campbell UK 403.100
1964 Bonneville Spirit of America Craig Breedlove USA 407.450
1964 Bonneville Wingfot Express Tom Green UK 413.200
1964 Bonneville Green Monster Art Arfons USA 434.020
1964 Bonneville Spirit of America Craig Breedlove USA 468.720
1964 Bonneville Spirit of America Craig Breedlove USA 526.280
1964 Bonneville Green Monster Art Arfons USA 536.710
1965 Bonneville Spirit of America Craig Breedlove USA 555.483
1965 Bonneville Green Monster Art Arfons USA 576.553
1965 Bonneville
Spirit of
America.Sonic 1 Craig Breedlove USA 600.601
1970 Bonneville The Blue Flame Gary Gabelich USA 622.407
1983 Black Rock Thrust 2 Richard Noble UK 633.468
1997 Black Rock Thrust SSC Andy Green UK 717.144
1997 Black Rock Thrust SSC Andy Green UK 763.035
5. 0.000
100.000
200.000
300.000
400.000
500.000
600.000
700.000
800.000
900.000
1898 1904 1927 1963 1997
Speed
(M.P.H)
Year
A Graph to Show the Speeds at Which
the Land Speed Record has Been Held
I have also created a graph to show how many times the record has been broken by
drivers from different countries. The UK currently leads with 27 times compared to 16
by the USA. Pendine sands in Camarthenshire has been used multiple times for breaking
land speed records due to the beach being very straight and long. When Thrust SSC was
being designed, tests were carried out at Pendine were they placed a model of the car
and put it on a rocket sledge to test the aerodynamic properties of the car.
I have also created a graph to show the progression of the record since the first one was
set in 1898.
0
5
10
15
20
25
30
UK USA France Belgium
Times Record Broken
Countries
A Graph to Show the Number of Times
Each Country Has Broken the Land
Speed Record
14.
Try It Yourself
In this section of my project I have been asked to construct a car that I made myself. I
then had to run it five times. This is the information I collected along with the speed
which I worked out by dividing the distance by the speed.
Distance (Meters) Time (S) Speed (Meters/S)
3.5 10.1 3.5/10.1 = 0.35
3.3 9.8 3.3/9.8 = 0.34
3.4 9.7 3.4/9.7 = 0.35
3.5 10.2 3.4/10.2 = 0.34
3.2 9.2 3.2/9.2 = 0.35
I then had to work out the average range and speed for the five runs I made:
Distance: 3.5+3.4+3.5+3.4+3.5= 16.3 /5 = 3.46
Time: 10.1+9.8+9.7+10.2+9.2=49 /5=9.8
This means the average speed was:
Average Speed: 3.3 / 9.8 = 0.33 M/S
To work out the range of the numbers, I needed to take the biggest away from the
smallest:
Distance: 3.5 – 3.4 =0.1
Time: 10.2‐9.2 = 1
Range Speed:0.3/1= 0.3 (M/S)
I would say that the mean is the best way to display my data because it gives a fair
representation of my results. You would only really use the median if there was a large
range in my results. For example, if there was a physical problem, such as the wheel
falling off, then I would use the median. Therefore, I chose to use the mean.
15.
I was then asked to make some improvements to my model to make it better:
Improvement 1: Bigger Balloon
Distance (M) Time (S) Speed (M/S)
4.1 8.9 0.46
4.3 9.3 0.46
3.9 9.1 0.43
4.3 9.2 0.47
4.2 9.5 0.44
Improvement 2: Bigger Wheels
Comparing these results to my original results, it shows that I was right to make these
improvements because both produced better results. The bigger wheels made the car
go slightly further but the bigger balloon made it go further and faster, so I think that it
was a better improvement. I also think that if I was to run this experiment again, I would
put both improvements on the car at the same time because I would expect the balloon
to make it go faster and the wheels further producing a more impressive result.
Bibliography
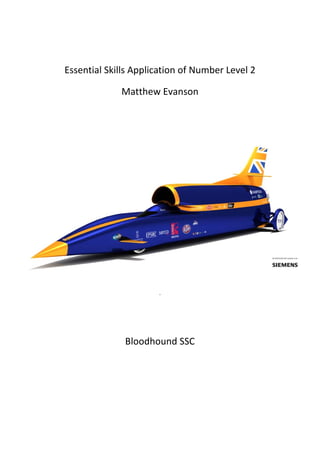
All images have been taken from the Bloodhound website:
http://www.bloodhoundssc.com/. The originators are Curventa and Siemen.
Distance (M) Time (S) Speed (M/S)
3.7 10.6 0.35
3.6 10.5 0.34
3.8 10.9 0.35
3.6 10.8 0.33
3.5 10.4 0.34