SlideShare une entreprise Scribd logo
1  sur  12
Histograms
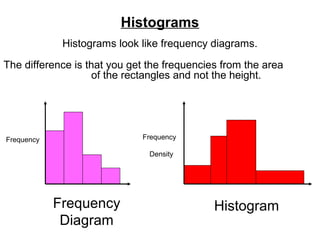
Histograms look like frequency diagrams.
The difference is that you get the frequencies from the area
of the rectangles and not the height.

Frequency

Frequency

Density

Frequency
Diagram

Histogram
Histograms can be used when
the class intervals are unequal.
Time
Frequency
0 < t < 10
20
10 < t < 20
15
20 < t < 30
10
30 < t < 40
9
40 < t < 50
6

Time
Frequency
0 < t < 10
20
10 < t < 15
15
15 < t < 20
10
20 < t < 25
9
25 < t < 40
6

Equal Class Intervals

Unequal Class Intervals
With a histogram you cant not get the
frequency from the height of the bar.
Instead you get the frequency from the area of the bar.
Frequency is equal to the Area of the Bar.
Frequency Density is equal to the Height of the Bar.
frequency
Frequency density =
width of interval
0.4
95
110
105
Width of interval = 10
Height (Frequency density) = 0.4
Area (Frequency) = 4
Find the relevant information for each bar.
0.5

?

10
Width of interval = 10
Frequency density = 0.5
Frequency = 5

1.2

?

?

2

Width of interval = 5
Frequency = 2
Frequency density = 0.4

5

2

8
?

20
Width of interval = 20
Frequency density = 1.2
Frequency = 24

Frequency = 8
Frequency density = 2
Width of interval = 4
Time
Frequency
0 < t < 10
20
10 < t < 15
15
15 < t < 20
10
20 < t < 25
9
25 < t < 40
6

Frequency
Frequency
=
Density
Class width

Frequency
Density

2
3
2
1.8
0.4

20 ÷ 10
15 ÷ 5
10 ÷ 5
9÷5
6 ÷ 15

3.0
2.5
Frequency 2.0
Density
1.5
1.0
0.5
0

Time
0

5

10

15

20

25

30

35

40
Distance

Frequency
0 < t < 20
2
20 < t < 40
4
40 < t < 50
5
50 < t < 70
12
70 < t < 100
9

Frequency
Density

0.1
0.2
0.5
0.6
0.3

2 ÷ 20
4 ÷ 20
5 ÷ 10
12 ÷ 20
9 ÷ 30

0.6
0.5
Frequency
Density

0.4
0.3
0.2
0.1
0

10

20

30

40

50

Distance

60

70

80

90

100
Remember for a histogram the:
Frequency is equal to the Area of the bar.
Frequency Density is equal to the Height of the bar.

0.5

?

1.25

?

0.8

?

15
8
Area = 15 x 0.5 = 7.5

Area = 1.25 x 8 = 10

20
Area = 20 x 0.8 = 16
Copy and complete the table.
Frequency = frequency density × width of interval

Frequency density

2.4
2.0

Time in
seconds

1.6

Frequency
Area
density × (frequency)
width

1.2

95 ≤ t < 105

0.4 × 10

4

0.8

105 ≤ t < 110

1.2 × 5

6

0.4

110 ≤ t < 115

1.4 × 5

7

115 ≤ t < 120

2.2 × 5

11

120 ≤ t < 135

0.4 × 15

6

0
95 100 105 110 115 120 125 130 135
Time in seconds
1.0
0.8
Frequency
Density 0.6

0.4
0.2
0

0

20

40

60

80

100

120

Frequency
0 < t < 40
4
40 < t < 80
8
80 < t < 100
16
100 < t <
12
120
120 < t <
12

140

160

Length

200

40 x 0.1
20 x 0.4
20 x 0.8
20 x 1.0
60 x 0.2

180

Distance
Graph to compare the distances that males and females travel in the car per week.
50
40
30
20
10
0

Distance

0

20

40

60

80

100

120

140

160

180

0

20

40

60

80

100

120

140

160

180 Distance

50
40
30
20
10
0
Length

Frequency

0 < t < 40
40 < t < 80
80 < t < 100
100 < t <
120
120 < t <
200

Length
0 < t < 40
40 < t < 80
80 < t < 100
100 < t <
120
120 < t <
200

Frequency
Review
Write a definition of each word below.
Include methods for calculating.
Data set

Frequency

Class interval

Frequency polygon

Midpoint

Class interval

Range

Histogram

Frequency diagram

Frequency density

Contenu connexe

Tendances

frequency distribution & graphs
frequency distribution & graphsfrequency distribution & graphs
frequency distribution & graphsTirtha_Nil
 
Discrete Mathematics Lecture Notes
Discrete Mathematics Lecture NotesDiscrete Mathematics Lecture Notes
Discrete Mathematics Lecture NotesFellowBuddy.com
 
Mean, median, mode, & range ppt
Mean, median, mode, & range pptMean, median, mode, & range ppt
Mean, median, mode, & range pptmashal2013
 
Graphical representation of data mohit verma
Graphical representation of data mohit verma Graphical representation of data mohit verma
Graphical representation of data mohit verma MOHIT KUMAR VERMA
 
Stem & leaf, Bar graphs, and Histograms
Stem & leaf, Bar graphs, and HistogramsStem & leaf, Bar graphs, and Histograms
Stem & leaf, Bar graphs, and Histogramsbujols
 
Cumulative frequency distribution
Cumulative frequency distributionCumulative frequency distribution
Cumulative frequency distributionMahrukhShehzadi1
 
NS1: Rational and Irrational numbers
NS1: Rational and Irrational numbersNS1: Rational and Irrational numbers
NS1: Rational and Irrational numbersA Wright
 
Stem and-leaf-diagram-ppt.-dfs
Stem and-leaf-diagram-ppt.-dfsStem and-leaf-diagram-ppt.-dfs
Stem and-leaf-diagram-ppt.-dfsFarhana Shaheen
 
Basic Probability
Basic Probability Basic Probability
Basic Probability kaurab
 
Types of graphs
Types of graphsTypes of graphs
Types of graphsLALIT BIST
 
Stem and leaf plot
Stem and leaf plotStem and leaf plot
Stem and leaf plotSusan Vo
 
SET THEORY
SET THEORYSET THEORY
SET THEORYLena
 
Circle & sphere
Circle & sphereCircle & sphere
Circle & sphereJıa Yıı
 
Isomorphism in Math
Isomorphism in MathIsomorphism in Math
Isomorphism in MathMahe Karim
 

Tendances (20)

SMA206_NOTES
SMA206_NOTESSMA206_NOTES
SMA206_NOTES
 
frequency distribution & graphs
frequency distribution & graphsfrequency distribution & graphs
frequency distribution & graphs
 
Discrete Mathematics Lecture Notes
Discrete Mathematics Lecture NotesDiscrete Mathematics Lecture Notes
Discrete Mathematics Lecture Notes
 
Matrix.
Matrix.Matrix.
Matrix.
 
Mean, median, mode, & range ppt
Mean, median, mode, & range pptMean, median, mode, & range ppt
Mean, median, mode, & range ppt
 
PIE CHART
PIE CHARTPIE CHART
PIE CHART
 
Graphical representation of data mohit verma
Graphical representation of data mohit verma Graphical representation of data mohit verma
Graphical representation of data mohit verma
 
Stem & leaf, Bar graphs, and Histograms
Stem & leaf, Bar graphs, and HistogramsStem & leaf, Bar graphs, and Histograms
Stem & leaf, Bar graphs, and Histograms
 
Cumulative frequency distribution
Cumulative frequency distributionCumulative frequency distribution
Cumulative frequency distribution
 
NS1: Rational and Irrational numbers
NS1: Rational and Irrational numbersNS1: Rational and Irrational numbers
NS1: Rational and Irrational numbers
 
Stem and-leaf-diagram-ppt.-dfs
Stem and-leaf-diagram-ppt.-dfsStem and-leaf-diagram-ppt.-dfs
Stem and-leaf-diagram-ppt.-dfs
 
Diagrams
DiagramsDiagrams
Diagrams
 
Basic Probability
Basic Probability Basic Probability
Basic Probability
 
Types of graphs
Types of graphsTypes of graphs
Types of graphs
 
Stem and leaf plot
Stem and leaf plotStem and leaf plot
Stem and leaf plot
 
Matrices
MatricesMatrices
Matrices
 
SET THEORY
SET THEORYSET THEORY
SET THEORY
 
Probability
ProbabilityProbability
Probability
 
Circle & sphere
Circle & sphereCircle & sphere
Circle & sphere
 
Isomorphism in Math
Isomorphism in MathIsomorphism in Math
Isomorphism in Math
 

En vedette

En vedette (20)

Histograms
HistogramsHistograms
Histograms
 
Histogram
HistogramHistogram
Histogram
 
Class Interval Histograms
Class Interval HistogramsClass Interval Histograms
Class Interval Histograms
 
What is a histogram
What is a histogramWhat is a histogram
What is a histogram
 
Histograms
HistogramsHistograms
Histograms
 
Histogram equalization
Histogram equalizationHistogram equalization
Histogram equalization
 
Histogram
HistogramHistogram
Histogram
 
Histogram Equalization(Image Processing Presentation)
Histogram Equalization(Image Processing Presentation)Histogram Equalization(Image Processing Presentation)
Histogram Equalization(Image Processing Presentation)
 
05 histogram processing DIP
05 histogram processing DIP05 histogram processing DIP
05 histogram processing DIP
 
Bar Graphs
Bar GraphsBar Graphs
Bar Graphs
 
Bar chart
Bar chartBar chart
Bar chart
 
Grouped Mean Median Mode
Grouped Mean Median ModeGrouped Mean Median Mode
Grouped Mean Median Mode
 
CBC Histogram DR NARMADA PRASAD TIWARI
 CBC Histogram DR NARMADA PRASAD TIWARI CBC Histogram DR NARMADA PRASAD TIWARI
CBC Histogram DR NARMADA PRASAD TIWARI
 
7 qc toolsTraining pdf
7 qc toolsTraining pdf7 qc toolsTraining pdf
7 qc toolsTraining pdf
 
Histogram Equalization
Histogram EqualizationHistogram Equalization
Histogram Equalization
 
Histogram equalization
Histogram equalizationHistogram equalization
Histogram equalization
 
Photo analysis (photoshoot)
Photo analysis (photoshoot)Photo analysis (photoshoot)
Photo analysis (photoshoot)
 
RBC Group
RBC GroupRBC Group
RBC Group
 
S S08 D I P Lec07 Pixel Operations
S S08  D I P  Lec07  Pixel OperationsS S08  D I P  Lec07  Pixel Operations
S S08 D I P Lec07 Pixel Operations
 
Histogram based enhancement
Histogram based enhancementHistogram based enhancement
Histogram based enhancement
 

Similaire à Histograms

RiseFalltime031114.pptx
RiseFalltime031114.pptxRiseFalltime031114.pptx
RiseFalltime031114.pptxVignesh899811
 
Handling_Data-_Frequency_Diagrams_and_Frequency_Polygons.pptx
Handling_Data-_Frequency_Diagrams_and_Frequency_Polygons.pptxHandling_Data-_Frequency_Diagrams_and_Frequency_Polygons.pptx
Handling_Data-_Frequency_Diagrams_and_Frequency_Polygons.pptxGabriela162538
 
CNIM Questions related to Mathematics and Formulas
CNIM Questions related to Mathematics and Formulas CNIM Questions related to Mathematics and Formulas
CNIM Questions related to Mathematics and Formulas Anurag Tewari MD
 
Descriptive Statistics Part II: Graphical Description
Descriptive Statistics Part II: Graphical DescriptionDescriptive Statistics Part II: Graphical Description
Descriptive Statistics Part II: Graphical Descriptiongetyourcheaton
 
signal homework
signal homeworksignal homework
signal homeworksokok22867
 
Reverberation time
Reverberation timeReverberation time
Reverberation timeManoj Mota
 
Time-Frequency Representation of Microseismic Signals using the SST
Time-Frequency Representation of Microseismic Signals using the SSTTime-Frequency Representation of Microseismic Signals using the SST
Time-Frequency Representation of Microseismic Signals using the SSTUT Technology
 
MR IMAGE QUALITY PARAMETERS.pptx
MR IMAGE QUALITY PARAMETERS.pptxMR IMAGE QUALITY PARAMETERS.pptx
MR IMAGE QUALITY PARAMETERS.pptxKoti Damodara Naidu
 
01 beginning vibration analysis
01 beginning vibration analysis01 beginning vibration analysis
01 beginning vibration analysisDương Phúc
 
beginning vibration analysis
beginning vibration analysisbeginning vibration analysis
beginning vibration analysisMANA PAENG
 
01 beginning vibration analysis
01 beginning vibration analysis01 beginning vibration analysis
01 beginning vibration analysisHugo Alaniz
 
QC of CT using Catphan 600
QC of CT using Catphan 600QC of CT using Catphan 600
QC of CT using Catphan 600Asim Gilani
 
Math - Class V: Area (IGCSE)
Math - Class V: Area (IGCSE)Math - Class V: Area (IGCSE)
Math - Class V: Area (IGCSE)Pooja M
 
CLASS V - Area
CLASS V - AreaCLASS V - Area
CLASS V - AreaPooja M
 
Final Lecture - 2.ppt
Final Lecture - 2.pptFinal Lecture - 2.ppt
Final Lecture - 2.pptssuserbe1d97
 

Similaire à Histograms (20)

S1 starting points
S1 starting pointsS1 starting points
S1 starting points
 
RiseFalltime031114.pptx
RiseFalltime031114.pptxRiseFalltime031114.pptx
RiseFalltime031114.pptx
 
Handling_Data-_Frequency_Diagrams_and_Frequency_Polygons.pptx
Handling_Data-_Frequency_Diagrams_and_Frequency_Polygons.pptxHandling_Data-_Frequency_Diagrams_and_Frequency_Polygons.pptx
Handling_Data-_Frequency_Diagrams_and_Frequency_Polygons.pptx
 
CNIM Questions related to Mathematics and Formulas
CNIM Questions related to Mathematics and Formulas CNIM Questions related to Mathematics and Formulas
CNIM Questions related to Mathematics and Formulas
 
Descriptive Statistics Part II: Graphical Description
Descriptive Statistics Part II: Graphical DescriptionDescriptive Statistics Part II: Graphical Description
Descriptive Statistics Part II: Graphical Description
 
Statistic chapter 1 & 2
Statistic chapter 1 & 2Statistic chapter 1 & 2
Statistic chapter 1 & 2
 
signal homework
signal homeworksignal homework
signal homework
 
Reverberation time
Reverberation timeReverberation time
Reverberation time
 
waveforms.ppt
waveforms.pptwaveforms.ppt
waveforms.ppt
 
Time-Frequency Representation of Microseismic Signals using the SST
Time-Frequency Representation of Microseismic Signals using the SSTTime-Frequency Representation of Microseismic Signals using the SST
Time-Frequency Representation of Microseismic Signals using the SST
 
MR IMAGE QUALITY PARAMETERS.pptx
MR IMAGE QUALITY PARAMETERS.pptxMR IMAGE QUALITY PARAMETERS.pptx
MR IMAGE QUALITY PARAMETERS.pptx
 
01 beginning vibration analysis
01 beginning vibration analysis01 beginning vibration analysis
01 beginning vibration analysis
 
beginning vibration analysis
beginning vibration analysisbeginning vibration analysis
beginning vibration analysis
 
RES701 Research Methodology_FFT
RES701 Research Methodology_FFTRES701 Research Methodology_FFT
RES701 Research Methodology_FFT
 
01 beginning vibration analysis
01 beginning vibration analysis01 beginning vibration analysis
01 beginning vibration analysis
 
QC of CT using Catphan 600
QC of CT using Catphan 600QC of CT using Catphan 600
QC of CT using Catphan 600
 
Shereef_MP3_decoder
Shereef_MP3_decoderShereef_MP3_decoder
Shereef_MP3_decoder
 
Math - Class V: Area (IGCSE)
Math - Class V: Area (IGCSE)Math - Class V: Area (IGCSE)
Math - Class V: Area (IGCSE)
 
CLASS V - Area
CLASS V - AreaCLASS V - Area
CLASS V - Area
 
Final Lecture - 2.ppt
Final Lecture - 2.pptFinal Lecture - 2.ppt
Final Lecture - 2.ppt
 

Dernier

WordPress Websites for Engineers: Elevate Your Brand
WordPress Websites for Engineers: Elevate Your BrandWordPress Websites for Engineers: Elevate Your Brand
WordPress Websites for Engineers: Elevate Your Brandgvaughan
 
The Future of Software Development - Devin AI Innovative Approach.pdf
The Future of Software Development - Devin AI Innovative Approach.pdfThe Future of Software Development - Devin AI Innovative Approach.pdf
The Future of Software Development - Devin AI Innovative Approach.pdfSeasiaInfotech2
 
"Subclassing and Composition – A Pythonic Tour of Trade-Offs", Hynek Schlawack
"Subclassing and Composition – A Pythonic Tour of Trade-Offs", Hynek Schlawack"Subclassing and Composition – A Pythonic Tour of Trade-Offs", Hynek Schlawack
"Subclassing and Composition – A Pythonic Tour of Trade-Offs", Hynek SchlawackFwdays
 
Powerpoint exploring the locations used in television show Time Clash
Powerpoint exploring the locations used in television show Time ClashPowerpoint exploring the locations used in television show Time Clash
Powerpoint exploring the locations used in television show Time Clashcharlottematthew16
 
My Hashitalk Indonesia April 2024 Presentation
My Hashitalk Indonesia April 2024 PresentationMy Hashitalk Indonesia April 2024 Presentation
My Hashitalk Indonesia April 2024 PresentationRidwan Fadjar
 
Install Stable Diffusion in windows machine
Install Stable Diffusion in windows machineInstall Stable Diffusion in windows machine
Install Stable Diffusion in windows machinePadma Pradeep
 
Search Engine Optimization SEO PDF for 2024.pdf
Search Engine Optimization SEO PDF for 2024.pdfSearch Engine Optimization SEO PDF for 2024.pdf
Search Engine Optimization SEO PDF for 2024.pdfRankYa
 
Are Multi-Cloud and Serverless Good or Bad?
Are Multi-Cloud and Serverless Good or Bad?Are Multi-Cloud and Serverless Good or Bad?
Are Multi-Cloud and Serverless Good or Bad?Mattias Andersson
 
Anypoint Exchange: It’s Not Just a Repo!
Anypoint Exchange: It’s Not Just a Repo!Anypoint Exchange: It’s Not Just a Repo!
Anypoint Exchange: It’s Not Just a Repo!Manik S Magar
 
Unraveling Multimodality with Large Language Models.pdf
Unraveling Multimodality with Large Language Models.pdfUnraveling Multimodality with Large Language Models.pdf
Unraveling Multimodality with Large Language Models.pdfAlex Barbosa Coqueiro
 
Nell’iperspazio con Rocket: il Framework Web di Rust!
Nell’iperspazio con Rocket: il Framework Web di Rust!Nell’iperspazio con Rocket: il Framework Web di Rust!
Nell’iperspazio con Rocket: il Framework Web di Rust!Commit University
 
DevEX - reference for building teams, processes, and platforms
DevEX - reference for building teams, processes, and platformsDevEX - reference for building teams, processes, and platforms
DevEX - reference for building teams, processes, and platformsSergiu Bodiu
 
SAP Build Work Zone - Overview L2-L3.pptx
SAP Build Work Zone - Overview L2-L3.pptxSAP Build Work Zone - Overview L2-L3.pptx
SAP Build Work Zone - Overview L2-L3.pptxNavinnSomaal
 
DevoxxFR 2024 Reproducible Builds with Apache Maven
DevoxxFR 2024 Reproducible Builds with Apache MavenDevoxxFR 2024 Reproducible Builds with Apache Maven
DevoxxFR 2024 Reproducible Builds with Apache MavenHervé Boutemy
 
AI as an Interface for Commercial Buildings
AI as an Interface for Commercial BuildingsAI as an Interface for Commercial Buildings
AI as an Interface for Commercial BuildingsMemoori
 
Streamlining Python Development: A Guide to a Modern Project Setup
Streamlining Python Development: A Guide to a Modern Project SetupStreamlining Python Development: A Guide to a Modern Project Setup
Streamlining Python Development: A Guide to a Modern Project SetupFlorian Wilhelm
 
SIP trunking in Janus @ Kamailio World 2024
SIP trunking in Janus @ Kamailio World 2024SIP trunking in Janus @ Kamailio World 2024
SIP trunking in Janus @ Kamailio World 2024Lorenzo Miniero
 
Integration and Automation in Practice: CI/CD in Mule Integration and Automat...
Integration and Automation in Practice: CI/CD in Mule Integration and Automat...Integration and Automation in Practice: CI/CD in Mule Integration and Automat...
Integration and Automation in Practice: CI/CD in Mule Integration and Automat...Patryk Bandurski
 
"Federated learning: out of reach no matter how close",Oleksandr Lapshyn
"Federated learning: out of reach no matter how close",Oleksandr Lapshyn"Federated learning: out of reach no matter how close",Oleksandr Lapshyn
"Federated learning: out of reach no matter how close",Oleksandr LapshynFwdays
 

Dernier (20)

WordPress Websites for Engineers: Elevate Your Brand
WordPress Websites for Engineers: Elevate Your BrandWordPress Websites for Engineers: Elevate Your Brand
WordPress Websites for Engineers: Elevate Your Brand
 
The Future of Software Development - Devin AI Innovative Approach.pdf
The Future of Software Development - Devin AI Innovative Approach.pdfThe Future of Software Development - Devin AI Innovative Approach.pdf
The Future of Software Development - Devin AI Innovative Approach.pdf
 
"Subclassing and Composition – A Pythonic Tour of Trade-Offs", Hynek Schlawack
"Subclassing and Composition – A Pythonic Tour of Trade-Offs", Hynek Schlawack"Subclassing and Composition – A Pythonic Tour of Trade-Offs", Hynek Schlawack
"Subclassing and Composition – A Pythonic Tour of Trade-Offs", Hynek Schlawack
 
E-Vehicle_Hacking_by_Parul Sharma_null_owasp.pptx
E-Vehicle_Hacking_by_Parul Sharma_null_owasp.pptxE-Vehicle_Hacking_by_Parul Sharma_null_owasp.pptx
E-Vehicle_Hacking_by_Parul Sharma_null_owasp.pptx
 
Powerpoint exploring the locations used in television show Time Clash
Powerpoint exploring the locations used in television show Time ClashPowerpoint exploring the locations used in television show Time Clash
Powerpoint exploring the locations used in television show Time Clash
 
My Hashitalk Indonesia April 2024 Presentation
My Hashitalk Indonesia April 2024 PresentationMy Hashitalk Indonesia April 2024 Presentation
My Hashitalk Indonesia April 2024 Presentation
 
Install Stable Diffusion in windows machine
Install Stable Diffusion in windows machineInstall Stable Diffusion in windows machine
Install Stable Diffusion in windows machine
 
Search Engine Optimization SEO PDF for 2024.pdf
Search Engine Optimization SEO PDF for 2024.pdfSearch Engine Optimization SEO PDF for 2024.pdf
Search Engine Optimization SEO PDF for 2024.pdf
 
Are Multi-Cloud and Serverless Good or Bad?
Are Multi-Cloud and Serverless Good or Bad?Are Multi-Cloud and Serverless Good or Bad?
Are Multi-Cloud and Serverless Good or Bad?
 
Anypoint Exchange: It’s Not Just a Repo!
Anypoint Exchange: It’s Not Just a Repo!Anypoint Exchange: It’s Not Just a Repo!
Anypoint Exchange: It’s Not Just a Repo!
 
Unraveling Multimodality with Large Language Models.pdf
Unraveling Multimodality with Large Language Models.pdfUnraveling Multimodality with Large Language Models.pdf
Unraveling Multimodality with Large Language Models.pdf
 
Nell’iperspazio con Rocket: il Framework Web di Rust!
Nell’iperspazio con Rocket: il Framework Web di Rust!Nell’iperspazio con Rocket: il Framework Web di Rust!
Nell’iperspazio con Rocket: il Framework Web di Rust!
 
DevEX - reference for building teams, processes, and platforms
DevEX - reference for building teams, processes, and platformsDevEX - reference for building teams, processes, and platforms
DevEX - reference for building teams, processes, and platforms
 
SAP Build Work Zone - Overview L2-L3.pptx
SAP Build Work Zone - Overview L2-L3.pptxSAP Build Work Zone - Overview L2-L3.pptx
SAP Build Work Zone - Overview L2-L3.pptx
 
DevoxxFR 2024 Reproducible Builds with Apache Maven
DevoxxFR 2024 Reproducible Builds with Apache MavenDevoxxFR 2024 Reproducible Builds with Apache Maven
DevoxxFR 2024 Reproducible Builds with Apache Maven
 
AI as an Interface for Commercial Buildings
AI as an Interface for Commercial BuildingsAI as an Interface for Commercial Buildings
AI as an Interface for Commercial Buildings
 
Streamlining Python Development: A Guide to a Modern Project Setup
Streamlining Python Development: A Guide to a Modern Project SetupStreamlining Python Development: A Guide to a Modern Project Setup
Streamlining Python Development: A Guide to a Modern Project Setup
 
SIP trunking in Janus @ Kamailio World 2024
SIP trunking in Janus @ Kamailio World 2024SIP trunking in Janus @ Kamailio World 2024
SIP trunking in Janus @ Kamailio World 2024
 
Integration and Automation in Practice: CI/CD in Mule Integration and Automat...
Integration and Automation in Practice: CI/CD in Mule Integration and Automat...Integration and Automation in Practice: CI/CD in Mule Integration and Automat...
Integration and Automation in Practice: CI/CD in Mule Integration and Automat...
 
"Federated learning: out of reach no matter how close",Oleksandr Lapshyn
"Federated learning: out of reach no matter how close",Oleksandr Lapshyn"Federated learning: out of reach no matter how close",Oleksandr Lapshyn
"Federated learning: out of reach no matter how close",Oleksandr Lapshyn
 

Histograms

  • 1. Histograms Histograms look like frequency diagrams. The difference is that you get the frequencies from the area of the rectangles and not the height. Frequency Frequency Density Frequency Diagram Histogram
  • 2. Histograms can be used when the class intervals are unequal. Time Frequency 0 < t < 10 20 10 < t < 20 15 20 < t < 30 10 30 < t < 40 9 40 < t < 50 6 Time Frequency 0 < t < 10 20 10 < t < 15 15 15 < t < 20 10 20 < t < 25 9 25 < t < 40 6 Equal Class Intervals Unequal Class Intervals
  • 3. With a histogram you cant not get the frequency from the height of the bar. Instead you get the frequency from the area of the bar. Frequency is equal to the Area of the Bar. Frequency Density is equal to the Height of the Bar. frequency Frequency density = width of interval 0.4 95 110 105 Width of interval = 10 Height (Frequency density) = 0.4 Area (Frequency) = 4
  • 4. Find the relevant information for each bar. 0.5 ? 10 Width of interval = 10 Frequency density = 0.5 Frequency = 5 1.2 ? ? 2 Width of interval = 5 Frequency = 2 Frequency density = 0.4 5 2 8 ? 20 Width of interval = 20 Frequency density = 1.2 Frequency = 24 Frequency = 8 Frequency density = 2 Width of interval = 4
  • 5. Time Frequency 0 < t < 10 20 10 < t < 15 15 15 < t < 20 10 20 < t < 25 9 25 < t < 40 6 Frequency Frequency = Density Class width Frequency Density 2 3 2 1.8 0.4 20 ÷ 10 15 ÷ 5 10 ÷ 5 9÷5 6 ÷ 15 3.0 2.5 Frequency 2.0 Density 1.5 1.0 0.5 0 Time 0 5 10 15 20 25 30 35 40
  • 6. Distance Frequency 0 < t < 20 2 20 < t < 40 4 40 < t < 50 5 50 < t < 70 12 70 < t < 100 9 Frequency Density 0.1 0.2 0.5 0.6 0.3 2 ÷ 20 4 ÷ 20 5 ÷ 10 12 ÷ 20 9 ÷ 30 0.6 0.5 Frequency Density 0.4 0.3 0.2 0.1 0 10 20 30 40 50 Distance 60 70 80 90 100
  • 7. Remember for a histogram the: Frequency is equal to the Area of the bar. Frequency Density is equal to the Height of the bar. 0.5 ? 1.25 ? 0.8 ? 15 8 Area = 15 x 0.5 = 7.5 Area = 1.25 x 8 = 10 20 Area = 20 x 0.8 = 16
  • 8. Copy and complete the table. Frequency = frequency density × width of interval Frequency density 2.4 2.0 Time in seconds 1.6 Frequency Area density × (frequency) width 1.2 95 ≤ t < 105 0.4 × 10 4 0.8 105 ≤ t < 110 1.2 × 5 6 0.4 110 ≤ t < 115 1.4 × 5 7 115 ≤ t < 120 2.2 × 5 11 120 ≤ t < 135 0.4 × 15 6 0 95 100 105 110 115 120 125 130 135 Time in seconds
  • 9. 1.0 0.8 Frequency Density 0.6 0.4 0.2 0 0 20 40 60 80 100 120 Frequency 0 < t < 40 4 40 < t < 80 8 80 < t < 100 16 100 < t < 12 120 120 < t < 12 140 160 Length 200 40 x 0.1 20 x 0.4 20 x 0.8 20 x 1.0 60 x 0.2 180 Distance
  • 10. Graph to compare the distances that males and females travel in the car per week. 50 40 30 20 10 0 Distance 0 20 40 60 80 100 120 140 160 180 0 20 40 60 80 100 120 140 160 180 Distance 50 40 30 20 10 0
  • 11. Length Frequency 0 < t < 40 40 < t < 80 80 < t < 100 100 < t < 120 120 < t < 200 Length 0 < t < 40 40 < t < 80 80 < t < 100 100 < t < 120 120 < t < 200 Frequency
  • 12. Review Write a definition of each word below. Include methods for calculating. Data set Frequency Class interval Frequency polygon Midpoint Class interval Range Histogram Frequency diagram Frequency density

Notes de l'éditeur

  1. The results obtained should be compared with the original graph.