Using GIS for effective flood management
•
43 j'aime•22,060 vues

Presentation given at the Ordnance Survey Local Government and Emergency Services User Conference on the 27th April 2010.

Recommandé
Recommandé
Contenu connexe
Tendances
Tendances (20)
Similaire à Using GIS for effective flood management
Similaire à Using GIS for effective flood management (20)
Dernier
Dernier (20)
Using GIS for effective flood management
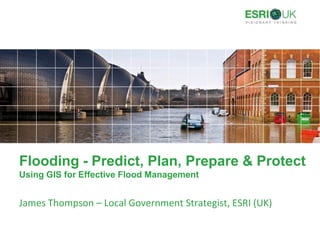
- 1. Flooding - Predict, Plan, Prepare & ProtectUsing GIS for Effective Flood Management James Thompson – Local Government Strategist, ESRI (UK)
- 2. Welcome and Introductions Presentation About me James Thompson Local Government Strategist, ESRI (UK) Why GIS should be more widely used to support flood management Review technology, legislative and economic drivers for change Current best practice and where GIS adds value for flood management Stimulate ideas, discussion and debate
- 3. Overview England & Wales Floodplains Flooding is not a new phenomenon In the UK around 12% of the population - 2.2 million homes and 185,000 business lie in flood risk areas In England & Wales Defra’s valuation of assets at risk in flood risk areas stands at £221 bn Including Surface Water flooding - 5.5 million properties - 1 in 6 properties
- 5. New responsibilities for Local Authorities Local authorities will be given day-to-day responsibility for preparing and putting in place strategies for managing flood risk from groundwater, surface water and ordinary watercourses. Ensure arrangements are in place for the co-ordination of flood risk management across their area Local authorities will also be required to take responsibility for new Sustainable Drainage Systems (SUDS) and will be given the power to decide whether new developments will be connected to existing sewage networks. Maintain a register of flood risk management structures, investigate flooding incidents where there is uncertainty over responsibility
- 6. Floods and Water Management BillNext Steps A programme of implementation will be published indicating commencement dates for provisions in the new bill. There will be a rapid programme of regulations or guidance development where this is required to implement the bill Development of SUDs standards is already underway. Local authorities trialling new guidance for surface water management plans Regulations likely to take until 2011 to enact whilst guidance should be available later this year* * A change of government may alter how water legislation is developed.
- 7. Surface Water Management PlanGIS is integral to the SWMP process Preparation - appropriate information for the SWMP is collated, analysed and mapped in a GIS platform Data Collation - Data and information which is collated at this stage should be held in a central store, with the lead partner chiefly responsible for collating, organising and maintaining the store of information. Data on assets and historical flooding should be mapped using GIS tools
- 8. Surface Water Management PlanGIS is integral to the SWMP process Understanding Risk - Flood risk should also be mapped to highlight locations at risk of surface water flooding for a range of flood probabilities. The mapping process is important to engage stakeholders on the surface water flood risk and specifically to inform the spatial planning process. The location of critical infrastructure should also be mapped, to identify whether they are at risk of surface water flooding
- 9. Our Vision – Enterprise GISEnabling more integrated emergency planning Silver Command Common Operating Picture OS MasterMap Field Officer Mobile data capture Local Authority Coordinating the recovery process GIS Analyst Analysis of flood risk & location of critical infrastructure Citizen Accessing information at home . . . Around Shared Geospatial Infrastructure
- 11. Efficiency
- 12. Cost Savings
- 14. Better
- 15. Communication
- 16. Collaboration
- 17. CoordinationGeographic Knowledge Analyze Measure . . . Integrating Information Processes & Workflows Integrating Geography Into How We Behave
- 18. Flooding
- 19. GIS Analyst
- 20. Surface Water Flooding Analysis Geoprocessing model to analyze the density of manmade structures This model could be deployed to other users via desktop or web technology.
- 22. Fluvial Flooding Analysis Analysis of historic flood to help inform the planning process PPS 25: “Flood risk is taken into account at all stages in the planning process” “Avoid inappropriate development in areas at risk of flooding, and to direct development away from areas at highest risk.” www.wallingfordsoftware.com
- 23. Mapping Critical Infrastructure Probability defined by EA flood models Impact from a density analysis on critical infrastructure
- 24. Sharing Information Enable the sharing and dissemination of risk information to partners Potential for using GeoPDF: Export to PDF option Allows layers to be turned on/off Features can be identified to return attribute data
- 25. Bronze Command
- 26. Mobile data capture More effectively manage an ever-changing situation Real-time access to GIS updates consolidated across field teams Faster data collection and decisions No expensive field computing equipment or training, officers use just the pen and paper Converts to digital data when docked back to computer www.adapx.com
- 27. Silver Command
- 28. Local Response Coordination The SMART Board interactive whiteboard conveys information in a highly visible manner and acts as a common frame of reference for response coordination Locations of critical infrastructure and mobile data captured in the field can be displayed instantly Touch screen controls integrate with the corporate GIS - Drag from legend onto map to create new features Easy to use www.smarttech.com
- 29. Improving Situational Awareness The Common Operational Picture Viewer - Web client created using the ArcGIS Server API for Flex Bringing together internal / external datasets Web technology enables information to be shared easily with all partners Build your own (COP) viewer through readily available ESRI templates
- 30. Reference maps Assessment planning IDP camp locations Who-What-Where Affected population www.mapaction.org
- 31. ESRI Haiti Map Viewer http://asademo.esri.com/flexviewer1_3/
- 32. Citizen
- 33. Providing information to the CitizenServing the citizen online Portal providing key information Locations of resources such as water & sandbags More effectively manage simple, high volume transactions Reduced transaction costs Embed location capabilities throughout the website Social Media capabilities: Publish information as RSS feeds
- 34. Social Media & GIS Convergence By adding geolocation to social media, or by consuming services that provide geolocation information, we can use GIS to build a visual model of what's happening in real-time (or at least close to real-time). For example, geotagged or geocoded Twitter messages can be added to the map to determine exactly what is happening and where. Flickr and YouTube provide GeoRSS feeds that allow you to add the latest images and videos to the map for a specific location. When we put all of these services together, we can start to build a powerful model of what's happening in real-time, to enable evidence based decision making. +
- 35. GIS can make a difference GIS is “the right technology at the right time” for tackling the problems of the next decade, “overpopulation, food shortages, reduced agricultural production, adverse climate change, poverty - these are all quintessentially geographic problems.” Rodger Tomlinson - February 2009 | GEOconnexion International Magazine Roger Tomlinson Geographer Developed the first GIS
- 38. www.esriuk.com
Notes de l'éditeur
- Consider why GIS should be more widely used to support flood managementReview technology, legislative and economic drivers for changeHighlight current best practice and where GIS adds value for flood management & improving situational awareness
- In the last few years the UK has experienced some of the worst flooding in living memory. The impact of recent flooding events in the UK has been dramaticThe 2007 summer floods for example – 55,000 properties affected, 7,000 business disrupted, 8 motorways cut off, £3bn damagePlus we have had Carlisle, Boscastle and the recent flooding in Scotland & Cockermouth in Cumbria
- Policy DriversThe Flood and Water Management BillGained Royal Assent 8th April 2010The Act will implement several key recommendations of Sir Michael Pitt’s Review of the Summer 2007 floods: Strategic overview role for the Environment Agency on all forms of flooding at the National level New statutory responsibilities for local authorities in managing flood risk All partners to co-operate and provide information to improve flood risk management Requirements for more sustainable drainage systemsPlanning Policy Statement 25 (Development & Flood Risk) March 2010Flooding considered at all stages of the planning processLink between spatial planning and emergency planningTechnical Guidance on Surface Water Management Plans 2009
- In terms of new responsibilities for Local Authorities the Act:• New statutory responsibilities for managing flood risk – There will be national strategies and guidance on managing flood risk in England and Wales. • Unitary and county councils will bring together the relevant bodies, who will have a duty to cooperate, to develop local strategies for managing local flood risk. • Protection of assets which help manage flood risk – The Environment Agency, local authorities and internal drainage boards will be able to ensure that private assets which help manage the risks of floods cannot be altered without consent. For example, putting a gate in a wall that is helping protect an area could increase the risk of flooding. However there are still big questions around funding and the timescale for implementation
- The guidance is very clear that coordinated data management and GIS is integral to the overall SWMP process:• Suggests that appropriate information for the SWMP is collated, analysed and mapped in a GIS platform • Big onus on collection and management of data , mapping using GIS tools
- Understanding Risk:• Surface water flood risk should be mapped, engage stakeholders and inform the planning process.• All so identify the risk to critical infrastructure.
- The flooding scenario looks at how GIS and a coordinated response between multiple organisations can help improve the management of flooding in the UK. In particular it focuses in on four areas; prediction, prevention, planning and response. Each part of the scenario concentrates on one specific role in the overall management of flood:1.GIS Analyst (Local Planning officer)•Investigating the impact land use planning has on flood risk•Reviewing how planners can help reduce the risk of flood by limiting building on flood plains and preventing concreting over of natural surfaces2.Bronze Command•Looking at the role of GIS working out in the field at an operational level•Working with innovative hardware to improve access to GIS software 3.Silver Command•Looking at the role of the Police, Fire, Ambulance and Environment Agency and cross organisation access to data•Examining at a tactical level how to manage resources and deal with a flood incident when it happens4. Citizen•Accessing the internet to find up to date information about the flood situation and resources available to help
- 1.GIS Analyst (Local Planning officer)• Investigating the impact land use planning has on flood risk• Reviewing how planners can help reduce the risk of flood by limiting building on flood plains and preventing concreting over of natural surfaces
- Created a model in ArcGIS to analyse the density of manmade surfaces based on MAKE field within the OS MasterMap Topography layerMAKE attribute field between ‘Manmade’ and ‘Natural’If we zoon in we can see the output for each 100m x 100m grid (CLICK)This analysis can be used to help inform the planning process about the potential flooding risk associated with building over green spaces.
- The revised Planning Policy Statement 25:(Development & Flood Risk) advises planners that: Flood risk is taken into account at all stages in the planning process.Planning Policy is a central part of the process of managing flood risk and there is also a model to calculate the risk associated with river flooding.Risk = Probability x Impact
- Look at the location of critical infrastructure [Utility infrastructure / Public Buildings (Council Offices, schools etc)] and create a density surface.Intersect this with the probable flood extents from the Environment Agency.Identify not only individual assets but he areas of highest risk from flooding.
- Parish Councils
- 2.Bronze Command•Looking at the role of GIS working out in the field at an operational level
- 3.Silver Command•Looking at the role of the Police, Fire, Ambulance and Environment Agency and cross organisation access to data•Examining at a tactical level how to manage resources and deal with a flood incident when it happens
- A COP viewer creates broad situational awareness by combining important geographic information system (GIS) base map data, such as imagery, critical infrastructure, and hazards, with changing, up-to-the-minute information from cameras, sensors, and other communication devices.Traffic cams, Multiagency data GPS feeds from police & emergency services vehiclesBig opportunity – because flood management involves so many agencies
- 4. Citizen•Accessing the internet to find up to date information about the flood situation and resources available to help
- However web GIS is moving us into a new era, enabling councils to more effectively serve the citizen online. Offing more innovative ways of delivering public services online and of course more cost effectively.
- More and more that communities and agencies are adopting social media as an important channel for sharing information During recent disasters and major events, we've seen more and more that communities and agencies are adopting social media as an important channel for sharing information. Closer to home the recent spell of cold weather and widespread snow was a spur to many councils to communicate with their communities using social media. Kirklees MBC and Essex CC were among those to set up a ‘Gritter Twitter’ - a dedicated Twitter feed giving regular updates on which roads were being gritted.This abstract with consider the potential benefits to government in Scotland of combining location and social media technologies to improve engagement and service delivery to the citizen.
- Be confident - the market is moving towards Enterprise-GISEnterprise GIS brings the power of geography to the whole organisationCome and talk to us
- ESRI UK’s Enterprise Lab is a dedicated facility, purpose built to enable our customers to experience first-hand the full potential of GIS in action.Benefits of the Enterprise Lab:Experience first hand the benefits of enterprise wide GISRealise the potential value from an investment in GISUnderstand GIS best practiceStimulate discussion and innovative thinking