
Recommandé
Recommandé
Contenu connexe
Dernier
Dernier (20)
En vedette
En vedette (20)
Thai Defense Industry Market Attractiveness Forecasts 2018 Report by SDI
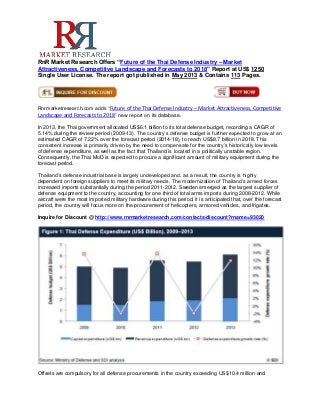
- 1. RnR Market Research Offers “Future of the Thai Defense Industry – Market Attractiveness, Competitive Landscape and Forecasts to 2018” Report at US$ 1250 Single User License. The report got published in May 2013 & Contains 113 Pages. Rnrmarketresearch.com adds “Future of the Thai Defense Industry – Market Attractiveness, Competitive Landscape and Forecasts to 2018” new report on its database. In 2013, the Thai government allocated US$6.1 billion to its total defense budget, recording a CAGR of 5.14% during the review period (2009-13). The country’s defense budget is further expected to grow at an estimated CAGR of 7.22% over the forecast period (2014-18), to reach US$8.7 billion in 2018. This consistent increase is primarily driven by the need to compensate for the country’s historically low levels of defense expenditure, as well as the fact that Thailand is located in a politically unstable region. Consequently, the Thai MoD is expected to procure a significant amount of military equipment during the forecast period. Thailand’s defense industrial base is largely undeveloped and, as a result, the country is highly dependent on foreign suppliers to meet its military needs. The modernization of Thailand’s armed forces increased imports substantially during the period 2011-2012. Sweden emerged as the largest supplier of defense equipment to the country, accounting for one third of total arms imports during 2008-2012. While aircraft were the most imported military hardware during this period, it is anticipated that, over the forecast period, the country will focus more on the procurement of helicopters, armored vehicles, and frigates. Inquire for Discount @ http://www.rnrmarketresearch.com/contacts/discount?rname=93020 Offsets are compulsory for all defense procurements in the country exceeding US$10.4 million and
- 2. foreign investors are obligated to invest between 20% and 50% of their contract value into the Thai economy. Even though the government encourages offsets in order to enhance the defense industrial base of the country, indirect offsets are also accepted and the country treats counter-purchase as an eligible offset activity. Additionally, if a foreign OEM is unable to fulfill its offset commitment, it is obligated to pay 5% of the unfulfilled offset obligation as penalty. Reasons to buy - Understand the historical performance of the defense industry in Southeast Asia’s largest market, alongside future industry projections. - Gain insight into the key challenges and opportunities identified by influential suppliers and buyers involved in Thailand, enabling industry stakeholders to understand the business sentiment prevailing in the industry. - Promote your capacity for growth by aligning your capabilities and business practices with the changing needs of the Thai market. - Predict how the Thai national defense industry will grow, consolidate, and where it will stagnate. - Gain access to primary survey research conducted by Strategic Defence Intelligence across its B2B panels comprised of senior purchase decision makers and leading supplier organizations. Buy a Report Copy @ http://www.rnrmarketresearch.com/contacts/purchase?rname=93020 Table of Content 1 Introduction 1.1. What Is This Report About? 1.2. Definitions 1.3. Summary Methodology 1.4. SDI Terrorism Index 1.5. About Strategic Defence Intelligence 2 Executive Summary 3 Market Attractiveness And Emerging Opportunities 3.1. Defense Market Size Historical And Forecast 3.1.1. The Thai Defense Budget Expected To Grow At A CAGR Of 7.22% Over The Forecast Period 3.1.2. Modernization Of The Armed Forces, Arms Race With Other Asian Countries And Border Security To Drive Thai Defense Spending 3.1.3. Defense Expenditure As A Percentage Of GDP Is Expected To Reach 1.49% By 2018 3.2. Analysis Of Defense Budget Allocation 3.2.1. Capital Expenditure Allocation Is Expected To Increase Over The Forecast Period 3.2.2. Expenditure On Army To Account Half Of The Total Defense Budget 3.2.3. Air Force Expenditure To Grow At A CAGR Of 7.35% Over The Forecast Period 3.2.4. Naval Expenditure Is Expected To Reach US$1.8 Billion By 2018 3.2.5. Thailand To Spend US$4.3 Billion On Support Services During The Forecast Period 3.3. Homeland Security Market Size And Forecast 3.3.1. Thai Homeland Security Spending Expected To Grow At A CAGR Of 2.08% Over The Forecast Period 3.3.2. Counter Terrorism And Maritime Security To Drive Thai Homeland Security Expenditure 3.3.3. Thailand Faces A High Level Of Threat From Foreign Terrorist Organizations 3.3.4. Thailand Has A Terrorism Index Score Of “2.3” 3.4. Benchmarking With Key Global Markets 3.4.1. Thai Defense Expenditure Expected To Increase Over The Forecast Period 3.4.2. Thai Defense Expenditure Is Relatively Smaller Than Other Asian Countries 3.4.3. Thailand Defense Budget As A Percentage Of GDP Is Expected To Decline Over The Forecast
- 3. Period 3.4.4. Iraq, Pakistan, And Afghanistan Are The Most Terror-Prone Countries 3.5. Market Opportunities: Key Trends And Growth Stimulators 3.5.1. Border Security 3.5.2. Main Battle Tank (MBT) 3.5.3. Multi Mission And Rescue Helicopters 3.5.4. Transport Helicopters 3.5.5. Anti-Ship Missiles 3.5.6. Fighters And Multi-Role Aircraft 3.5.7. Frigates 4 Defense Procurement Market Dynamics 4.1. Import Market Dynamics 4.1.1. Thailand's Defense Imports Are Expected To Increase Over The Forecast Period 4.1.2. Sweden And Ukraine To Remain The Key Arms Suppliers To Thailand 4.1.3. Helicopters And Armored Vehicles Are Expected To Be The Key Imports For Thailand 4.2. Export Market Dynamics 4.2.1. No Defense Exports For Thailand 5 Industry Dynamics 5.1. Five Forces Analysis 5.1.1. Bargaining Power Of Supplier: Low 5.1.2. Bargaining Power Of Buyer: High 5.1.3. Barrier To Entry: Low To Medium 5.1.4. Intensity Of Rivalry: High 5.1.5. Threat Of Substitution: High 6 Market Entry Strategy 6.1. Market Regulation 6.1.1. Thai Defense Industry Is Largely Driven By The Government's Offset Policy 6.1.2. The Thai Defense Sector Is Partially Regulated 6.2. Market Entry Route 6.2.1. Defense Exhibitions Can Be Used As A Direct Entry Route To The Thai Defense Industry 6.2.2. Foreign Military Sales (FMS) To Thailand 6.2.3. Foreign Defense Organizations Venture Into The Market By Partnering With A Domestic Defense Firm 6.3. Key Challenges 6.3.1. Negligible Defense Exports Pose A Challenge For Domestic Defense Companies 6.3.2. Limited Defense Budget Discourages Investors From Market Entry 6.3.3. Corruption And Lack Of Transparency Impede The Growth Of Thailand's Defense Industry 6.3.4. Presence Of Indirect Offset Hampers The Growth Of The Domestic Defense Sector 7 Competitive Landscape And Strategic Insights 7.1. Competitive Landscape Overview 7.2. Key Private Sector Companies 7.2.1. Avia Saab Technologies Co. Ltd.: Overview 7.2.2. Avia Saab Technologies Co. Ltd.: Products And Services 7.2.3. Avia Saab Technologies Co. Ltd.: Recent Announcements And Strategic Initiatives 7.2.4. Avia Saab Technologies Co. Ltd.: Recent Contract Wins 7.2.5. Avia Satcom: Overview 7.2.6. Avia Satcom: Products And Services 7.2.7. Avia Satcom: Alliances 7.2.8. Avia Satcom: Recent Contract Wins 7.2.9. Infowave (Thailand) Co., Ltd.: Overview 7.2.10. Infowave (Thailand) Co., Ltd.: Products And Services 7.2.11. Infowave (Thailand) Co., Ltd.: Alliances
- 4. 8 Business Environment And Country Risk 8.1. Demographics 8.1.1. Total Rural Population 8.1.2. Total Urban Population 8.1.3. Number Of Households 8.2. Economic Performance 8.2.1. GDP Per Capita At Constant Prices 8.2.2. GDP At Current Prices (US$) 8.2.3. Exports Of Goods And Services (Current US$ BN) 8.2.4. Imports Of Goods And Services (Current US$ BN) 8.2.5. Gross National Disposable Income (US$ BN) 8.2.6. Manufacturing Output (US$ BN) 8.2.7. Consumer Price Index 8.2.8. Wholesale Price Index 8.2.9. LCU Per US$ (Period Average) 8.2.10. LCU Per Euro (Period Average) 8.2.11. Lending Rate (%) 8.2.12. Deposit Rate (%) 8.2.13. Real Interest Rate (%) 8.2.14. Market Capitalization Of Listed Companies (US$ BN) 8.2.15. Market Capitalization Of Listed Companies (% Of GDP) 8.2.16. Total Government Cash Surplus/Deficit (LCU Billion) 8.2.17. Government Cash Surplus/Deficit As A Percentage Of GDP (LCU) 8.2.18. Central Government Debt (LCU Billion) 8.2.19. Central Government Debt As A Percentage Of GDP (LCU) 8.2.20. Goods Exports As A Percentage Of GDP 8.2.21. Goods Imports As A Percentage Of GDP 8.2.22. Goods Balance As A Percentage Of GDP 8.2.23. Services Imports As A Percentage Of GDP 8.2.24. Service Exports As A Percentage Of GDP 8.2.25. Services Balance As A Percentage Of GDP 8.2.26. Foreign Direct Investment, Net (Bop, Current US$ Billions) 9 Appendix 9.1. About SDI 9.2. Disclaimer For more details contact Mr. Priyank Tiwari: sales@rnrmarketresearch.com / +18883915441 Website: http://www.rnrmarketresearch.com