SlideShare une entreprise Scribd logo
1  sur  1
Télécharger pour lire hors ligne
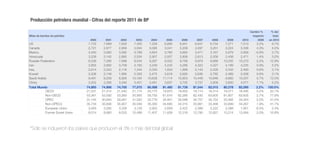
Producción petrolera mundial · Cifras del reporte 2011 de BP

                                                                                                                                                         Cambio %      % del
Miles de barriles de petróleo                                                                                                                              respecto      total
                                !     2000 !     2001 !     2002 !     2003 !     2004 !     2005 !     2006 !     2007 !     2008 !     2009 !     2010 !     2009   en 2010
US                                   7,733      7,669      7,626      7,400      7,228      6,895      6,841      6,847      6,734      7,271      7,513      3.2%      8.7%
Canada                               2,721      2,677      2,858      3,004      3,085      3,041      3,208      3,297      3,251      3,224      3,336      4.3%      4.2%
Mexico                               3,450      3,560      3,585      3,789      3,824      3,760      3,683      3,471      3,167      2,979      2,958     -0.8%      3.7%
Venezuela                            3,239      3,142      2,895      2,554      2,907      2,937      2,808      2,613      2,558      2,438      2,471      1.4%      3.2%
Russian Federation                   6,536      7,056      7,698      8,544      9,287      9,552      9,769      9,978      9,888     10,035     10,270      2.2%     12.9%
Iran                                 3,855      3,892      3,709      4,183      4,248      4,234      4,286      4,322      4,327      4,199      4,245      0.9%      5.2%
Iraq                                 2,614      2,523      2,116      1,344      2,030      1,833      1,999      2,143      2,428      2,442      2,460      0.6%      3.1%
Kuwait                               2,206      2,148      1,995      2,329      2,475      2,618      2,690      2,636      2,782      2,489      2,508      0.6%      3.1%
Saudi Arabia                         9,491      9,209      8,928     10,164     10,638     11,114     10,853     10,449     10,846      9,893     10,007      0.7%     12.0%
China                                3,252      3,306      3,346      3,401      3,481      3,637      3,705      3,737      3,809      3,800      4,071      7.1%      5.2%
Total Mundo                         74,893     74,906     74,700     77,075     80,568     81,485     81,729     81,544     82,015     80,278     82,095      2.2%    100.0%
          OECD                      21,531     21,314     21,440     21,174     20,775     19,870     19,463     19,114     18,414     18,471     18,490      0.2%     22.1%
          Non-OECD                  53,361     53,592     53,260     55,900     59,793     61,616     62,266     62,430     63,600     61,807     63,605      2.7%     77.9%
          OPEC                      31,145     30,640     29,261     31,020     33,776     34,951     35,098     34,757     35,722     33,365     34,324      2.5%     41.5%
          Non-OPEC‡                 35,734     35,606     35,907     35,556     35,385     34,695     34,315     33,991     33,466     33,699     34,287      1.9%     41.7%
          European Union             3,493      3,285      3,339      3,128      2,902      2,659      2,422      2,388      2,222      2,088      1,951     -6.5%      2.4%
          Former Soviet Union        8,014      8,660      9,533     10,499     11,407     11,839     12,316     12,795     12,827     13,214     13,484      2.0%     16.8%


*Sólo se incluyeron los países que producen el 3% o más del total global

Contenu connexe

Tendances

Tendances (9)

India and the world with bop and fiscal data
India and the world  with bop and fiscal dataIndia and the world  with bop and fiscal data
India and the world with bop and fiscal data
 
Nifty Summary
Nifty SummaryNifty Summary
Nifty Summary
 
Focus on growth hakuna matata
Focus on growth   hakuna matataFocus on growth   hakuna matata
Focus on growth hakuna matata
 
Finalaya daily wrap_03jan2013
Finalaya daily wrap_03jan2013Finalaya daily wrap_03jan2013
Finalaya daily wrap_03jan2013
 
Dünya yatırım haritası
Dünya yatırım haritasıDünya yatırım haritası
Dünya yatırım haritası
 
Rmls Data 1 22 08
Rmls Data 1 22 08Rmls Data 1 22 08
Rmls Data 1 22 08
 
Ex 8.
Ex 8.Ex 8.
Ex 8.
 
Daily report commodities
Daily report commodities Daily report commodities
Daily report commodities
 
Daily Report Commodities
Daily Report CommoditiesDaily Report Commodities
Daily Report Commodities
 

Similaire à Producción petrolera 2012

Ltn200804281069 C
Ltn200804281069 CLtn200804281069 C
Ltn200804281069 Cguest54ca90
 
Social growth 4.5
Social growth 4.5Social growth 4.5
Social growth 4.5Mike Lewis
 
Social growth 4.10
Social growth 4.10Social growth 4.10
Social growth 4.10Mike Lewis
 
Avance de crédito Infonavit al 9 sep-12
Avance de crédito Infonavit al 9 sep-12Avance de crédito Infonavit al 9 sep-12
Avance de crédito Infonavit al 9 sep-12Sergio Velazco
 
Avance de Crédito Infonavit al 08 julio 2012
Avance de Crédito Infonavit al 08 julio 2012Avance de Crédito Infonavit al 08 julio 2012
Avance de Crédito Infonavit al 08 julio 2012Sergio Velazco
 
Avance de crédito infonavit al 29 jul-12
Avance de crédito infonavit al 29 jul-12Avance de crédito infonavit al 29 jul-12
Avance de crédito infonavit al 29 jul-12Sergio Velazco
 
Tabela de conversao z-dpmo
Tabela de conversao   z-dpmoTabela de conversao   z-dpmo
Tabela de conversao z-dpmoHugo Oliveira
 
Avance crediticio al 22 julio 2012
Avance crediticio al 22 julio 2012Avance crediticio al 22 julio 2012
Avance crediticio al 22 julio 2012Sergio Velazco
 
Avance crediticio al 03 jun 12
Avance crediticio al 03 jun 12Avance crediticio al 03 jun 12
Avance crediticio al 03 jun 12Sergio Velazco
 
Avance crediticio al 24 junio 2012
Avance crediticio al 24 junio 2012Avance crediticio al 24 junio 2012
Avance crediticio al 24 junio 2012Sergio Velazco
 
Recap des résultats 2010 sociétés cotées
Recap des résultats 2010 sociétés cotéesRecap des résultats 2010 sociétés cotées
Recap des résultats 2010 sociétés cotéesIDIR2001
 
Recap des sociétés cotées
Recap des sociétés cotéesRecap des sociétés cotées
Recap des sociétés cotéesIDIR2001
 
Avance de Crédito Infonavit al 27 may 12
Avance de Crédito Infonavit al 27 may 12Avance de Crédito Infonavit al 27 may 12
Avance de Crédito Infonavit al 27 may 12Sergio Velazco
 
national oilwell varco Fourth Quarter 2008 Segmented Financial Data
national oilwell varco Fourth Quarter 2008 Segmented Financial Datanational oilwell varco Fourth Quarter 2008 Segmented Financial Data
national oilwell varco Fourth Quarter 2008 Segmented Financial Datafinance40
 
اثر اتفاقية اغادير على الميزان التجارى بين مصر ودول الاتفاقية
اثر اتفاقية اغادير على الميزان التجارى بين مصر ودول الاتفاقيةاثر اتفاقية اغادير على الميزان التجارى بين مصر ودول الاتفاقية
اثر اتفاقية اغادير على الميزان التجارى بين مصر ودول الاتفاقيةخالد سمير الهلالي
 
Fact sheet industry facts iata
Fact sheet industry facts   iataFact sheet industry facts   iata
Fact sheet industry facts iataprinci05
 
Table 8, mdg 8 partnership for development, low- & middle- income countries
Table 8, mdg 8  partnership for development, low- & middle- income countriesTable 8, mdg 8  partnership for development, low- & middle- income countries
Table 8, mdg 8 partnership for development, low- & middle- income countriesBread for the World
 

Similaire à Producción petrolera 2012 (20)

Ltn200804281069 C
Ltn200804281069 CLtn200804281069 C
Ltn200804281069 C
 
Social growth 4.5
Social growth 4.5Social growth 4.5
Social growth 4.5
 
Social growth 4.5
Social growth 4.5Social growth 4.5
Social growth 4.5
 
Social growth 4.10
Social growth 4.10Social growth 4.10
Social growth 4.10
 
Avance de crédito Infonavit al 9 sep-12
Avance de crédito Infonavit al 9 sep-12Avance de crédito Infonavit al 9 sep-12
Avance de crédito Infonavit al 9 sep-12
 
Avance de Crédito Infonavit al 08 julio 2012
Avance de Crédito Infonavit al 08 julio 2012Avance de Crédito Infonavit al 08 julio 2012
Avance de Crédito Infonavit al 08 julio 2012
 
Avance de crédito infonavit al 29 jul-12
Avance de crédito infonavit al 29 jul-12Avance de crédito infonavit al 29 jul-12
Avance de crédito infonavit al 29 jul-12
 
Tabela de conversao z-dpmo
Tabela de conversao   z-dpmoTabela de conversao   z-dpmo
Tabela de conversao z-dpmo
 
Avance crediticio al 22 julio 2012
Avance crediticio al 22 julio 2012Avance crediticio al 22 julio 2012
Avance crediticio al 22 julio 2012
 
Avance crediticio al 03 jun 12
Avance crediticio al 03 jun 12Avance crediticio al 03 jun 12
Avance crediticio al 03 jun 12
 
Avance crediticio al 24 junio 2012
Avance crediticio al 24 junio 2012Avance crediticio al 24 junio 2012
Avance crediticio al 24 junio 2012
 
Apimec – 2 q07 results
Apimec – 2 q07 resultsApimec – 2 q07 results
Apimec – 2 q07 results
 
Recap des résultats 2010 sociétés cotées
Recap des résultats 2010 sociétés cotéesRecap des résultats 2010 sociétés cotées
Recap des résultats 2010 sociétés cotées
 
Recap des sociétés cotées
Recap des sociétés cotéesRecap des sociétés cotées
Recap des sociétés cotées
 
Avance de Crédito Infonavit al 27 may 12
Avance de Crédito Infonavit al 27 may 12Avance de Crédito Infonavit al 27 may 12
Avance de Crédito Infonavit al 27 may 12
 
national oilwell varco Fourth Quarter 2008 Segmented Financial Data
national oilwell varco Fourth Quarter 2008 Segmented Financial Datanational oilwell varco Fourth Quarter 2008 Segmented Financial Data
national oilwell varco Fourth Quarter 2008 Segmented Financial Data
 
اثر اتفاقية اغادير على الميزان التجارى بين مصر ودول الاتفاقية
اثر اتفاقية اغادير على الميزان التجارى بين مصر ودول الاتفاقيةاثر اتفاقية اغادير على الميزان التجارى بين مصر ودول الاتفاقية
اثر اتفاقية اغادير على الميزان التجارى بين مصر ودول الاتفاقية
 
Fondos Recibidos Por Ayuntamientos 1999 2005 úLtimo
Fondos Recibidos Por Ayuntamientos 1999 2005 úLtimoFondos Recibidos Por Ayuntamientos 1999 2005 úLtimo
Fondos Recibidos Por Ayuntamientos 1999 2005 úLtimo
 
Fact sheet industry facts iata
Fact sheet industry facts   iataFact sheet industry facts   iata
Fact sheet industry facts iata
 
Table 8, mdg 8 partnership for development, low- & middle- income countries
Table 8, mdg 8  partnership for development, low- & middle- income countriesTable 8, mdg 8  partnership for development, low- & middle- income countries
Table 8, mdg 8 partnership for development, low- & middle- income countries
 

Producción petrolera 2012

  • 1. Producción petrolera mundial · Cifras del reporte 2011 de BP Cambio % % del Miles de barriles de petróleo respecto total ! 2000 ! 2001 ! 2002 ! 2003 ! 2004 ! 2005 ! 2006 ! 2007 ! 2008 ! 2009 ! 2010 ! 2009 en 2010 US 7,733 7,669 7,626 7,400 7,228 6,895 6,841 6,847 6,734 7,271 7,513 3.2% 8.7% Canada 2,721 2,677 2,858 3,004 3,085 3,041 3,208 3,297 3,251 3,224 3,336 4.3% 4.2% Mexico 3,450 3,560 3,585 3,789 3,824 3,760 3,683 3,471 3,167 2,979 2,958 -0.8% 3.7% Venezuela 3,239 3,142 2,895 2,554 2,907 2,937 2,808 2,613 2,558 2,438 2,471 1.4% 3.2% Russian Federation 6,536 7,056 7,698 8,544 9,287 9,552 9,769 9,978 9,888 10,035 10,270 2.2% 12.9% Iran 3,855 3,892 3,709 4,183 4,248 4,234 4,286 4,322 4,327 4,199 4,245 0.9% 5.2% Iraq 2,614 2,523 2,116 1,344 2,030 1,833 1,999 2,143 2,428 2,442 2,460 0.6% 3.1% Kuwait 2,206 2,148 1,995 2,329 2,475 2,618 2,690 2,636 2,782 2,489 2,508 0.6% 3.1% Saudi Arabia 9,491 9,209 8,928 10,164 10,638 11,114 10,853 10,449 10,846 9,893 10,007 0.7% 12.0% China 3,252 3,306 3,346 3,401 3,481 3,637 3,705 3,737 3,809 3,800 4,071 7.1% 5.2% Total Mundo 74,893 74,906 74,700 77,075 80,568 81,485 81,729 81,544 82,015 80,278 82,095 2.2% 100.0% OECD 21,531 21,314 21,440 21,174 20,775 19,870 19,463 19,114 18,414 18,471 18,490 0.2% 22.1% Non-OECD 53,361 53,592 53,260 55,900 59,793 61,616 62,266 62,430 63,600 61,807 63,605 2.7% 77.9% OPEC 31,145 30,640 29,261 31,020 33,776 34,951 35,098 34,757 35,722 33,365 34,324 2.5% 41.5% Non-OPEC‡ 35,734 35,606 35,907 35,556 35,385 34,695 34,315 33,991 33,466 33,699 34,287 1.9% 41.7% European Union 3,493 3,285 3,339 3,128 2,902 2,659 2,422 2,388 2,222 2,088 1,951 -6.5% 2.4% Former Soviet Union 8,014 8,660 9,533 10,499 11,407 11,839 12,316 12,795 12,827 13,214 13,484 2.0% 16.8% *Sólo se incluyeron los países que producen el 3% o más del total global