
Recommandé
Recommandé
Contenu connexe
Tendances
Tendances (10)
Similaire à Water Collected On Roof
Similaire à Water Collected On Roof (20)
Plus de J C
Plus de J C (20)
Dernier
Dernier (20)
Water Collected On Roof
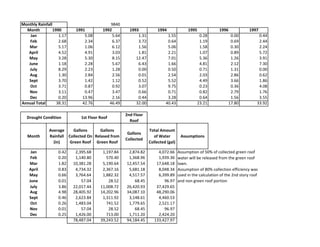
- 1. Monthly Rainfall 9840 Month 1990 1991 1992 1993 1994 1995 1996 1997 Jan 1.17 5.08 5.64 1.31 1.55 0.28 0.00 0.44 Feb 2.68 2.34 6.37 3.72 0.64 1.19 0.69 2.44 Mar 5.17 1.06 6.12 1.56 5.06 1.58 0.30 2.24 April 4.52 4.91 3.03 1.81 2.21 1.07 0.89 5.72 May 3.28 5.30 8.15 12.47 7.01 5.36 1.26 3.91 June 1.18 2.28 5.67 6.43 1.66 4.81 2.12 7.30 July 8.29 2.23 1.28 0.00 0.50 0.71 1.31 0.00 Aug 1.30 2.84 2.56 0.01 2.54 2.03 2.86 0.62 Sept 3.70 1.42 1.12 0.52 5.52 4.49 3.66 1.86 Oct 3.71 0.87 0.92 3.07 9.75 0.23 0.36 4.08 Nov 3.11 0.47 3.47 0.66 0.71 0.82 2.79 1.76 Dec 0.20 13.96 2.16 0.44 3.28 0.64 1.56 3.55 Annual Total 38.31 42.76 46.49 32.00 40.43 23.21 17.80 33.92 2nd Floor Drought Condition 1st Floor Roof Roof Average Gallons Gallons Total Amount Gallons Month Rainfall Collected On Relased from of Water Assumptions Collected (in) Green Roof Green Roof Collected (gal) Jan 0.42 2,395.68 1,197.84 2,874.82 4,072.66 Assumption of 50% of collected green roof Feb 0.20 1,140.80 570.40 1,368.96 1,939.36 water will be released from the green roof Mar 1.82 10,381.28 5,190.64 12,457.54 17,648.18 lawn. April 0.83 4,734.32 2,367.16 5,681.18 8,048.34 Assumption of 80% collection efficiency was May 0.66 3,764.64 1,882.32 4,517.57 6,399.89 used in the calculation of the 2nd story roof June 0.01 57.04 28.52 68.45 96.97 and non green roof portion July 3.86 22,017.44 11,008.72 26,420.93 37,429.65 Aug 4.98 28,405.92 14,202.96 34,087.10 48,290.06 Sept 0.46 2,623.84 1,311.92 3,148.61 4,460.53 Oct 0.26 1,483.04 741.52 1,779.65 2,521.17 Nov 0.01 57.04 28.52 68.45 96.97 Dec 0.25 1,426.00 713.00 1,711.20 2,424.20 78,487.04 39,243.52 94,184.45 133,427.97
- 2. 2nd Floor Excess Rain Condition 1st Floor Roof Roof Average Gallons Gallons Total Amount Gallons Month Rainfall Collected On Relased from of Water Assumptions Collected (in) Green Roof Green Roof Collected (gal) Jan 4.33 24,698.32 12,349.16 29,637.98 41,987.14 Assumption of 50% of collected green roof Feb 0.08 456.32 228.16 547.58 775.74 water will be released from the green roof Mar 7.24 41,296.96 20,648.48 49,556.35 70,204.83 lawn. April 4.61 26,295.44 13,147.72 31,554.53 44,702.25 Assumption of 80% collection efficiency was May 3.35 19,108.40 9,554.20 22,930.08 32,484.28 used in the calculation of the 2nd story roof June 6.47 36,904.88 18,452.44 44,285.86 62,738.30 and non green roof portion July 11.76 67,079.04 33,539.52 80,494.85 114,034.37 Aug 6.77 38,616.08 19,308.04 46,339.30 65,647.34 Sept 1.09 6,217.36 3,108.68 7,460.83 10,569.51 Oct 0.75 4,278.00 2,139.00 5,133.60 7,272.60 Nov 0.40 2,281.60 1,140.80 2,737.92 3,878.72 Dec 0.40 2,281.60 1,140.80 2,737.92 3,878.72 269,514.00 134,757.00 323,416.80 458,173.80
- 3. 2nd Floor Average Rain Condition 1st Floor Roof Roof Average Gallons Gallons Total Amount Gallons Month Rainfall Collected On Relased from of Water Assumptions Collected (in) Green Roof Green Roof Collected (gal) Jan 1.88 10,707.96 5,353.98 12,849.56 18,203.54 Assumption of 50% of collected green roof Feb 1.80 10,238.68 5,119.34 12,286.42 17,405.76 water will be released from the green roof Mar 2.48 14,117.40 7,058.70 16,940.88 23,999.58 lawn. April 2.28 12,999.93 6,499.97 15,599.92 22,099.89 Assumption of 80% collection efficiency was May 3.54 20,166.23 10,083.12 24,199.48 34,282.60 used in the calculation of the 2nd story roof June 3.44 19,619.17 9,809.58 23,543.00 33,352.58 and non green roof portion July 3.05 17,389.42 8,694.71 20,867.31 29,562.02 Aug 2.25 12,859.93 6,429.96 15,431.91 21,861.88 Sept 3.38 19,305.45 9,652.72 23,166.54 32,819.26 Oct 4.09 23,342.32 11,671.16 28,010.79 39,681.95 Nov 2.16 12,331.01 6,165.51 14,797.21 20,962.72 Dec 1.95 11,148.73 5,574.36 13,378.47 18,952.84 184,226.24 92,113.12 221,071.48 313,184.60
- 4. 1998 1999 2000 2001 2002 2003 2004 2005 2006 2007 2008 2009 3.21 0.04 1.40 2.85 0.37 0.99 2.31 2.18 0.35 4.33 0.42 0.27 3.37 0.01 2.20 0.70 0.42 2.15 1.73 2.42 0.62 0.08 0.20 0.65 2.85 3.48 0.91 2.77 1.19 0.77 2.36 2.00 1.36 7.24 1.82 2.51 0.05 0.91 1.22 2.29 3.82 0.17 5.02 0.01 1.40 4.61 0.83 2.05 0.34 2.78 3.59 2.48 2.26 0.12 1.80 2.97 3.80 3.35 0.66 1.57 0.81 3.37 7.61 3.39 1.48 2.90 9.47 0.81 1.63 6.47 0.01 0.45 0.21 1.80 0.34 0.50 16.92 8.12 0.61 2.10 1.41 11.76 3.86 0.48 7.78 2.11 0.16 7.83 0.54 1.65 1.10 1.22 0.03 6.77 4.98 0.45 1.57 0.05 2.65 4.05 7.02 9.21 1.92 1.39 4.11 1.09 0.46 6.35 18.07 1.29 5.62 2.07 7.64 1.94 9.47 1.14 3.44 0.75 0.26 11.90 3.40 0.05 8.58 4.36 2.08 0.32 9.46 0.20 0.75 0.40 0.01 2.09 0.39 0.52 1.57 3.43 2.53 0.11 0.08 0.10 2.44 0.40 0.25 1.92 42.05 16.41 35.85 36.72 46.27 28.45 45.33 16.54 21.34 47.25 13.76 30.69
- 5. 2010 2011 Average 4.45 2.66 1.88 4.38 0.49 1.80 2.09 0.01 2.48 3.57 0.03 2.28 4.48 0.84 3.54 4.24 1.58 3.44 3.68 0.96 3.05 0.07 0.15 2.25 9.37 2.93 3.38 0.17 3.28 4.09 0.26 1.81 2.16 0.63 2.84 1.95 37.39 17.58 31.47