
Recommandé
Recommandé
Contenu connexe
Tendances
Tendances (17)
Similaire à Race and Ethnicity in America: Disparities in Income, Education, Employment
Similaire à Race and Ethnicity in America: Disparities in Income, Education, Employment (20)
Plus de jdubrow2000
Plus de jdubrow2000 (20)
Race and Ethnicity in America: Disparities in Income, Education, Employment
- 1. Race and Ethnicity in Contemporary American Society Selected sources of information: Dąbrowska,Joanna. 2009. Black Leaders’ Solutions to Racial Tension in America: A Comparison of Public Speeches by Malcolm X and Barack Hussein Obama . Masters Thesis, American Studies Center, University of Warsaw. Feagin, Joe. 1991. "The Continuing Significance of Race: Antiblack Discrimination in Public Places." American Sociological Review 56: 101-116. Hochschild, Jennifer and Vesla Mae Weaver. 2010. “’There’s No One as Irish as Barack O’Bama’: The Policy and Politics of American Multiracialism.” Perspectives on Politics 8(3): 737 – 759. (hereafter H&W) Obama, Barack. 1995. Dreams from My Father . Chapter 4. Wright, Lawrence. 1994. "One Drop of Blood." The New Yorker , July 24. Zinn, Howard. 2003. “Chapter 7: As Long as Grass Grows or Water Runs,” pp. 125 - 148 in A People’s History of the United States . New York: Harper Perennial.
- 2. Sociology : the scientific study of human social life in all its aspects. Social Structure = A general term for any collective social circumstance that is unalterable and given for the individual. They are enduring patterns of behavior that set limits on thought and action and cannot be changed by any individual will (Abercrombie et al 1994: 391; Rytina 1997).
- 3. R a c e Race = A category of persons who are identified by themselves and by others as having a socially meaningful distinctiveness that rests on biological criteria.
- 4. Sociologically, race is considered to be socially constructed, though it is clear people differ in terms of their physiognomic traits. Racial groups are viewed as biological groups because of how they look, and are aggregated into racial groups by social and political processes. H&W examine how political institutions and organizations combine with social phenomena (including demographic shifts) to create three types of official racial classification systems: those that are created, those that stay the same, and those that end. H&W examine the reasons for how each type emerges, including (a) a constituency inside the government that has enough political influence to call for change, or stop a classification from emerging, (b) a constituency outside of the government that can pressure the political system.
- 6. September 11, 2001 changed how Americans view Muslims and Arabs and radically changed U.S. political discourse
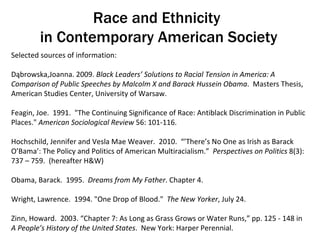
- 7. How Some of Obama’s Detractors Attempted to Portray Obama: Barack Hussein Obama The Truth about Barack Hussein Obama is:
- 8. H&W find that “multiracialism,” having one or more racial markers, has been politically institutionalized. Multiracialism became institutionalized because of “facts on the ground,” i.e. a demographic shift and from the intellectual movement of multiculturalism. Yet, the overall incidence of reported multiracialism among individuals is very small; it is smallest among whites, and greatest among Native Americans. It also does not have many or strong advocacy organizations that act on their behalf. H&W argue that although multiracialism has been politically institutionalized, it has not become an “identity.” People do not feel strong ties to their “multiracial” identity. They are more likely than others to view race as socially constructed and context dependent.
- 9. Racism = An elaborate ideology holding that one race is biologically superior and that all others are biologically inferior to it. This doctrine regards the unequal economic and social positions of different races as the outcome of their genetic differences. “ New Racism ” supplants “cultural” for “biological” in the above definition. See also Ethnic Hatred, Xenophobia
- 10. From U.S. Census Data http://www.census.gov/compendia/statab/cats/income_expenditures_poverty_wealth/household_income.html and http://www.census.gov/compendia/statab/cats/income_expenditures_poverty_wealth.html Racial and Ethnic Disparities in the U.S. (200 8 ) Median Income and Mean Income ( in 2008 dollars) Below Poverty Level (%) White non-Hispanic Median: 55,530 Mean: 74,102 8.6 Black (alone or in combination) Median: 34,345 Mean: 46,679 24.6 Hispanic (any race) Median: 37,913 Mean: 51,572 23.2
- 12. Percent Completed High School 1993 – 2007 by Race From Table A.2 http://www.census.gov/population/www/socdemo/education/cps2007.html
- 13. Unemployment Rate by Level of Education by Race in 2009 Source: U.S. Bureau of Labor Statistics http://www.bls.gov/cps/cpsrace2009.pdf Less than High School High School Degree BA Degree and Up All Races 14.6 9.7 4.6 White 13.9 9 4.2 Men 14 10.2 4.4 Women 13.7 7.4 4 Black 21.3 14 7.3 Men 23.9 16.2 8.2 Women 18.6 11.5 6.7
- 14. Percent in Selected Occupations by Race in 2009 Source: U.S. Bureau of Labor Statistics http://www.bls.gov/cps/cpsrace2009.pdf Management, professional and related Production, transportation, and material moving All 37.3 11.4 White 38 11.1 Men 35 16.5 Women 41.4 4.9 Black 29.2 14.3 Men 23.8 24 Women 33.7 6.2 Hispanic 19.4 17.1 Men 15.9 22.2 Women 24.6 9.8
- 15. Median usual weekly earnings ($) of full-time wage and salary workers by selected occupation and race in 2009 Source: U.S. Bureau of Labor Statistics http://www.bls.gov/cps/cpsrace2009.pdf Management, professional and related Production, transportation, and material moving All 1044 605 White 1061 618 Men 1266 666 Women 913 477 Black 905 540 Men 922 582 Women 800 453 Hispanic 926 485 Men 1017 516 Women 774 374
- 16. U.S. Census: Income, Poverty and Health Insurance 2009 Report http://www.census.gov/prod/2010pubs/p60-238.pdf Who Does Not Have Health Insurance in the United States? 2009 No Health Insurance % All races 16.7 White non-Hispanic 12 Black 21 Hispanic (any race) 32.4
- 17. From the Civil Rights era to the 21 st Century: The Question of Progress 1960 2000 Blacks Whites Blacks Whites Population (%) 10.9 87.6 12.3 75.1 College Education % of population (25-34) who completed 4 years of college or more / obtained bachelor’s degree or more 5.7 14.6 14.3 26.1 Median income (dollars) 3,886 7,251 33,916 54,920 Below Poverty Level (%) 41.8 11.3 24.5 8.2