
Recommandé
Recommandé
Contenu connexe
Similaire à Running Head: SUN COAST HEALTH 2Evaluating Health and Safety at Sun Coast: A Quantitative Analysis
Similaire à Running Head: SUN COAST HEALTH 2Evaluating Health and Safety at Sun Coast: A Quantitative Analysis (20)
Plus de jeanettehully
Plus de jeanettehully (20)
Dernier
Dernier (20)
Running Head: SUN COAST HEALTH 2Evaluating Health and Safety at Sun Coast: A Quantitative Analysis
- 1. Running head: RESEARCH METHODOLOGY, DESIGN AND METHODS 1 RESEARCH METHODOLOGY, DESIGN AND METHODS 5 Insert Title Here Insert Your Name Here Insert University Here Research Methodology, Design, and Methods Research methodology refers to the precise procedures that researchers select base on the chosen design. Details of how data is collected and analyzed is presented here. The research that led to the achievement of Sun Coast objectives was done using quantitative research methods since they offer detailed insights pertaining to the study. Research design is the specific type of study that one would conduct and is usually consistent with one’s philosophical worldview and the methodological approach the researcher chooses (Creswell & Creswell, 2018). This study seeks to evaluate the research methodology, design, and methods used in researching the concerns in Sun Coast leadership in business context. Research Methodology This research needed to involve much details from the respondents and data collected. Hence, quantitative research methodology was chosen. For instance, Sun Coast leadership and other business contexts involved numbers which needed to be analyzed in details rendering Research Design
- 2. The research design employed in this research was causal one based on various reasons. Firstly, this design is quantitative in nature and it is also preplanned in design (Creswell & Creswell, 2018). Hence, it is considered as a conclusive research which is in line with Sun Coast where leadership trend was monitored against its business performance. Also, researching the performance of this organization required an explanation off cause and effect relationships that variables have. Hence, causal research design would aid in understanding the variables that causative and those which acts as effects of leadership and performance noted in Sun Coast. Research Methods This research applied the causal-comparative research methods which was sometimes combined with the descriptive statistics one (Creswell & Creswell, 2018). The former was used to find the relationship between dependent and independent variables after the occurrence of any action in Sun Coast. For instance, this method was useful in determining whether the independent or dependent variable affected the outcome through comparison of at least 2 groups of data collected. On the other hand, Sun Coast’s leadership and other business objectives could render descriptive statistics significant since the researchers could use the past figures to analyze the current ones and make a sound forecast of future organizational performance. Hence, the two research methods was sometimes combined to get a more credible conclusion based on data at hand. Data Collection Methods Different data collection methods including surveys, observation, and interviews were used to test each hypothesis (Creswell & Creswell, 2018). Observation was used for real life situations where pertinent happenings were then recorded. This data collection method were used in testing the hypotheses, ‘the blood lead levels have increased considering the sampled employees.’ Surveying was done to analyze the distributed data and come up with a logical conclusion. This method was used to
- 3. test the hypotheses such as, the statistical relationship between the PM size and the worker’s health and the difference between return on investment exist considering four lines of service that Sun Coast offers to their customers. Interviews involved taking the respondents’ opinions pertaining to the research questions developed (Creswell & Creswell, 2018). This method was used to test the hypothesis, the efficiency of the revised programs compared to the prior training one. Sampling Design The sampling design that was most likely used for this research was the stratified one which involved dividing populations in Sun Coast into groups based on factors such as those who attended revised training versus those who did not among other groups. After developing groups, a probability sample was then selected and grouped into strata based on their positions in Sun Coast and what they believe in terms of leadership. Data Analysis Procedures Correlation is the preferred procedure to use to test the RQ1 hypotheses since the interest is whether a relationship exists between an independent variable (IV) and dependent variable (DV). Correlation will indicate if there is a relationship between PM size (IV) and the employee health (DV) and the magnitude of that impact if at all there is one. Correlation is also appropriate in testing the RQ2 since the question aims to learn the relationship between training about health and safety and time wasted in attending the services. This procedure will indicate the relationship between the two variables considering that the latter is a DV while its former counterpart is independent. Regression analysis procedure would be appropriate for RQ3 since the variable, DB levels of work would be predicted before placing employees on-site for future contracts. There is no independent sample among those provided by this RQ. ANOVA procedure would be suitable for testing RQ4 and RQ5 since the variables in the two research questions are non-directional. The former tests the efficiency between two groups of employees
- 4. while the latter tests the blood sugar levels among the chosen employees. References Creswell, J. W., & Creswell, J. D. (2018). Research design: Qualitative, quantitative, and mixed methods approaches (5th ed.). Thousand Oaks, CA: Sage. Smart Tree A Solar tree is a decorative means of producing solar energy and also electricity. It uses multiple no of solar panels which forms the shape of a tree. The panels are arranged in a tree fashion in a tall tower/pole. At the top of the pole will be a CCTV, around the tree will be Thermal/ Humidity sensors to detect the temperature in the surroundings. To the Power output battery there will be smart wireless switches connected. Topic is about the Smart Tree (Solar Tree) Which is my Implementation time now. The Smart Tree has few features like: · CCTV. · IoT smart Wireless switch. · Thermal & Humidity Sensor. a. CCTV for security purpose storing the data and can view the recordings. b. IoT smart switch is about the tree which will be capable of controlling the surrounding temperatures like automatically switching on the sprinklers around and cool the surroundings until the temperature is decreased. So, this tree also keeps the CCTV footage for safety issues.
- 5. It can also store the Temperature log throughout so that to turn the sprinklers on by itself. 1. Introduction Smart Tree (Solar Tree) · Background (A bit of work on the smart tree similar background) · Aim of Research / Problem Formulation · Approach of Research · Objectives (What should be the objectives) · Scope of Research. 2. Literature Review · How smart tree is useful ion the community. · What are the advantages? · Comparison of another tree with ours. · Countermeasures. 3. Chapter covering approach 4. Analysis and Discussion · Design · Uses in University. · Environment conditions. · Framework. · Results. 5. Conclusion. 6. Future Works. Word Count is 3,500. Running Head: SUN COAST HEALTH 2 SUN COAST HEALTH 2 Sun Coast Health By
- 6. Name Date Table of Contents CHAPTER ONE 5 1.1 Introduction 5 1.2 Statement of the Problems/Dilemmas 5 1.2.1 Particulate Matter (PM) 5 1.2.2 Safety Training Effectiveness 6 1.2.3 Sound-Level Exposure 6 1.2.4 New Employee Training 6 1.2.5 Lead Exposure7 1.2.6 Return-On-Investment 7 1.3 Research Objectives 7 1.4 Research Questions and Hypotheses 8 CHAPTER TWO 11 2.1 Literature Review 11 2.2 Conceptual framework 11 CHAPTER THREE 12 RESEARCH METHODOLOGY, DESIGN, AND METHODS 12 3.1 Introduction 12 3.2 Research Design 12 3.3 Research Methods 13 3.4 Data Collection Methods 13 3.5 Sampling Design 13 3.6 Questionnaires 13 3.7 Data Analysis Procedures 14
- 7. 3.8 Data Analysis 14 3.8.1 Correlation Analysis 15 3.8.2 Simple Regression Analysis 16 3.8.3 Multiple Regression Analysis 17 3.8.4 Independent Samples t Test 18 3.8.5 Paired Samples t Test 18 3.8.6 One-Way ANOVA 19 CHAPTER FOUR 20 RESEARCH FINDINGS AND DISCUSSIONS 20 4.1 Introduction 20 4.2 Summary of key findings 20 CHAPTER FIVE 21 SUMMARY CONCLUSION AND RECOMMENDATION 21 5.0 Introduction 21 5.1 Recommendations 22 5.2 Conclusion 22 5.3 Suggestion for Further research 23 References 24 CHAPTER ONE1.1 Introduction Senior leadership at Sun Coast has identified several areas for concern that they believe could be solved using business research methods. The previous director was tasked with conducting research to help provide information to make decisions about these issues. Although data were collected, the
- 8. project was never completed (Creswell & Creswell, 2018). Senior leadership is interested in seeing the project through to fruition. The following is the completion of that project, and includes statement of the dilemmas, literature review, purpose statements, research methodology, design, and methods, research questions and hypotheses, data analysis, and findings. 1.2 Statement of the Problems/Dilemmas 1.2.1 Particulate Matter (PM) There is a concern that job-site particle pollution is adversely impacting employee health. Although respirators are required in certain environments, particulate matter (PM) varies in size depending on the project and job site. PM between 10 and 2.5 microns can float in the air for minutes to hours (e.g. asbestos, mold spores, pollen, cement dust, fly ash), while PM less than 2.5 microns can float in the air for hours to weeks (e.g. bacteria, viruses, oil smoke, smog, soot) (Ferreira, 2011). Due to the smaller size of PM less than 2.5 microns, it is potentially more harmful than PM between 10 and 2.5 since the conditions are more suitable for inhalation. PM less than 2.5 are also able to be inhaled into the deeper regions of the lungs, potentially causing more deleterious health effects. It would be helpful to understand if there is a relationship between PM size and employee health. Air quality data have been collected from 103 job sites, which is reflected in PM size. Data is also available for average annual sick days per employee per jobsite. 1.2.2 Safety Training Effectiveness Health and Safety training is conducted for each new contract that is awarded to Sun Coast. Data for training expenditures and lost-time hours were collected from 223 contracts. It would be valuable to know if training has been successful in reducing lost-time hours and, if so, how to predict lost-time hours from training expenditures (Wang et al., 2009). 1.2.3 Sound-Level Exposure
- 9. Sun Coast’s contracts generally involve work in noisy environments due to a variety of heavy equipment being used for both remediation and the clients’ ongoing operations on the job sites. Standard earplugs are adequate to protect employee hearing if the decibel levels are less than 120 decibels (dB) (Creswell & Creswell, 2018). For environments with noise- levels exceeding 120 dB, more advanced and expensive hearing protection is required, such as ear-muffs (Ferreira, 2011). Data have been collected for the primary variables that are believed to contribute to excessive noise. It would be important if these data could be used to predict the dB levels of work environments before placing employees on site. 1.2.4 New Employee Training All new Sun Coast employees participate in general health and safety training. The training program was revamped and implemented six months ago. Data is available for two Groups; a) Group A employees who participated in the previous training program, and b) Group B employees who participated in the revised training program. It is necessary to know if the revised training program is more effective than the prior training program. 1.2.5 Lead Exposure Employees working on job sites to remediate lead must be monitored. Lead levels in blood are measured as micrograms of lead per deciliter of blood (μg/dL). A base-line is taken pre- exposure, then post-exposure at regular intervals, and at the conclusion of the remediation (Ferreira, 2011). Data are available for 49 employees who recently concluded a two-year- long lead remediation project. It is necessary to determine if blood lead levels have increased. 1.2.6 Return-On-Investment Sun Coast would like to know if all lines of service provide the
- 10. same return-on-investment. Return-on-investment data is available for air monitoring, soil remediation, water reclamation, and health and safety training. If return-on- investment is not the same for all lines of service, it would be helpful to know were differences exist (Ferreira, 2011). 1.3 Research Objectives Sun Coast has identified several areas for concern that they believe could be solved using business research methods. The previous director was tasked with conducting research to help provide information to make decisions about these issues. Although data were collected, the project was never completed (Creswell & Creswell, 2018). Senior leadership is interested in seeing the project through to fruition. The organization seek to achieve the objectives highlighted below in its endeavor to promote effective leadership and efficiency of service provision i) To determine the relationship between Particulate Matter (PM) size and employee health. ii) To evaluate if training has been successful in reducing lost- time hours and, if so, how to predict lost-time hours from training expenditures. iii) To employ the historical data from 1,530 contracts to predict the decibels (DB) levels of work environments before placing employees on-site for future contracts, iv) To evaluate whether the revised program is more effective than the prior training program based on the two groups of employees, A and B who participated in the prior training program and in the revised training programs respectively v) To determine if blood lead levels have increased based on 49 employees who recently concluded a 2-year lead remediation project vi) To evaluate where the difference between return on investment exist considering four lines of service that Sun Coast offers to their customers including air monitoring, soil remediation, water reclamation, and health and safety training.1.4 Research Questions and Hypotheses Sun Coast faces different business problems which need to be
- 11. addressed as one means of promoting its endeavor to achieve both short- and long-term goals. The research questions will help the researchers is designing an appropriate research process that will lead to a credible conclusion to the problem (Creswell, & Creswell, 2018). On the hand, both null and alternative hypotheses will enable the researchers to determine the possible outcome based on the research problem. i) Is there a relationship between Particulate Matter (PM) size and employee health? H0: PM that is less than 2.5 microns is potentially more harmful than PM that is between 10 and 2.5 H1: There is no statistical relationship between the PM size and the worker’s health. ii) Has health and safety training successful in reduced lost-time hours and, if so, how to can lost-time be predicted? H0: There is no statistical relationship between health and safety training and lost time. H1: Health and safety training has successfully limited lost- time hours and the lost time can be predicted based on current performance iii) Can (DB) levels of work environments be predicted before placing employees on-site for future contracts? H0: The standard earplugs are adequate to protect employee hearing if the decibel levels are less than 120 decibels (dB). H1: It is difficult to predict the DB levels since there is no statistical link to it iv) Which program is more effective between two groups of employees, A and B prior training and during the revised training respectively? H0: The program is more efficient with the revised programs than the prior training one. H1: The program is more efficient with the one prior training than revised one v) Has the blood lead levels have increased based on 49
- 12. employees who recently concluded a 2-year lead remediation project.? H0: The blood lead levels have increased considering the sampled employees. H1: The blood sugar of the employees was maintained upon completion of a 2-year old lead remediation project. vi) Is there a difference between return on investment exist considering four lines of service that Sun Coast offers to their customers? H0: There is a difference between the return on investment H1: there is no statistical provision justifying the relationship between the four lines of service that Sun Coast offers to their customers CHAPTER TWO2.1 Literature Review This chapter covered a review of literature to the study. The chapter covered the following: theoretical and empirical literature leading to this study’s conceptual framework, accrual theory of accounting, trade credit theory and agency theory. It is after this evaluation that a literature gap is identified at the
- 13. end of this chapter with Sun Coast employee’s performance.2.2 Conceptual framework CHAPTER THREERESEARCH METHODOLOGY, DESIGN, AND METHODS3.1 Introduction This chapter dealt with research design, location of the study, target population, sample size, sampling procedures, research instruments, instrument reliability, instrument validity, and data collection procedures and data analysis techniques. A discussion of each aspect of the research methodology was given hereunder, beginning with research design3.2 Research Design The study used descriptive survey design combining both qualitative and quantitative research strategies. The researcher mainly employed descriptive correlation design, quantitative approaches to get a clear knowledge and level of time losses, employees health and training effect on Sun Coast employees. Descriptive correlation design was an appropriate design preferred by the researcher as it aim at establishing relationships between dependent and independent variables through quantifiable results (Wang et al., 2009). Descriptive studies are regarded as non-experimental studies that are used to describe characteristic of a certain individual or group under study.it focuses on identifying association between variables and formulating hypothesis upon making valid decisions and conclusions after the findings. 3.3 Research Methods Describe the research methods that will be used for this research study. They may include survey, observation, experimentation, descriptive, correlation, or causal comparative. 3.4 Data Collection Methods The researcher used both primary and secondary data to
- 14. complete this research. Primary data was collected through surveys and sampling techniques among Sun Coast employees (Wang et al., 2009). Sampling is the act, process or technique of selecting a suitable sample or representative part of a population for the purpose of determining parameters or characteristics of the whole population. A simple random sampling was used in our survey where 103 job sites employee,49 trained employees were used . Secondary data were obtained from different financial data listed in 1,530 contracts information records on performance of the employees.3.5 Sampling Design Students should briefly describe the type of sampling design that was most likely used for the data that were collected. Choices include, but are not limited to, random sample, convenience sample, etc. Explain your rationale for your sampling design selection(s). 3.6 Questionnaires The researcher developed the questioners to enable him to collect data from the selected employees and employers of Sun Coast. The aim of the questionnaires was to obtain the primary data from the various employees on site in order to tap more information from those who experienced health problems among other employees. The respondents were instructed to answer all questions in the questionnaire. The respondents were giving a maximum of five days to understand the questionnaire and fill all the fields. upon collection of the questionnaires from the employee’s researcher and his assistant ensured that all questionnaires had been answered3.7 Data Analysis Procedures After the administration of the questionnaires the data gathered was organized, collected, and encoded into the computer and statistically treated using the MS-Excel. The researcher ran descriptive statistics analysis based on frequency tables and percentages based on the data collected (Creswell & Creswell, 2018). Both descriptive and inferential statistics were used in the study where with respect to descriptive statistics, mean, standard deviation and coefficient of variation were used to
- 15. establish core relationships between response variables in Sun Coast management where null hypothesis for different research questions was assessed against alternative hypothesis which stated at least one was different. To ascertain the hypothesis the researcher performed one-way and two- way ANOVA. The researcher also performed F-tests to obtain critical values for the test parameters. For inferential statistics the researcher performed regression analysis where dependent variable were Heath and ROI while (lost time, revised trainings, resources such as air: water and soil, safety trainings e.t.c) were treated as independent variables 3.8 Data Analysis Details of how data is collected and analyzed is presented here. The research that led to the achievement of Sun Coast objectives was done using quantitative research methods since they offer detailed insights pertaining to the study (Creswell & Creswell, 2018). Research design is the specific type of study that one would conduct and is usually consistent with one’s philosophical worldview and the methodological approach the researcher chooses 3.8.1 Correlation Analysis microns mean annual sick days per employee microns 1 mean annual sick days per employee -0.71598 1 From the above correlation analysis Pearson correlation coefficient value between the test variables is negative value=-
- 16. 0.71598 indicating that when one variable increases the effect on other variable decreases (Wang et al., 2009). We accept alternative hypothesis and conclude that There is no statistical relationship between the PM size and the worker’s health. 3.8.2 Simple Regression Analysis Model Safety training=1753.602-6.157*lost time hours From the above simple regression output since we have one independent variable, we will pay attention to R square=0.8827 which shows high significance between the response variable and predictor variable (Wang et al., 2009). We reject null hypothesis and conclude that Health and safety training has successfully limited lost-time hours and the lost time can be predicted based on current performance 3.8.3 Multiple Regression Analysis Model Frequency (HZ) =32243.94-86.45*Angles in degrees- 741.55*chord length+42.06*velocity-65093.43*Displacemet- 241.1097*Decibel Since it is a multi-regression analysis we focus on adjusted R- squared=0.3385 which indicates low relationship between the response and predictor variables taken as a pair (Wang et al.,
- 17. 2009). we reject null hypothesis and conclude that the standard earplugs are adequate to protect employee hearing if the decibel levels are less than 120 decibels (dB). 3.8.4 Independent Samples t Test From the above sample t test output, we can see that t-statistic is=-9.666 <1.9876 critical t value hence we do not reject null hypothesis. we conclude that It is difficult to predict the DB levels since there is no statistical link (Wang et al., 2009). 3.8.5 Paired Samples t Test From the output above t-statistic=1.9298>1.6777 critical value hence we reject null hypothesis and conclude that the program is more efficient with the revised programs than the prior training one. 3.8.6 One-Way ANOVA Anova: Single Factor
- 18. SUMMARY Groups Count Sum Average Variance A = Air 20 178 8.9 9.357895 B = Soil 20 182 9.1 3.042105 C = Water 20 140 7 6.631579
- 19. D = Training 20 108 5.4 1.410526 ANOVA Source of Variation SS df MS F P-value F crit Between Groups
- 20. 182.8 3 60.93333333 11.9231 1.76E-06 2.724944 Within Groups 388.4 76 5.110526316 Total 571.2 79 ANOVA output above illustrate that P-value=0.00000176<0.05 hence it is statistically significant. F-value=11.9231>critical F- value=2.72494 hence we reject null hypothesis and conclude that There is a difference between the return on investment CHAPTER FOURRESEARCH FINDINGS AND DISCUSSIONS4.1 Introduction This chapter presents analysis of the data on the effectof proper
- 21. health and safety measures on employees’ performance in Sun coast company (Wang et al., 2009). The chapter also provides the major findings and results of the study and discuss those finding and results against employee’s health and work output. This was mainly performed from data obtained from questionnaires.4.2 Summary of key findings The study found different findings based on different response and predictor variables. · Based on particulate matter size and employee’s heath with regards to the sample dataset of 103 job sites it was evident that is no statistical relationship between the PM size and the worker’s health. · Based on safety training expenditure our study showed that Health and safety training has successfully limited lost-time hours and the lost time can be predicted based on current performance. The more training was conducted the lesser the lost time experienced. · Based on sound level exposure our research showed that standard earplugs are adequate to protect employee hearing if the decibel levels are less than 120 decibels (dB). For environments with noise-levels exceeding 120 dB, more advanced and expensive hearing protection is required, such as earmuffs · Based on employees training the study established that the revised training program is more effective than the prior training program. · Based on lead exposure, our made us believe that It is necessary to determine if blood lead levels have increased through cross check monitoring. · Based on ROI as an indicator for Sun coast profitability metric we found that investment is not the same for all lines of service i.e. soil, air and water. CHAPTER FIVESUMMARY CONCLUSION AND
- 22. RECOMMENDATION5.0 Introduction The chapter provides the summary of the findings from chapter four, and it also gives the conclusion and recommendation of the study based on the objectives of the study (Creswell & Creswell, 2018). 5.1 Recommendations The study recommended that · Employees should not pay much attention to PM size in refence to their heath rather they should focus on establish proper measures to evade themselves from inhaling the particles e.g. by wearing nose masks while on site for their health. · More safety training should be exercised as their significantly reduce lost time hours. · Employees on noisy sites are recommended to have earplugs to prevent ear damage and other hearing problems. · Newly employed employees should be scheduled frequent revised trainings in order to equip them with new and efficient skills. 5.2 Conclusion Based on the above findings employees on site should have proper gears to prevent themselves from PM inhaling’s, Frequent revised trainings on newly contracted employees were necessary, Sun Coast management should mainly focus on the utility which gains higher return on investment, Safety trainings should be highly advocated to reduce lost times. 5.3 Suggestion for Further research A similar research could be carried out among other industries in the same category as sun Coast in order to find out whether the same results will be obtained so as to allow generalization of the results. References Creswell, J. W., & Creswell, J. D. (2018). Research design: Qualitative, quantitative, and mixed methods approaches (5th ed.). Thousand Oaks, CA: Sage. Ferreira, D. F. (2011). Sisvar: a computer statistical analysis
- 23. system. Ciência e agrotecnologia, 35(6), 1039-1042. Wang, Y. Q., Zhang, X. Y., & Draxler, R. R. (2009). TrajStat: GIS-based software that uses various trajectory statistical analysis methods to identify potential sources from long-term air pollution measurement data. Environmental Modelling and Software, 24(8), 938-939. Return-On-Investment Particulate Matter (PM) Lead Exposure Safety Training Effectiveness New Employee Training SUMMARY OUTPUT Regression Statistics Multiple R0.939559324 R Square0.882771723 Adjusted R Square0.882241279 Standard Error161.302987 Observations223 ANOVA dfSSMSFSignificance F Regression143300521.43433005211664.2117.6586E-105 Residual2215750122.45126018.65 Total22249050643.88 CoefficientsStandard Errort StatP-valueLower 95%Upper 95%Lower 95.0%Upper 95.0%
- 24. Intercept1753.60213330.3629622357.754652.6E- 1351693.7641351813.4401321693.7641813.440132 lost time hours-6.1573943650.150935993-40.79477.7E-105- 6.45485242-5.85993631-6.45485-5.85993631 SUMMARY OUTPUT Regression Statistics Multiple R0.583706496 R Square0.340713274 Adjusted R Square0.338511248 Standard Error2564.049485 Observations1503 ANOVA dfSSMSFSignificance F Regression55.09E+091017230383154.72714711.2E-132 Residual14979.84E+096574349.763 Total15021.49E+10 CoefficientsStandard Errort StatP-valueLower 95%Upper 95%Lower 95.0%Upper 95.0% Intercept32243.941721307.24124.665647385.2672E- 11329679.7234808.159929679.7235334808.1599 Angle in Degrees-86.4596200717.19892-5.0270363735.58105E- 07-120.196-52.72307055-120.1961696-52.72307055 Chord Length-741.55591911361.862-0.5445163360.586167308- 3412.921929.803715-3412.9155541929.803715 Velocity (Meters per Second)42.060937514.2998949.7818547396.02337E- 2233.6264850.4953940833.6264809450.49539408 Displacement-65093.432458026.09-8.110229811.0415E-15- 80837-49349.85665-80837.00825-49349.85665 Decibel-241.109719210.26503-23.488460424.0652E-104- 261.245-220.974353-261.2450855-220.974353 t-Test: Two-Sample Assuming Unequal Variances Group A Prior Training ScoresGroup B Revised Training Scores Mean69.7903225884.77419355 Variance122.00449526.96456901 Observations6262
- 25. Hypothesized Mean Difference0 df87 t Stat-9.666557191 P(T<=t) one-tail9.69914E-16 t Critical one-tail1.662557349 P(T<=t) two-tail1.93983E-15 t Critical two-tail1.987608282 t-Test: Paired Two Sample for Means Post-Exposure μg/dLPre-Exposure μg/dL Mean33.2857142932.85714286 Variance155.5150.4583333 Observations4949 Pearson Correlation0.992236043 Hypothesized Mean Difference0 df48 t Stat1.929802563 P(T<=t) one-tail0.029776357 t Critical one-tail1.677224196 P(T<=t) two-tail0.059552714 t Critical two-tail2.010634758 Running Head: SUN COAST HEALTH 1 Sun Coast Health By
- 26. Name D ate Running Head: SUN COAST HEALTH 1 Sun Coast Health By Name Date
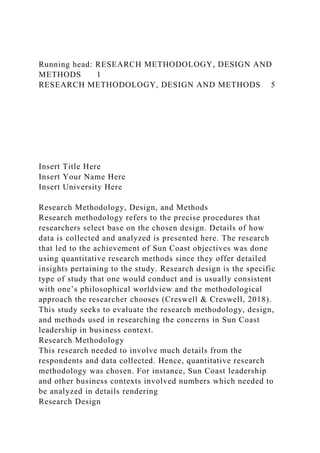
- 27. Using t Test and ANOVA With Sun Coast Remediation Data Set 1 Using t Test and ANOVA With Sun Coast Remediation Data Set 5 Data Set Tammie Witcher Columbia Southern University Data Analysis: Hypothesis Testing Independent Samples t Test: Hypothesis Testing Ho4: There is no statistically significant difference in mean values for Group Aand Group B. Ha4: There is a statistically significant difference in mean values for Group Aand Group B. Table 1: Two-sample independent t-test assuming equal variances Group A Prior Training Scores Group B Revised Training Scores Mean 69.79 84.77 Variance 122.00 26.96 Observations 62.00 62.00
- 28. Pooled Variance 74.48 Hypothesized Mean Difference 0.00 df 122.00 t Stat -9.67 P(T<=t) one-tail 0.000 t Critical one-tail 1.66 P(T<=t) two-tail 0.000 t Critical two-tail 1.98 The two tailed p-value leads to the rejection of the null hypothesis, t(122) = -9.67, p = 0.000. It is therefore concluded that there is a statistically significant difference in the means for group A (M = 69.79, SD = 122) and group B (M =84.77, SD = 26.96) at the 1% level of significance. Dependent Samples (Paired Samples) t Test: Hypothesis Testing Ho5: There is no statistically significant difference in mean values for Pre-Exposure μg/dLand Post-Exposure μg/dL. Ha5: There is a statistically significant difference in mean values for Pre-Exposure μg/dL and Post-Exposure μg/dL. Table 2: Two-sample pared t-test
- 29. Pre-Exposure μg/dL Post-Exposure μg/dL Mean 32.86 33.29 Variance 150.46 155.50 Observations 49.00 49.00 Pearson Correlation 0.99 Hypothesized Mean Difference 0.00 df 48.00 t Stat -1.93 P(T<=t) one-tail 0.030 t Critical one-tail 1.68 P(T<=t) two-tail 0.060 t Critical two-tail 2.01
- 30. The two tailed p-value of the paired t test leads to the rejection of the null hypothesis, t(96) = -1.93, p = 0.030. It is therefore concluded that there is a statistically significant difference in the means for Pre-Exposure μg/dL (M = 32.86, SD = 150.46) and Post-Exposure μg/dL (M = 33.29, SD = 155.50) at the 5% level of significance. ANOVA: Hypothesis Testing Ho5: All the groups means are the equal. Ha5: There exists at least one group mean that is statistically significantly different from the other group means. Table 3: Single factor analysis of variance SUMMARY Groups Count Sum Average Variance A = Air 20.00 178.00 8.90 9.36 B = Soil 20.00 182.00 9.10
- 31. 3.04 C = Water 20.00 140.00 7.00 6.63 D = Training 20.00 108.00 5.40 1.41 ANOVA
- 32. Source of Variation SS df MS F P-value F crit Between Groups 182.80 3.00 60.93 11.92 0.000 2.72 Within Groups 388.40 76.00 5.11 Total 571.20 79.00
- 33. The p-value of the results of the ANOVA procedure leads to the rejection of the null hypothesis that all the group means are equal, F(3, 76) = 11.92, p = 0.000. It is therefore concluded that there is at least one group mean that is statistically significantly from the other means at the 1% level of significance. Running head: RESEARCH OBJECTIVES 1 RESEARCH OBJECTIVES 5 Insert Title Here Insert Your Name Here Insert University Here Research Objectives Sun Coast has identified several areas for concern that they believe could be solved using business research methods. The previous director was tasked with conducting research to help provide information to make decisions about these issues. Although data were collected, the project was never completed. Senior leadership is interested in seeing the project through to fruition. The organization seek to achieve the objectives highlighted below in its endeavor to promote effective leadership and efficiency of service provision. RO1: To determine the relationship between Particulate Matter
- 34. (PM) size and employee health. RO2: To evaluate if training has been successful in reducing lost-time hours and, if so, how to predict lost-time hours from training expenditures. RO3: To employ the historical data from 1,530 contracts to predict the decibels (DB) levels of work environments before placing employees on-site for future contracts. RO4: To evaluate whether the revised program is more effective than the prior training program based on the two groups of employees, A and B who participated in the prior training program and in the revised training programs respectively. RO5: To determine if blood lead levels have increased based on 49 employees who recently concluded a 2-year lead remediation project. RO6: To evaluate where the difference between return on investment exist considering four lines of service that Sun Coast offers to their customers including air monitoring, soil remediation, water reclamation, and health and safety training. Research Questions and Hypotheses Sun Coast faces different business problems which need to be addressed as one means of promoting its endeavor to achieve both short and long term goals. The research questions will help the researchers is designing an appropriate research process that will lead to a credible conclusion to the problem (Creswell, & Creswell, 2018). On the hand, both null and alternative hypotheses will enable the researchers to determine the possible outcome based on the research problem. RQ1: Is there a relationship between Particulate Matter (PM) size and employee health? H01: PM that is less than 2.5 microns is potentially more harmful than PM that is between 10 and 2.5 HA1: There is no statistical relationship between the PM size and the worker’s health RQ2: Has health and safety training successful in reduced lost-
- 35. time hours and, if so, how to can lost-time be predicted? H02: Health and safety training has successfully limited lost- time hours and the lost time can be predicted based on current performance. HA2: There is no statistical relationship between health and safety training and lost time. Hence, it is difficult to predict. RQ3: Can (DB) levels of work environments be predicted before placing employees on-site for future contracts? H03: The standard ear-plugs are adequate to protect employee hearing if the decibel levels are less than 120 decibels (dB). HA3: It is difficult to predict the DB levels since there is no statistical link to it. RQ4: Which program is more effective between two groups of employees, A and B prior training and during the revised training respectively? H04: The program is more efficient with the revised programs than the prior training one. HA4: The program is more efficient with the one prior training than revised one. RQ5: Has the blood lead levels have increased based on 49 employees who recently concluded a 2-year lead remediation project. H05: The blood lead levels have increased considering the sampled employees. HA5: The blood sugar of the employees was maintained upon completion of a 2-year old lead remediation project. RQ6: Is there a difference between return on investment exist considering four lines of service that Sun Coast offers to their customers? H06: There is a difference between the return on investment HA6: there is no statistical provision justifying the relationship between the four lines of service that Sun Coast offers to their customers References Creswell, J. W., & Creswell, J. D. (2018). Research design: Qualitative, quantitative, and mixed methods approaches (5th
- 36. ed.). Thousand Oaks, CA: Sage. Running Head: HUMAN RESOURCE 1 HUMAN RESOURCE 5 Human Resource Name Institution Date Human Resource Central Tendency In the measure of central tendency, the use of mean, mode or median is common. Either measure depends on various characteristic of the data. The use of mean is the most common measure of central tendency. It is referred to us as average. Mean is used when measuring tendency for both continuous and discrete data. A person finds the sum of all variables in the data and divides it to the number of values provided in the data set. Using mean is important as it includes all variables in the data set. Mean is better when sample size is large and when it does not contain outliers. The median measures the middle score for any data set arranged using an order of magnitude. Notably, median is less affected
- 37. by skewed and outliers data. Instances when median is the best measure of central tendency include when there are few extreme scores in the data set distribution. Mean is affected by single outliers but median does not. Second, when there are undetermined or missing values in a data set, the median is better. Third, when dealing with open ended distribution and the data is on an ordinal scale, median gives best tendency measure than mean. The mode gives the most common variable in the data set. Mode is commonly used when considering data in a nominal scale. Mode is rarely used as it does not depict the best measure of central tendency when a common variable is far away when compared to the rest of the data set. Multiple Regression Multiple regression is more of an extended linear regression. It measures the value or relationship between a dependent variable (criterion or target variables) using two or more independent variables (explanatory, regressor or predictor variables). In the human resource domain, high employee performance is vital in attaining increased overall return in an enterprise. Employee performance is determined by other factors like fair remuneration and incentives, training and development program, supervision, good working environment and job security among others. In determining the employees’ performance as the dependent variable (target), the independent variable will be fair remuneration and incentives, training and development program, supervision, good working environment and job security. The assumption of the dependent and independent variables satisfying the use of multiple regression include the dependent variable having a continuous scale. The independent variables must be either categorical (nominal or ordinal) or continuous. The independent and dependent variables should have a linear relationship. The data should show homoscedasticity where the line of best fit remains similar. Moreover, the data must not have multicollinearity to eliminate confusion on which
- 38. independent variable contributes variance in dependent variable. Moreover, no significant outliers, high influential points or high leverage points should occur when performing multiple regression analysis. Lastly, errors must be normally distributed to present the best result in the regression. ANOVA The analysis of variance (ANOVA) determines statistical significant difference between means of independent groups. There is two type of ANOVA namely, one-way ANOVA and two-way ANOVA where there are one independent variable and two independent variable in the test respectively. Taking an example in a human resource field, the HR department wishes to determine the level of occupational stress based on age. The group gets classified into ages 35and below, 35-49 years and 50 years and above; groups are randomly split. Using one-way ANOVA test in the example given above, a person determines the mean score of occupational stress for each group. A person set the confidence level in this instance at 95%. The p-value plays a major role of determining the statistical significance. When the mean is less than or equal to the p-value, a person rejects the null hypothesis and conclude that the population mean are equal. On the other hand, if the p- value is greater than the significance level set, a person accepts the null hypothesis that not all population means are equal. The basic condition while using ANOVA analysis are; the dependent variable are normally distributed, homogeneity of variance as well as independence of all observations made. Risks During a research, human participant may be exposed to physical, economic, social, and psychological or health risk that affects their after-life. Therefore, researchers must develop some techniques to mitigate the risk associated with the study. First, researchers should provide the consent form to the participants. Participants in a research study make the decisions that fit them when offered an accurate consent process. If the participant accepts, it means the risks are manageable; there are
- 39. exemptions to the vulnerable and risk sensitive participants. There should be excellent data collection and storage measures to avoid loss of confidentiality which is a possible risk in research study. Lastly, when the undesirable event happens, researcher should have a contingency plan to alleviate the victims from such risk. It includes having the right medical practitioner always ready to treat the incidences or accidents experienced. However, sometimes the benefits of the research outweigh the potential risks to human participants. Whenever the results of the research develop a cure for the society mostly in medical studies, the research study outweighs the risk. Similarly, in the event that the research result guides the development of policies used as reference to community wellbeing, and the harm is at minimum as determined by the researcher, the research should continue. Application of Research Methods Various aspects of research methods are applicable in life. Ethics is a significant concept which assures that the researchers gets the prerequisite authorization to conduct research. The various ethic bodies ensure that human participants are not exposed to harm, their confidentiality is maintained, and the study is in line with moral standards of the society and specific discipline. Seeking the sample population is also important in life. Notably, a sample population should represent the general population for the results to provide a comprehensive knowledge/information about the population. Therefore, there should be prudent choice of an appropriate sampling design and data collection methods based on the population under study Given the two types of research studies qualitative and quantitative determining which method to use gives a favorable method to evaluate situation in the world. Qualitative method undertakes the use of primary and measurable data while quantitative evaluates secondary and non-measurable information. Lastly, the statistical analysis of data is significant
- 40. to determine a conclusion of the research study. It is through statistical or data analysis that research get inference to make conclusion and propose future research studies. Two issues I would like to study using research methods include: Which factors determines job satisfaction in employees? How human resource hiring determines a company’s future profitability index Correlation Datajob sitemicronsmean annual sick days per employee141126.573854855410677721185.5995710410114.581 28.5413771458159.531677179.55189.571951020662185227.562 38.55249425372667277.57287.55292.773029317.563294336634 3835853618378.55380.78390.58408.544128424.5943674477455 10462.5124759484749855057513.5952865355544.910557.5956 2.57576.575886595660766149628563186428654106649677768 5.2106957706671867267736.56741.58758.56762877857810479 1058088811882768310284788576866.57877.56888.568938900. 599118929693779429958.57963.5997389876995.571007.57101 0.2121024810359 Simple Regression Datacontract #safety training expenditurelost time hours11161985.12102051500.003021461126.464016031294.104 09141445.56404371112.47505981720.816028011789.66601420 1837.52606822000.00607142271.866023361507.977022161542. 337013271544.907010251547.16709201567.55704651600.0070 1381452.698014111500.008014391500.008023881326.6090184 91351.259017401380.699016661423.579016721095.581002455 1132.881004031134.581008561163.4410020501170.921001271 1177.0510024291188.191008121323.291004051051.171101630 1054.0311023761071.751108611077.8611024361080.34110369 23.3712030957.1712076964.111201155976.641201273982.0612 01886985.69120630985.971204071000.001204881002.2712019
- 42. 0.433301835.993309525.6934020126.603404026.9034019920.4 6360 Multiple Regression Datacontract #Frequency (Hz)Angle in DegreesChord LengthVelocity (Meters per Second)DisplacementDecibel142080000.180971.30.0026633712 6.201682100000.089371.30.00266337125.201714125000.03137 1.30.00266337125.9512336160000.186771.30.00266337127.591 2216200000.070571.30.00266337127.4611327250000.128171.3 0.00266337125.5711025315000.196671.30.00266337125.20192 0400000.135371.30.00266337123.061465500000.168871.30.002 66337121.301138630000.157871.30.00266337119.54114118000 00.055871.30.00266337117.15114391000000.151371.30.002663 37115.39123881250000.123871.30.00266337112.241184916000 00.127671.30.00266337108.721174050000.166655.50.00283081 126.416166663000.151555.50.00283081127.696167280000.122 955.50.00283081128.0862455100000.098555.50.00283081126.9 66403125000.172455.50.00283081126.086856160000.112755.5 0.00283081126.9862050200000.070555.50.00283081126.61612 71250000.198855.50.00283081124.1062429315000.115955.50.0 0283081123.236812400000.033255.50.00283081121.106405500 000.036455.50.00283081119.6061630630000.123155.50.002830 81117.9762376800000.065755.50.00283081116.4768611000000 .136555.50.00283081113.07624361250000.117855.50.00283081 111.0763620000.175239.60.00310138118.1293025000.188639.6 0.00310138119.3197631500.032839.60.00310138122.77911554 0000.04239.60.00310138124.809127350000.118839.60.0031013 8126.959188663000.140939.60.00310138128.62963080000.195 339.60.00310138129.099407100000.09539.60.00310138127.899 488125000.103339.60.00310138125.4991971160000.120539.60. 00310138124.04962200000.079239.60.00310138123.689118250 000.153839.60.00310138121.3992315000.112239.60.003101381 20.31942400000.111339.60.00310138119.22992500000.039539. 60.00310138117.789160630000.115839.60.00310138116.22914 9800000.153139.60.00310138114.7791781000000.053639.60.00 310138112.1391601250000.061439.60.00310138109.619562000 0.198931.70.00331266117.19515225000.14831.70.00331266118