Soumettre la recherche
Mettre en ligne
Greater Boston Association of Realtors Monthly Housing Data: October 2016
•
0 j'aime
•
269 vues
Joe Schutt
Suivre
October 2016 Boston Real Estate Market Data
Lire moins
Lire la suite
Immobilier
Signaler
Partager
Signaler
Partager
1 sur 14
Télécharger maintenant
Télécharger pour lire hors ligne
Recommandé
GBAR Monthly Housing Market Data November 2016
Joe Schutt
December 2016 Greater Boston Real Estate Market Trends
Joe Schutt
September 2016 Boston Real Estate Market Trends
Joe Schutt
Greater Boston Association of Realtors January 2017 Monthly Indicators Report
Joe Schutt
August 2016 Boston Real Estate Market Trends
Anna Burns
November 2014 Greater Boston Real Estate Market Trends Report
Unit Realty Group
San Francisco Market Focus October 2017
Ronny Budiutama
San Francisco Market Focus Sept 2017
Ronny Budiutama
December 2014 Greater Boston Real Estate Market Trends Report
Unit Realty Group
October 2015 Greater Boston Real Estate Market Trends Report
Unit Realty Group
San Francisco Market Focus July 2017
Ronny Budiutama
San Francisco Market Focus August 2017
Ronny Budiutama
September 2015 Greater Boston Real Estate Market Trends Report
Unit Realty Group
San Francisco Market Focus October 2016
Ronny Budiutama
San Francisco Market Focus March 2017
Ronny Budiutama
San Francisco Market Focus June 2017
Ronny Budiutama
San Francisco Market Focus April 2017
Ronny Budiutama
San Francisco Market Focus May 2017
Ronny Budiutama
San Francisco Market Focus June 2016
Ronny Budiutama
San Francisco Market Focus December 2015
Ronny Budiutama
August 2015 Greater Boston Real Estate Market Trends Report
Unit Realty Group
February 2015 Greater Boston Real Estate Market Trends Report
Unit Realty Group
December 2017 - A wild ride: Toronto real estate market charts
Scott Ingram, CPA, CA, MBA
San Francisco Market Focus May 2016
Ronny Budiutama
January 2015 Greater Boston Real Estate Market Trends Report
Unit Realty Group
San Francisco Market Focus September 2014
Ronny Budiutama
Jacksonville real estate market report June 2017
Brad Officer Group
August 2016 Boston Real Estate Market Trends
Joe Schutt
San Francisco Market Focus July 2016
Ronny Budiutama
Charlotte Real Estate Market Overview
Scott Browder
Contenu connexe
Tendances
December 2014 Greater Boston Real Estate Market Trends Report
Unit Realty Group
October 2015 Greater Boston Real Estate Market Trends Report
Unit Realty Group
San Francisco Market Focus July 2017
Ronny Budiutama
San Francisco Market Focus August 2017
Ronny Budiutama
September 2015 Greater Boston Real Estate Market Trends Report
Unit Realty Group
San Francisco Market Focus October 2016
Ronny Budiutama
San Francisco Market Focus March 2017
Ronny Budiutama
San Francisco Market Focus June 2017
Ronny Budiutama
San Francisco Market Focus April 2017
Ronny Budiutama
San Francisco Market Focus May 2017
Ronny Budiutama
San Francisco Market Focus June 2016
Ronny Budiutama
San Francisco Market Focus December 2015
Ronny Budiutama
August 2015 Greater Boston Real Estate Market Trends Report
Unit Realty Group
February 2015 Greater Boston Real Estate Market Trends Report
Unit Realty Group
December 2017 - A wild ride: Toronto real estate market charts
Scott Ingram, CPA, CA, MBA
San Francisco Market Focus May 2016
Ronny Budiutama
January 2015 Greater Boston Real Estate Market Trends Report
Unit Realty Group
San Francisco Market Focus September 2014
Ronny Budiutama
Jacksonville real estate market report June 2017
Brad Officer Group
Tendances
(19)
December 2014 Greater Boston Real Estate Market Trends Report
October 2015 Greater Boston Real Estate Market Trends Report
San Francisco Market Focus July 2017
San Francisco Market Focus August 2017
September 2015 Greater Boston Real Estate Market Trends Report
San Francisco Market Focus October 2016
San Francisco Market Focus March 2017
San Francisco Market Focus June 2017
San Francisco Market Focus April 2017
San Francisco Market Focus May 2017
San Francisco Market Focus June 2016
San Francisco Market Focus December 2015
August 2015 Greater Boston Real Estate Market Trends Report
February 2015 Greater Boston Real Estate Market Trends Report
December 2017 - A wild ride: Toronto real estate market charts
San Francisco Market Focus May 2016
January 2015 Greater Boston Real Estate Market Trends Report
San Francisco Market Focus September 2014
Jacksonville real estate market report June 2017
Similaire à Greater Boston Association of Realtors Monthly Housing Data: October 2016
August 2016 Boston Real Estate Market Trends
Joe Schutt
San Francisco Market Focus July 2016
Ronny Budiutama
Charlotte Real Estate Market Overview
Scott Browder
San Francisco Market Focus November 2016
Ronny Budiutama
San Francisco Market Focus September 2016
Ronny Budiutama
San Francisco Market Focus August 2016
Ronny Budiutama
San Francisco Market Focus April 2016
Ronny Budiutama
San Francisco Market Focus March 2016
Ronny Budiutama
San Francisco Market Focus February 2016
Ronny Budiutama
Market Report: MSA Market Detail - Single Family - 3rd Quarter 2017
Al Graham
San Francisco Real Estate Housing Market December 2016
Ronny Budiutama
Charlotte region -monthly indicators - feb 2018
Scott Browder
San Francisco Market Focus March 2018
Ronny Budiutama
San Francisco Market Focus August 2017
Ronny Budiutama
San Francisco Market Focus January 2016
Ronny Budiutama
San Francisco Market Focus November 2015
Ronny Budiutama
October 2014 Greater Boston Real Estate Market Trends Report
Unit Realty Group
Greater Baton Rouge Home Sales December 2017 Update provided by GBRAR.
Bill Cobb, Appraiser
Similaire à Greater Boston Association of Realtors Monthly Housing Data: October 2016
(18)
August 2016 Boston Real Estate Market Trends
San Francisco Market Focus July 2016
Charlotte Real Estate Market Overview
San Francisco Market Focus November 2016
San Francisco Market Focus September 2016
San Francisco Market Focus August 2016
San Francisco Market Focus April 2016
San Francisco Market Focus March 2016
San Francisco Market Focus February 2016
Market Report: MSA Market Detail - Single Family - 3rd Quarter 2017
San Francisco Real Estate Housing Market December 2016
Charlotte region -monthly indicators - feb 2018
San Francisco Market Focus March 2018
San Francisco Market Focus August 2017
San Francisco Market Focus January 2016
San Francisco Market Focus November 2015
October 2014 Greater Boston Real Estate Market Trends Report
Greater Baton Rouge Home Sales December 2017 Update provided by GBRAR.
Plus de Joe Schutt
Gbar monthly-market-insights-report-november20
Joe Schutt
Monthly market-insight-report-oct20
Joe Schutt
Gbar monthly-market-insights-report-june20
Joe Schutt
Gbar monthly-market-insight-report-jan20
Joe Schutt
Gbar monhtly-market-insight-report-nov2019
Joe Schutt
Gbar monthly-market-insights-report-october-2019
Joe Schutt
Gbar monthly-market-insights-report-september-2019v2
Joe Schutt
Greater Boston Association of Realtors Monthly Market Insights Report, August...
Joe Schutt
Greater Boston Association of Realtors Monthly Market Insights Report July 2019
Joe Schutt
Greater Boston Association of Realtors Monthly Market Insights Report July 2019
Joe Schutt
Gbar monthly-market-insights-report-june-2019
Joe Schutt
February 2019 Greater Boston Real Estate Market Trends
Joe Schutt
December 2018 Greater Boston Real Estate Market Trends
Joe Schutt
October 2017 Greater Boston Real Estate Market Trends
Joe Schutt
September 2017 Greater Boston Real Estate Indicators Report
Joe Schutt
August 2017 Greater Boston Real Estate Market Trends
Joe Schutt
July 2017 Greater Boston Real Estate Market Trends
Joe Schutt
May 2017 Greater Boston Association of Realtors Monthly Indicators Report
Joe Schutt
March 2017 Greater Boston Real Estate Market Trends
Joe Schutt
February 2017 Greater Boston Real Estate Market Report
Joe Schutt
Plus de Joe Schutt
(20)
Gbar monthly-market-insights-report-november20
Monthly market-insight-report-oct20
Gbar monthly-market-insights-report-june20
Gbar monthly-market-insight-report-jan20
Gbar monhtly-market-insight-report-nov2019
Gbar monthly-market-insights-report-october-2019
Gbar monthly-market-insights-report-september-2019v2
Greater Boston Association of Realtors Monthly Market Insights Report, August...
Greater Boston Association of Realtors Monthly Market Insights Report July 2019
Gbar monthly-market-insights-report-june-2019
February 2019 Greater Boston Real Estate Market Trends
December 2018 Greater Boston Real Estate Market Trends
October 2017 Greater Boston Real Estate Market Trends
September 2017 Greater Boston Real Estate Indicators Report
August 2017 Greater Boston Real Estate Market Trends
July 2017 Greater Boston Real Estate Market Trends
May 2017 Greater Boston Association of Realtors Monthly Indicators Report
March 2017 Greater Boston Real Estate Market Trends
February 2017 Greater Boston Real Estate Market Report
Dernier
Eldeco Dwarka Project In Delhi-brochure.pdf.pdf
kratirudram
Call Girls In Sarai Rohilla ☎️8447779280{Sarai Rohilla Escort Service In Delh...
asmaqueen5
Kohinoor Teiko Hinjewadi Phase 2 Pune E-Brochure.pdf
ManishSaxena95
construction material procurement in India
rohanindosup
Call girls In Rana Pratap Bagh {Delhi ↫8447779280↬Escort Service (Delhi)
asmaqueen5
Bptp The Amaario Launch Luxury Project Sector 37D Gurgaon Dwarka Expressway...
ApartmentWala1
Kohinoor Courtyard One Wakad Pune | Elegant Living Spaces
aidasheikh47
Real Estate Finance and Investments (2019).pdf
ZahraYusuf9
Yashwin Enchante Uppar Kharadi Pune E-Brochue.pdf
ManishSaxena95
Low Rate ✨➥9711108085▻✨Call Girls In East Of Kailash (E.K) (Delhi)
delhi24hrs1
Yedi Mavi TOBB Zeytinburnu - Listing Turkey
Listing Turkey
Best Interior Design Services in Haldwani
Geomatrix
Bridge & Elliot Ladner Floor Plans May 2024.pdf
VickyAulakh1
Prestige Sancoale Goa Residneces Brochure.pdf
kishor21012022
Escort—>Call GiRls In Mori Gate Delhi —>8447779280—Service Escorts In South D...
asmaqueen5
MEQ Mainstreet Equity Corp Q2 2024 Investor Presentation
MEQ - Mainstreet Equity Corp.
Call Girls in Maurice Nagar (Delhi) ꧁8447779280꧂ Female Escorts Service in De...
asmaqueen5
Call girls in Shakti Nagar Delhi~8447779280°/=@/ Short 1500 Night 6000}ESCORT...
asmaqueen5
Low Rate Call girls in Sant Nagar{Delhi }8447779280} Service Escorts In South...
asmaqueen5
~Call Girls In Roop Nagar {8447779280}(Low Price) Escort Service In Delhi
asmaqueen5
Dernier
(20)
Eldeco Dwarka Project In Delhi-brochure.pdf.pdf
Call Girls In Sarai Rohilla ☎️8447779280{Sarai Rohilla Escort Service In Delh...
Kohinoor Teiko Hinjewadi Phase 2 Pune E-Brochure.pdf
construction material procurement in India
Call girls In Rana Pratap Bagh {Delhi ↫8447779280↬Escort Service (Delhi)
Bptp The Amaario Launch Luxury Project Sector 37D Gurgaon Dwarka Expressway...
Kohinoor Courtyard One Wakad Pune | Elegant Living Spaces
Real Estate Finance and Investments (2019).pdf
Yashwin Enchante Uppar Kharadi Pune E-Brochue.pdf
Low Rate ✨➥9711108085▻✨Call Girls In East Of Kailash (E.K) (Delhi)
Yedi Mavi TOBB Zeytinburnu - Listing Turkey
Best Interior Design Services in Haldwani
Bridge & Elliot Ladner Floor Plans May 2024.pdf
Prestige Sancoale Goa Residneces Brochure.pdf
Escort—>Call GiRls In Mori Gate Delhi —>8447779280—Service Escorts In South D...
MEQ Mainstreet Equity Corp Q2 2024 Investor Presentation
Call Girls in Maurice Nagar (Delhi) ꧁8447779280꧂ Female Escorts Service in De...
Call girls in Shakti Nagar Delhi~8447779280°/=@/ Short 1500 Night 6000}ESCORT...
Low Rate Call girls in Sant Nagar{Delhi }8447779280} Service Escorts In South...
~Call Girls In Roop Nagar {8447779280}(Low Price) Escort Service In Delhi
Greater Boston Association of Realtors Monthly Housing Data: October 2016
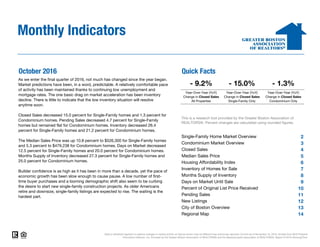
1.
October 2016 Quick
Facts 2 3 4 5 6 7 8 9 10 11 12 13 14 City of Boston Overview Regional Map Median Sales Price Housing Affordability Index Inventory of Homes for Sale Months Supply of Inventory Days on Market Until Sale Percent of Original List Price Received Monthly Indicators As we enter the final quarter of 2016, not much has changed since the year began. Market predictions have been, in a word, predictable. A relatively comfortable pace of activity has been maintained thanks to continuing low unemployment and mortgage rates. The one basic drag on market acceleration has been inventory decline. There is little to indicate that the low inventory situation will resolve anytime soon. Closed Sales decreased 15.0 percent for Single-Family homes and 1.3 percent for Condominium homes. Pending Sales decreased 4.7 percent for Single-Family homes but remained flat for Condominium homes. Inventory decreased 26.4 percent for Single-Family homes and 21.2 percent for Condominium homes. The Median Sales Price was up 10.8 percent to $526,300 for Single-Family homes and 5.3 percent to $479,238 for Condominium homes. Days on Market decreased 12.5 percent for Single-Family homes and 20.0 percent for Condominium homes. Months Supply of Inventory decreased 27.3 percent for Single-Family homes and 25.0 percent for Condominium homes. Builder confidence is as high as it has been in more than a decade, yet the pace of economic growth has been slow enough to cause pause. A low number of first- time buyer purchases and a looming demographic shift also seem to be curbing the desire to start new single-family construction projects. As older Americans retire and downsize, single-family listings are expected to rise. The waiting is the hardest part. Data is refreshed regularly to capture changes in market activity so figures shown may be different than previously reported. Current as of November 16, 2016. All data from MLS Property Information Network, Inc. Provided by the Greater Boston Association of REALTORS® and the Massachusetts Association of REALTORS®. Report © 2016 ShowingTime. Single-Family Home Market Overview - 9.2% - 15.0% - 1.3% This is a research tool provided by the Greater Boston Association of REALTORS®. Percent changes are calculated using rounded figures. Condominium Market Overview Year-Over-Year (YoY) Change in Closed Sales All Properties Year-Over-Year (YoY) Change in Closed Sales Single-Family Only Year-Over-Year (YoY) Change in Closed Sales Condominium Only Closed Sales Pending Sales New Listings
2.
Single-Family Home Market
Overview Historical Sparkbars 10-2015 10-2016 Percent Change YTD 2015 YTD 2016 Percent Change - 3.0%1,524 1,274 - 16.4% 16,685 16,188 Current as of November 16, 2016. All data from MLS Property Information Network, Inc. Provided by the Greater Boston Association of REALTORS® and the Massachusetts Association of REALTORS®. Report © 2016 ShowingTime. | 2 + 0.3% Pending Sales 1,258 1,199 - 4.7% 12,411 12,618 + 1.7% Pct. of Orig. List Price Received 96.7% 98.0% + 1.3% 98.2% 98.5% New Listings -- Days on Market Until Sale 64 56 - 12.5% 62 60 - 3.2% Months Supply of Inventory 3.3 2.4 - 27.3% -- -- - 1.2% Inventory of Homes for Sale 3,762 2,769 - 26.4% -- -- -- Housing Affordability Index 90 84 - 6.7% 83 82 11,750 + 1.5% Median Sales Price $475,000 $526,300 + 10.8% $518,000 $541,000 + 4.4% 11,574 Key market metrics for the current month and year-to-date figures for Single-Family Homes Only. Closed Sales 1,120 952 - 15.0% Key Metrics Oct 2014 Apr 2015 Oct 2015 Apr 2016 Oct 2016 Oct 2014 Apr 2015 Oct 2015 Apr 2016 Oct 2016 Oct 2014 Apr 2015 Oct 2015 Apr 2016 Oct 2016 Oct 2014 Apr 2015 Oct 2015 Apr 2016 Oct 2016 Oct 2014 Apr 2015 Oct 2015 Apr 2016 Oct 2016 Oct 2014 Apr 2015 Oct 2015 Apr 2016 Oct 2016 Oct 2014 Apr 2015 Oct 2015 Apr 2016 Oct 2016 Oct 2014 Apr 2015 Oct 2015 Apr 2016 Oct 2016 Oct 2014 Apr 2015 Oct 2015 Apr 2016 Oct 2016
3.
Condominium Market Overview Historical
Sparkbars 10-2015 10-2016 Percent Change YTD 2015 YTD 2016 Percent Change Key market metrics for the current month and year-to-date figures for Condominium Properties Only. Closed Sales 831 820 Median Sales Price $455,000 $479,238 Inventory of Homes for Sale 2,050 1,616 Days on Market Until Sale 50 40 Housing Affordability Index 94 - 1.3% Key Metrics 9,388 + 4.8%8,954 92 - 2.1% 95 91 - 4.2% + 5.3% $450,000 $487,455 + 8.3% -- -- -- - 21.2% -- -- Months Supply of Inventory 2.4 1.8 - 25.0% -- - 20.0% 49 + 0.3% Pct. of Orig. List Price Received 99.7% 99.7% 0.0% 100.3% - 6.1% 100.5% + 0.2% 46 Current as of November 16, 2016. All data from MLS Property Information Network, Inc. Provided by the Greater Boston Association of REALTORS® and the Massachusetts Association of REALTORS®. Report © 2016 ShowingTime. | 3 + 3.9%Pending Sales 954 954 0.0% 9,661 10,036 New Listings 1,153 1,063 - 7.8% 12,203 12,241 Oct 2014 Apr 2015 Oct 2015 Apr 2016 Oct 2016 Oct 2014 Apr 2015 Oct 2015 Apr 2016 Oct 2016 Oct 2014 Apr 2015 Oct 2015 Apr 2016 Oct 2016 Oct 2014 Apr 2015 Oct 2015 Apr 2016 Oct 2016 Oct 2014 Apr 2015 Oct 2015 Apr 2016 Oct 2016 Oct 2014 Apr 2015 Oct 2015 Apr 2016 Oct 2016 Oct 2014 Apr 2015 Oct 2015 Apr 2016 Oct 2016 Oct 2014 Apr 2015 Oct 2015 Apr 2016 Oct 2016 Oct 2014 Apr 2015 Oct 2015 Apr 2016 Oct 2016
4.
Closed Sales Closed Sales
Single-Family Year-Over-Year Change Condominium Year-Over-Year Change Nov-2015 1,007 +7.4% 775 +16.7% Dec-2015 1,250 +11.2% 912 +8.1% Jan-2016 843 +17.7% 604 +24.5% Feb-2016 589 +10.9% 473 +4.6% Mar-2016 779 +13.9% 756 +30.6% Apr-2016 929 +21.9% 828 +20.0% May-2016 1,249 +17.8% 1,121 +17.0% Jun-2016 1,936 +3.5% 1,412 +1.7% Jul-2016 1,605 -15.6% 1,159 -15.8% Aug-2016 1,715 +0.3% 1,214 -3.0% Sep-2016 1,153 -5.3% 1,001 +6.3% Oct-2016 952 -15.0% 820 -1.3% 12-Month Avg 1,167 +2.7% 923 +5.9% Historical Closed Sales by Month Current as of November 16, 2016. All data from MLS Property Information Network, Inc. Provided by the Greater Boston Association of REALTORS® and the Massachusetts Association of REALTORS®. Report © 2016 ShowingTime. | 4 A count of the actual sales that closed in a given month. 1,034 873 1,120 831 952 820 Single-Family Condominium October 0 500 1,000 1,500 2,000 2,500 1-2003 1-2004 1-2005 1-2006 1-2007 1-2008 1-2009 1-2010 1-2011 1-2012 1-2013 1-2014 1-2015 1-2016 Single-Family Condominium 10,887 9,124 11,574 8,954 11,750 9,388 Single-Family Condominium Year to Date 2014 2015 2016 - 1.3%- 4.8%- 15.0%+ 8.3% - 1.9%+ 1.5%+ 6.3% + 4.8% 2014 2015 2016 2014 2015 2016 2014 2015 2016 - 4.1% - 6.8% - 3.7%+ 3.4%
5.
Median Sales Price Median
Sales Price Single-Family Year-Over-Year Change Condominium Year-Over-Year Change Nov-2015 $517,000 +6.4% $450,455 +7.3% Dec-2015 $500,001 +5.3% $443,750 +5.2% Jan-2016 $490,000 +1.0% $443,250 -1.3% Feb-2016 $517,500 +10.1% $449,000 +7.0% Mar-2016 $472,500 +0.6% $478,750 +5.2% Apr-2016 $530,000 +3.5% $480,228 +10.1% May-2016 $530,250 +2.0% $482,500 +4.0% Jun-2016 $585,000 +4.5% $505,000 +9.8% Jul-2016 $575,000 +4.5% $495,000 +7.6% Aug-2016 $575,000 +8.7% $499,950 +9.6% Sep-2016 $510,000 +3.7% $510,000 +19.9% Oct-2016 $526,300 +10.8% $479,238 +5.3% 12-Month Avg* $527,379 +4.5% $476,427 +7.9% Historical Median Sales Price by Month * Median Sales Price for all properties from November 2015 through October 2016. This is not the average of the individual figures above. Current as of November 16, 2016. All data from MLS Property Information Network, Inc. Provided by the Greater Boston Association of REALTORS® and the Massachusetts Association of REALTORS®. Report © 2016 ShowingTime. | 5 Point at which half of the sales sold for more and half sold for less, not accounting for seller concessions, in a given month. $472,500 $395,000 $475,000 $455,000 $526,300 $479,238 Single-Family Condominium October $200,000 $300,000 $400,000 $500,000 $600,000 $700,000 1-2003 1-2004 1-2005 1-2006 1-2007 1-2008 1-2009 1-2010 1-2011 1-2012 1-2013 1-2014 1-2015 1-2016 Single-Family Condominium $495,000 $414,178 $518,000 $450,000 $541,000 $487,455 Single-Family Condominium Year to Date 2014 2015 2016 + 5.3%+ 15.2%+ 10.8%+ 0.5% + 8.6%+ 4.4%+ 4.6% + 8.3% 2014 2015 2016 2014 2015 2016 2014 2015 2016 + 5.0% + 7.3% + 6.2%+ 1.3%
6.
Housing Affordability Index Affordability
Index Single-Family Year-Over-Year Change Condominium Year-Over-Year Change Nov-2015 82 -2.4% 94 -3.1% Dec-2015 85 -2.3% 96 -1.0% Jan-2016 86 -3.4% 95 -2.1% Feb-2016 85 -7.6% 97 -6.7% Mar-2016 92 +1.1% 91 -3.2% Apr-2016 82 -3.5% 91 -8.1% May-2016 82 -2.4% 90 -4.3% Jun-2016 76 0.0% 88 -5.4% Jul-2016 77 +1.3% 89 -2.2% Aug-2016 77 -3.8% 89 -4.3% Sep-2016 87 0.0% 87 -13.9% Oct-2016 84 -6.7% 92 -2.1% 12-Month Avg 83 -2.4% 92 -4.3% Historical Housing Affordability Index by Month Current as of November 16, 2016. All data from MLS Property Information Network, Inc. Provided by the Greater Boston Association of REALTORS® and the Massachusetts Association of REALTORS®. Report © 2016 ShowingTime. | 6 This index measures housing affordability for the region. For example, an index of 120 means the median household income is 120% of what is necessary to qualify for the median-priced home under prevailing interest rates. A higher number means greater affordability. 86 103 90 94 84 92 Single-Family Condominium October 40 60 80 100 120 140 1-2003 1-2004 1-2005 1-2006 1-2007 1-2008 1-2009 1-2010 1-2011 1-2012 1-2013 1-2014 1-2015 1-2016 Single-Family Condominium 82 98 83 95 82 91 Single-Family Condominium Year to Date 2014 2015 2016 - 2.1%- 8.7%- 6.7%+ 4.7% - 3.1%- 1.2%+ 1.2% - 4.2% 2014 2015 2016 2014 2015 2016 2014 2015 2016 - 1.1% - 3.5% - 2.0%+ 3.0%
7.
Inventory of Homes
for Sale Homes for Sale Single-Family Year-Over-Year Change Condominium Year-Over-Year Change Nov-2015 3,141 +2.8% 1,816 +12.6% Dec-2015 2,385 -0.5% 1,388 +11.2% Jan-2016 2,323 +2.7% 1,385 +8.8% Feb-2016 2,346 +14.3% 1,379 +13.1% Mar-2016 2,854 +26.7% 1,640 +19.9% Apr-2016 3,185 +6.5% 1,673 -2.8% May-2016 3,218 -9.0% 1,660 -14.3% Jun-2016 3,343 -9.7% 1,678 -13.2% Jul-2016 3,156 -14.9% 1,674 -11.6% Aug-2016 2,830 -21.3% 1,498 -17.3% Sep-2016 3,145 -19.6% 1,792 -15.0% Oct-2016 2,769 -26.4% 1,616 -21.2% 12-Month Avg 2,891 -6.8% 1,600 -4.8% Historical Inventory of Homes for Sale by Month Current as of November 16, 2016. All data from MLS Property Information Network, Inc. Provided by the Greater Boston Association of REALTORS® and the Massachusetts Association of REALTORS®. Report © 2016 ShowingTime. | 7 The number of properties available for sale in active status at the end of a given month. 3,726 1,929 3,762 2,050 2,769 1,616 Single-Family Condominium October 0 2,000 4,000 6,000 8,000 10,000 1-2003 1-2004 1-2005 1-2006 1-2007 1-2008 1-2009 1-2010 1-2011 1-2012 1-2013 1-2014 1-2015 1-2016 Single-Family Condominium 2014 2015 2016 - 21.2%+ 6.3%- 26.4%+ 1.0% 2014 2015 2016 + 9.4% - 9.2%
8.
Months Supply of
Inventory Months Supply Single-Family Year-Over-Year Change Condominium Year-Over-Year Change Nov-2015 2.8 0.0% 2.1 +16.7% Dec-2015 2.1 -4.5% 1.6 +14.3% Jan-2016 2.0 -4.8% 1.5 +7.1% Feb-2016 2.0 +5.3% 1.5 +7.1% Mar-2016 2.4 +14.3% 1.8 +12.5% Apr-2016 2.7 -3.6% 1.8 -10.0% May-2016 2.7 -18.2% 1.8 -21.7% Jun-2016 2.8 -17.6% 1.8 -21.7% Jul-2016 2.7 -20.6% 1.8 -18.2% Aug-2016 2.4 -25.0% 1.6 -23.8% Sep-2016 2.7 -22.9% 1.9 -20.8% Oct-2016 2.4 -27.3% 1.8 -25.0% 12-Month Avg* 2.5 -13.4% 1.8 -9.8% Historical Months Supply of Inventory by Month * Months Supply for all properties from November 2015 through October 2016. This is not the average of the individual figures above. Current as of November 16, 2016. All data from MLS Property Information Network, Inc. Provided by the Greater Boston Association of REALTORS® and the Massachusetts Association of REALTORS®. Report © 2016 ShowingTime. | 8 The inventory of homes for sale at the end of a given month, divided by the average monthly closed sales from the last 12 months. 3.5 2.2 3.3 2.42.4 1.8 Single-Family Condominium October 0.0 2.0 4.0 6.0 8.0 10.0 1-2004 1-2005 1-2006 1-2007 1-2008 1-2009 1-2010 1-2011 1-2012 1-2013 1-2014 1-2015 1-2016 Single-Family Condominium 2014 2015 2016 - 25.0%+ 9.1%- 27.3%- 5.7% 2014 2015 2016 + 16.7% - 4.3%
9.
Days on Market
Until Sale Days on Market Single-Family Year-Over-Year Change Condominium Year-Over-Year Change Nov-2015 61 -7.6% 56 +5.7% Dec-2015 70 +1.4% 52 -5.5% Jan-2016 74 -11.9% 58 -1.7% Feb-2016 91 -3.2% 64 -13.5% Mar-2016 80 -13.0% 60 -9.1% Apr-2016 70 -10.3% 48 -18.6% May-2016 58 -1.7% 46 +2.2% Jun-2016 49 -5.8% 41 +5.1% Jul-2016 51 +4.1% 41 +2.5% Aug-2016 56 +3.7% 41 -8.9% Sep-2016 52 -8.8% 41 -18.0% Oct-2016 56 -12.5% 40 -20.0% 12-Month Avg* 64 -3.4% 49 -4.8% Historical Days on Market Until Sale by Month * Days on Market for all properties from November 2015 through October 2016. This is not the average of the individual figures above. Current as of November 16, 2016. All data from MLS Property Information Network, Inc. Provided by the Greater Boston Association of REALTORS® and the Massachusetts Association of REALTORS®. Report © 2016 ShowingTime. | 9 Average number of days between when a property is listed and when an offer is accepted in a given month. 61 50 64 50 56 40 Single-Family Condominium October 20 40 60 80 100 120 140 1-2003 1-2004 1-2005 1-2006 1-2007 1-2008 1-2009 1-2010 1-2011 1-2012 1-2013 1-2014 1-2015 1-2016 Single-Family Condominium 59 53 62 49 60 46 Single-Family Condominium Year to Date 2014 2015 2016 - 20.0%0.0%- 12.5%+ 4.9% - 7.5%- 3.2%+ 5.1% - 6.1% 2014 2015 2016 2014 2015 2016 2014 2015 2016 + 8.9% - 3.3% + 1.9%+ 8.7%
10.
Percent of Original
List Price Received Pct. of Orig. List Price Received Single-Family Year-Over-Year Change Condominium Year-Over-Year Change Nov-2015 97.4% +0.8% 99.3% +1.2% Dec-2015 96.1% +0.5% 98.3% +0.4% Jan-2016 95.8% -0.1% 97.9% +0.1% Feb-2016 95.7% +0.5% 98.1% -0.1% Mar-2016 97.7% +1.2% 99.7% +1.0% Apr-2016 98.4% +1.0% 101.1% +0.5% May-2016 99.3% +0.2% 101.4% +0.5% Jun-2016 99.8% +0.1% 101.7% +0.1% Jul-2016 99.6% +0.1% 101.5% +0.4% Aug-2016 98.6% +0.1% 100.8% +0.2% Sep-2016 97.9% +0.2% 100.0% +0.5% Oct-2016 98.0% +1.3% 99.7% 0.0% 12-Month Avg* 97.8% +0.3% 100.0% +0.3% Historical Percent of Original List Price Received by Month * Pct. of Orig. List Price Received for all properties from November 2015 through October 2016. This is not the average of the individual figures above. Current as of November 16, 2016. All data from MLS Property Information Network, Inc. Provided by the Greater Boston Association of REALTORS® and the Massachusetts Association of REALTORS®. Report © 2016 ShowingTime. | 10 Percentage found when dividing a property’s sales price by its original list price, then taking the average for all properties sold in a given month, not accounting for seller concessions. 96.7% 98.5%96.7% 99.7%98.0% 99.7% Single-Family Condominium October 87.5% 90.0% 92.5% 95.0% 97.5% 100.0% 102.5% 1-2003 1-2004 1-2005 1-2006 1-2007 1-2008 1-2009 1-2010 1-2011 1-2012 1-2013 1-2014 1-2015 1-2016 Single-Family Condominium 97.9% 99.5%98.2% 100.3%98.5% 100.5% Single-Family Condominium Year to Date 2014 2015 2016 0.0%+ 1.2%+ 1.3%0.0% + 0.8%+ 0.3%+ 0.3% + 0.2% 2014 2015 2016 2014 2015 2016 2014 2015 2016 - 0.5% + 0.7% + 0.7%- 0.1%
11.
Pending Sales Pending Sales
Single-Family Year-Over-Year Change Condominium Year-Over-Year Change Nov-2015 950 +6.1% 722 +10.2% Dec-2015 659 +11.9% 519 +12.1% Jan-2016 683 -3.3% 648 +18.2% Feb-2016 884 +39.9% 823 +45.1% Mar-2016 1,432 +29.6% 1,129 +13.2% Apr-2016 1,587 +2.7% 1,301 +2.1% May-2016 1,772 +0.7% 1,298 +0.1% Jun-2016 1,612 -9.8% 1,195 -13.8% Jul-2016 1,142 -10.9% 877 -9.0% Aug-2016 1,126 +0.4% 888 +9.1% Sep-2016 1,181 -2.6% 923 +7.3% Oct-2016 1,199 -4.7% 954 0.0% 12-Month Avg 1,186 +2.4% 940 +4.6% Historical Pending Sales by Month A count of the properties in UAG status between the first and last day in a given month, regardless of current status (based on Off Market Date). Current as of November 16, 2016. All data from MLS Property Information Network, Inc. Provided by the Greater Boston Association of REALTORS® and the Massachusetts Association of REALTORS®. Report © 2016 ShowingTime. | 11 1,163 836 1,258 954 1,199 954 Single-Family Condominium October 250 500 750 1,000 1,250 1,500 1,750 2,000 1-2003 1-2004 1-2005 1-2006 1-2007 1-2008 1-2009 1-2010 1-2011 1-2012 1-2013 1-2014 1-2015 1-2016 Single-Family Condominium 11,552 9,440 12,411 9,661 12,618 10,036 Single-Family Condominium Year to Date 2014 2015 2016 0.0%+ 14.1%- 4.7%+ 8.2% + 2.3%+ 1.7%+ 7.4% + 3.9% 2014 2015 2016 2014 2015 2016 2014 2015 2016 + 2.6% - 6.4% - 6.1%- 2.9%
12.
New Listings New Listings
Single-Family Year-Over-Year Change Condominium Year-Over-Year Change Nov-2015 876 +17.9% 761 +26.2% Dec-2015 553 +10.4% 462 +15.8% Jan-2016 903 +7.4% 805 +13.5% Feb-2016 1,126 +76.8% 938 +50.6% Mar-2016 2,168 +45.1% 1,545 +22.2% Apr-2016 2,124 -14.1% 1,470 -15.1% May-2016 2,071 -18.2% 1,437 -13.5% Jun-2016 2,117 -6.8% 1,438 -8.2% Jul-2016 1,315 -19.3% 1,111 -0.5% Aug-2016 1,206 -9.4% 956 +2.1% Sep-2016 1,884 -3.5% 1,478 +2.6% Oct-2016 1,274 -16.4% 1,063 -7.8% 12-Month Avg 1,468 -1.7% 1,122 +2.0% Historical New Listings by Month Current as of November 16, 2016. All data from MLS Property Information Network, Inc. Provided by the Greater Boston Association of REALTORS® and the Massachusetts Association of REALTORS®. Report © 2016 ShowingTime. | 12 A count of the properties that have been newly listed on the market in a given month. 1,479 1,114 1,524 1,153 1,274 1,063 Single-Family Condominium October 0 1,000 2,000 3,000 4,000 1-2003 1-2004 1-2005 1-2006 1-2007 1-2008 1-2009 1-2010 1-2011 1-2012 1-2013 1-2014 1-2015 1-2016 Single-Family Condominium 16,130 11,775 16,685 12,203 16,188 12,241 Single-Family Condominium Year to Date 2014 2015 2016 - 7.8%+ 3.5%- 16.4%+ 3.0% + 3.6%- 3.0%+ 3.4% + 0.3% 2014 2015 2016 2014 2015 2016 2014 2015 2016 + 3.4% + 0.1% - 6.2%+ 2.4%
13.
City of Boston
- Market Overview Historical Sparkbars 10-2015 10-2016 Percent Change YTD 2015 YTD 2016 Percent Change Key market metrics for the current month and year-to-date figures for the City of Boston. Closed Sales 374 381 + 1.9% Key Metrics 4,498 + 0.9% Median Sales Price $531,750 $560,000 + 5.3% $511,750 $566,000 + 10.6% 4,456 Housing Affordability Index 89 87 - 2.2% 92 86 - 6.5% ---- Months Supply of Inventory 2.5 2.0 - 20.0% -- Inventory of Homes for Sale 1,079 884 - 18.1% -- 47 46 -- -- - 3.1% 4,827 - 2.1% Pct. of Orig. List Price Received 99.3% 99.6% + 0.3% 99.8% 99.9% + 0.1% Days on Market Until Sale 47 43 - 8.5% Current as of November 16, 2016. All data from MLS Property Information Network, Inc. Provided by the Greater Boston Association of REALTORS® and the Massachusetts Association of REALTORS®. Report © 2016 ShowingTime. | 13 - 0.2% 6,105 - 1.2% 4,815 New Listings 619 589 - 4.8% 6,178 Pending Sales 490 475 Oct 2014 Apr 2015 Oct 2015 Apr 2016 Oct 2016 Oct 2014 Apr 2015 Oct 2015 Apr 2016 Oct 2016 Oct 2014 Apr 2015 Oct 2015 Apr 2016 Oct 2016 Oct 2014 Apr 2015 Oct 2015 Apr 2016 Oct 2016 Oct 2014 Apr 2015 Oct 2015 Apr 2016 Oct 2016 Oct 2014 Apr 2015 Oct 2015 Apr 2016 Oct 2016 Oct 2014 Apr 2015 Oct 2015 Apr 2016 Oct 2016 Oct 2014 Apr 2015 Oct 2015 Apr 2016 Oct 2016 Oct 2014 Apr 2015 Oct 2015 Apr 2016 Oct 2016
14.
Regional Map Central Middlesex
Region Metro West Region Acton Ashland Bedford Dover Boxboro Framingham Concord Holliston Hudson Hopkinton Lexington Medfield Lincoln Medway Maynard Millis Stow Natick Sudbury Needham Wayland Sherborn Weston Wellesley Eastern Middlesex Region Southern Norfolk Region Burlington Avon Malden Bellingham Medford Canton Melrose Foxboro North Reading Franklin Reading Mansfield Stoneham Norfolk Wakefield Norwood Wilmington Randolph Winchester Sharon Woburn Stoughton Walpole Metro Boston Region Westwood Arlington Wrentham Belmont Boston Brookline Cambridge Chelsea Dedham Everett Milton Newton Revere Somerville Waltham Watertown Winthrop A map of the the 64 areas and 5 regions that make up "Greater Boston." Greater Boston Association of REALTORS® Regional Map Communities by Region Current as of November 16, 2016. All data from MLS Property Information Network, Inc. Provided by the Greater Boston Association of REALTORS® and the Massachusetts Association of REALTORS®. Report © 2016 ShowingTime. | 14
Télécharger maintenant