SlideShare une entreprise Scribd logo
1  sur  17
Short term intensive rotational
grazing in native pasture: Effects
 on soil nitrate and extractable P


     G. Sanjari, H. Ghadiri, C. Ciesiolka


  Research Institute of Forests and Rangelands, Tehran, Iran
 School of Environmental studies, Griffith University, Australia
 Department of Natural Resources and Mines, QLD, Australia
Outline

 Introduction
 Currajong project
  Location and climate
  Grazing treatments
  Soil analysis
  Results
        Soil Organic Carbon and
         Nitrogen
        Soil nitrate and extractable P
        Sheep camp results
   Conclusion
Introduction

   Livestock industry is of main sources
    responsible for downstream water pollution
Introduction (continue)

  Standards for the pollutants

 In water:
• The maximum concentration of nitrate
  allowed in drinking water is 10 mg/L.

• For aquatic life, nitrate level more than
  4 mg/L considered as pollution problem

• Biological growth can be stimulated when Dissolved reactive P
  (DRP) exceeds 0.01 mg/L

 In soil solutions:
• Environmental concern arise when the nutrient level in soil
  profile exceed 160 kg/ha for nitrate and 330 kg/ha for available P
Introduction (continue)
      Grazing behavior and animal waste
      concern in native pasture

Grazing animals:
  • Recycle 75 – 85% of forage they consume
  • Don’t graze pasture uniformly
  • Distribute deposits mainly around food
    and water troughs, under shades, along
    fence lines, etc
Outcomes of a continual grazing:
  •   Imbalanced distribution of nutrients
  •   Nutrient depletion across paddocks
  •   Low pasture productivity
  •   Animal camp site development and
      environmental concern on water
      contamination
                                       Sheep Camp
Introduction (continue)
    Grazing practices affect soil health and
    water quality

Continuous grazing (large paddock)
  • Increasing runoff and soil loss and low
    productivity
  • Grazing animals are free to congregate
  • Encourages animal camp development

Rotational grazing (small paddocks)
  • Includes rest periods for pasture recovery
    after grazing operations
  • Better runoff and soil loss control
  • Discourages animal congregation
  • More balanced distribution of animal
    wastes
Currajong case study

Short term Intensive Rotational Grazing (SIRG)
vs. yearlong Continuous Grazing (CG)


Soil parameters:
                                              Q u e e n s la n d
•   Organic Carbon (SOC)
•
                                         M u rra y D a rlin g B a s in
    Organic Nitrogen (SON)
•   Nitrate-Nitrogen         Location:            the data
                                                                         C u rra jo n g


•   Extractable P
                             Property of Currajong
                             Southeast Queensland
Currajong study (continue)

 Climate

                                                       Sep
Rainfall:                                 Dry Season
                                                             Oct


Long term annual:   645 mm                  31%                    Wet season
                                                                      69%


                                    Apr
                                               Mar
Soil:
Up to 50 cm in depth
Brown to dark clay loam


Vegetation:
Open Eucalypt woodland with
understorey of perennial grass species
Dominant species: Dichanthium sericem
Currajong study (continue)

Methods: Stocking properties
                        Grazing                                                         Grazing periods                          Rest periods                               SR                             DDH
                      Treatments                                                            (days)                                 (days)                                 (dse/ha)                       dse.day/ha
           Short intensive rotational                                                             14        9‡                    (101              60)‡                 12.6        6‡                       3608

           Continuous                                                                                  365                                     0                          1.6        0.2                      3529
       DDH- Number of dse days per hectare over the whole study period;                                                         ‡- Means             1SD;          SR- Stocking rate


                      20
                      18
                      16
                      14
Stocking rate DSE/H


                      12
                      10
                       8
                       6
                       4
                       2
                       0
                           1/01/00

                                     1/05/00

                                               1/09/00

                                                         1/01/01

                                                                   1/05/01

                                                                              1/09/01

                                                                                        1/01/02

                                                                                                  1/05/02

                                                                                                            1/09/02

                                                                                                                      1/01/03

                                                                                                                                1/05/03

                                                                                                                                          1/09/03

                                                                                                                                                     1/01/04

                                                                                                                                                               1/05/04

                                                                                                                                                                           1/09/04

                                                                                                                                                                                     1/01/05

                                                                                                                                                                                               1/05/05

                                                                                                                                                                                                           1/09/05

                                                                                                                                                                                                                     1/01/06

                                                                                                                                                                                                                               1/05/06
                                                                             Continuous grazing                             Short intensive rotational grazing
Currajong study (continue)

 Methods: Soil analysis

Soil Organic Carbon:
Rapid wet oxidation (Walkley and Black)

Soil Organic Nitrogen:
Semimicro Kjeldahl procedure (Bremner 1996)

Nitrate and Ammonium:
2 M KCL solution extraction (Bremner Keeney
1966), auto analyzer (Lachat 2001)

Extractable P
0.5 M NaHCO3 Orthophosphate extraction
(Colwell 1963), colorimetric procedure (Murphy and Riley 1962)
Currajong study (continue)

       Results: SOC & SON (treatments)

                                   2001                 2006
                                                          ns                                       2001                  2006

               30.0        ns
                                                                                 2.4         ns
                          p<16                ns                                            p<29
SOC tonne/ha


               27.5


                                                                 SON tonne/h a
                                                                                 2.2                                        ns
                                                                                                               ns          p<25

               25.0
                                                                                 2.0


               22.5
                                                                                 1.8


               20.0
                                                         Not                     1.6
                       Short intensive     Continuous
                                                        grazed                          Short intensive     Continuous     Not
                      rotational grazing    grazing
                                                                                       rotational grazing    grazing      grazed
Currajong study (continue)

Results: SOC & SON (sub-treatments)


                                   2001                   2006                                     2001               2006
                                                                                     3.0    ns
                  32.0                                                                     p<18

                          *
                         p<10                                 ns
                                                                                                                          ns
                                                                                     2.5


                                                                      SON tonne/ha
   SOC tonne/ha


                                        ns
                                                                                                         ns
                  28.0                           ns

                                                                                     2.0                        ns


                  24.0
                                                                                     1.5


                  20.0                                                               1.0
                              C1          C2     C3              C4                          C1           C2    C3            C4
                            Short intensive           Continuous                            Short intensive      Continuous
                           rotational grazing          grazing                             rotational grazing     grazing
Currajong study (continue)

Results: Nitrate & Extractable P

                                                      Ammonium concentration
                                                      In grazing exclusion:
                                                       2001       4.56 mg/kg

                                        6.0
                                                       2006      13.69 mg/kg
           2001               2006                                                                           2001     20

                                                                                                             2006
                                        4.5


                                                                                                                           Kg/ha
                                              Kg/ha


                                                                                                                           Extractable P
                                        3.0
                                              NO3-N


                                                                                                                      10


                                        1.5


                                        0.0                                                                           0
 Short intensive Continuous     Not                                             Short intensive Continuous    Not
rotational grazing grazing     grazed                                          rotational grazing grazing    grazed
Currajong study (continue)

   Results: Nitrate & Extractable P (continue)
                                                                                                             3500


                                                                                        Herbage mass kg/ha
                                                                                                             3000
                                                                                                                                                           Rotational grazing

                                                                                                             2500
Increase in herbage mass
                                                                                                             2000                                        Continuous grazing


                                                                                                             1500


                                                                                                             1000
                                                                                                                    May 01    Feb 02   Mar 03   Mar 04   Feb 05     Feb 06      May 06
                        2000
                                                                                                                                           Date of sam pling
                                   Short intensive rotational grazing
                        1600       Continuous grazing
Mass of residue kg/ha


                        1200


                        800
                                                                                                                             Increase in Residue
                        400


                          0
                                 0      268      683    1047     1367   1737   1824
                               May 01                   Days                   May 06
Currajong study (continue)

Results: Nitrate & Extractable P (Sheep camp effects)

                                   100                                                                     1000
NO3 concentration (kg/ha in 0-10 cm)


                                                                                                                  PO4 concentration (kg/ha in 0-10 cm)
                                       10                                                                  100
                                                                                               NO3 2001                                                  Sheep camp vegetation:
                                         1                                                     PO4 2001     10

                                                                                                                                                                 Couch grass
                                       0.1                                                     PO4 2006     1                                            Agropyron repense (L.) P.Beauv
                                                                                               NO3 2006

                          0.01                                                                             0.1
                                              0     100     200             300          400         500
                                                          Distance from sheep camp (m)


Couch grass regrowth:
          Herbage mass                                                   Rest period
                                             Kg/ha DM                             days

                                             2650                                    26
                                             3685                                    60
Currajong study (continue)

Results: Nitrate & Extractable P (Sheep camp effects)

                                  Nitrate    Phosphate
                                   Kg/ha          Kg/ha

Soil analysis:          2001       126            222
                        2006       17.6           79.3

                     Thresholds    160              330


Water analysis: Sampled on 22/01/06
                                                          Water analysis:
Time (min)       6       15         25       34           Sampled in 2001


NO3-N (Mg/L)   0.143    0.189     0.133     0.100         NO3-N        3.4   Mg/L


DRP (Mg/L)     0.062    0.013     0.137     0.141         DRP          2.5   Mg/L
Conclusion

   Continuous grazing encourages animal aggregation to develop
    camp sites with large deposits of animal wastes raising alarm for
    downstream water contamination

   In the study area we found the above threat could be easily the case
    at regional scale with more camp site development under
    continuous grazing

   Short period Intensive Rotational Grazing (SIRG) in the native
    pasture, modified the aggregation behavior of animals, leading to a
    major decrease in soil nitrate and extractable P concentrations

   The rotational grazing provides an environmentally oriented pasture
    utilization giving a more forage production over continuous grazing

Contenu connexe

Plus de Joanna Hicks

SIMLESA: one year later. Mulugetta Mekuria
SIMLESA: one year later. Mulugetta MekuriaSIMLESA: one year later. Mulugetta Mekuria
SIMLESA: one year later. Mulugetta MekuriaJoanna Hicks
 
Towards sustainable intensification of Maize-Legume cropping systems: Kenya e...
Towards sustainable intensification of Maize-Legume cropping systems: Kenya e...Towards sustainable intensification of Maize-Legume cropping systems: Kenya e...
Towards sustainable intensification of Maize-Legume cropping systems: Kenya e...Joanna Hicks
 
Making CA ever green. Dennis Garrity
Making CA ever green. Dennis GarrityMaking CA ever green. Dennis Garrity
Making CA ever green. Dennis GarrityJoanna Hicks
 
Adoption of CA practices: evidence of interdependence in plot level farmer te...
Adoption of CA practices: evidence of interdependence in plot level farmer te...Adoption of CA practices: evidence of interdependence in plot level farmer te...
Adoption of CA practices: evidence of interdependence in plot level farmer te...Joanna Hicks
 
Soil and yield improvements from controlled traffic farming on a red chromoso...
Soil and yield improvements from controlled traffic farming on a red chromoso...Soil and yield improvements from controlled traffic farming on a red chromoso...
Soil and yield improvements from controlled traffic farming on a red chromoso...Joanna Hicks
 
Comparison of different soil tillage systems, under several crop rotations in...
Comparison of different soil tillage systems, under several crop rotations in...Comparison of different soil tillage systems, under several crop rotations in...
Comparison of different soil tillage systems, under several crop rotations in...Joanna Hicks
 
The effects of minimum and conventional tillage systems on maize grain yield ...
The effects of minimum and conventional tillage systems on maize grain yield ...The effects of minimum and conventional tillage systems on maize grain yield ...
The effects of minimum and conventional tillage systems on maize grain yield ...Joanna Hicks
 
Controlled traffic/permanent bed farming reduces GHG emissions. Jeff Tullberg
Controlled traffic/permanent bed farming reduces GHG emissions. Jeff TullbergControlled traffic/permanent bed farming reduces GHG emissions. Jeff Tullberg
Controlled traffic/permanent bed farming reduces GHG emissions. Jeff TullbergJoanna Hicks
 
Controlled traffic farming, productivity, sustainability and resilience: outc...
Controlled traffic farming, productivity, sustainability and resilience: outc...Controlled traffic farming, productivity, sustainability and resilience: outc...
Controlled traffic farming, productivity, sustainability and resilience: outc...Joanna Hicks
 
Production systems for the future: balancing trade-offs between food producti...
Production systems for the future: balancing trade-offs between food producti...Production systems for the future: balancing trade-offs between food producti...
Production systems for the future: balancing trade-offs between food producti...Joanna Hicks
 
Sustainable intensification of maize-bean production among smallholder farmer...
Sustainable intensification of maize-bean production among smallholder farmer...Sustainable intensification of maize-bean production among smallholder farmer...
Sustainable intensification of maize-bean production among smallholder farmer...Joanna Hicks
 
Nitrogen is essential to capture the benefit of summer rainfall for wheat in ...
Nitrogen is essential to capture the benefit of summer rainfall for wheat in ...Nitrogen is essential to capture the benefit of summer rainfall for wheat in ...
Nitrogen is essential to capture the benefit of summer rainfall for wheat in ...Joanna Hicks
 
Biomass shifts and suppresses weed populations under CA. Michael Mulvaney
Biomass shifts and suppresses weed populations under CA. Michael MulvaneyBiomass shifts and suppresses weed populations under CA. Michael Mulvaney
Biomass shifts and suppresses weed populations under CA. Michael MulvaneyJoanna Hicks
 
Stubble retention in cropping in South East Australia: benefits and challenge...
Stubble retention in cropping in South East Australia: benefits and challenge...Stubble retention in cropping in South East Australia: benefits and challenge...
Stubble retention in cropping in South East Australia: benefits and challenge...Joanna Hicks
 
Agroforestry adaptation and mitigation options for smallholder farmers vulner...
Agroforestry adaptation and mitigation options for smallholder farmers vulner...Agroforestry adaptation and mitigation options for smallholder farmers vulner...
Agroforestry adaptation and mitigation options for smallholder farmers vulner...Joanna Hicks
 
Reducing the cost of complexity for greater farming system change. Rick Llewe...
Reducing the cost of complexity for greater farming system change. Rick Llewe...Reducing the cost of complexity for greater farming system change. Rick Llewe...
Reducing the cost of complexity for greater farming system change. Rick Llewe...Joanna Hicks
 
Exploring hotspots in the carbon footprint and energy use profiles of fresh t...
Exploring hotspots in the carbon footprint and energy use profiles of fresh t...Exploring hotspots in the carbon footprint and energy use profiles of fresh t...
Exploring hotspots in the carbon footprint and energy use profiles of fresh t...Joanna Hicks
 
Adopt: adoption and diffusion outcome prediction tool. Geoff Kuehne
Adopt: adoption and diffusion outcome prediction tool. Geoff KuehneAdopt: adoption and diffusion outcome prediction tool. Geoff Kuehne
Adopt: adoption and diffusion outcome prediction tool. Geoff KuehneJoanna Hicks
 
To mix or not to mix: evidences for the unexpected high productivity of new a...
To mix or not to mix: evidences for the unexpected high productivity of new a...To mix or not to mix: evidences for the unexpected high productivity of new a...
To mix or not to mix: evidences for the unexpected high productivity of new a...Joanna Hicks
 
The expected value of seasonal streamflow forecasts to a grain-cotton irrigat...
The expected value of seasonal streamflow forecasts to a grain-cotton irrigat...The expected value of seasonal streamflow forecasts to a grain-cotton irrigat...
The expected value of seasonal streamflow forecasts to a grain-cotton irrigat...Joanna Hicks
 

Plus de Joanna Hicks (20)

SIMLESA: one year later. Mulugetta Mekuria
SIMLESA: one year later. Mulugetta MekuriaSIMLESA: one year later. Mulugetta Mekuria
SIMLESA: one year later. Mulugetta Mekuria
 
Towards sustainable intensification of Maize-Legume cropping systems: Kenya e...
Towards sustainable intensification of Maize-Legume cropping systems: Kenya e...Towards sustainable intensification of Maize-Legume cropping systems: Kenya e...
Towards sustainable intensification of Maize-Legume cropping systems: Kenya e...
 
Making CA ever green. Dennis Garrity
Making CA ever green. Dennis GarrityMaking CA ever green. Dennis Garrity
Making CA ever green. Dennis Garrity
 
Adoption of CA practices: evidence of interdependence in plot level farmer te...
Adoption of CA practices: evidence of interdependence in plot level farmer te...Adoption of CA practices: evidence of interdependence in plot level farmer te...
Adoption of CA practices: evidence of interdependence in plot level farmer te...
 
Soil and yield improvements from controlled traffic farming on a red chromoso...
Soil and yield improvements from controlled traffic farming on a red chromoso...Soil and yield improvements from controlled traffic farming on a red chromoso...
Soil and yield improvements from controlled traffic farming on a red chromoso...
 
Comparison of different soil tillage systems, under several crop rotations in...
Comparison of different soil tillage systems, under several crop rotations in...Comparison of different soil tillage systems, under several crop rotations in...
Comparison of different soil tillage systems, under several crop rotations in...
 
The effects of minimum and conventional tillage systems on maize grain yield ...
The effects of minimum and conventional tillage systems on maize grain yield ...The effects of minimum and conventional tillage systems on maize grain yield ...
The effects of minimum and conventional tillage systems on maize grain yield ...
 
Controlled traffic/permanent bed farming reduces GHG emissions. Jeff Tullberg
Controlled traffic/permanent bed farming reduces GHG emissions. Jeff TullbergControlled traffic/permanent bed farming reduces GHG emissions. Jeff Tullberg
Controlled traffic/permanent bed farming reduces GHG emissions. Jeff Tullberg
 
Controlled traffic farming, productivity, sustainability and resilience: outc...
Controlled traffic farming, productivity, sustainability and resilience: outc...Controlled traffic farming, productivity, sustainability and resilience: outc...
Controlled traffic farming, productivity, sustainability and resilience: outc...
 
Production systems for the future: balancing trade-offs between food producti...
Production systems for the future: balancing trade-offs between food producti...Production systems for the future: balancing trade-offs between food producti...
Production systems for the future: balancing trade-offs between food producti...
 
Sustainable intensification of maize-bean production among smallholder farmer...
Sustainable intensification of maize-bean production among smallholder farmer...Sustainable intensification of maize-bean production among smallholder farmer...
Sustainable intensification of maize-bean production among smallholder farmer...
 
Nitrogen is essential to capture the benefit of summer rainfall for wheat in ...
Nitrogen is essential to capture the benefit of summer rainfall for wheat in ...Nitrogen is essential to capture the benefit of summer rainfall for wheat in ...
Nitrogen is essential to capture the benefit of summer rainfall for wheat in ...
 
Biomass shifts and suppresses weed populations under CA. Michael Mulvaney
Biomass shifts and suppresses weed populations under CA. Michael MulvaneyBiomass shifts and suppresses weed populations under CA. Michael Mulvaney
Biomass shifts and suppresses weed populations under CA. Michael Mulvaney
 
Stubble retention in cropping in South East Australia: benefits and challenge...
Stubble retention in cropping in South East Australia: benefits and challenge...Stubble retention in cropping in South East Australia: benefits and challenge...
Stubble retention in cropping in South East Australia: benefits and challenge...
 
Agroforestry adaptation and mitigation options for smallholder farmers vulner...
Agroforestry adaptation and mitigation options for smallholder farmers vulner...Agroforestry adaptation and mitigation options for smallholder farmers vulner...
Agroforestry adaptation and mitigation options for smallholder farmers vulner...
 
Reducing the cost of complexity for greater farming system change. Rick Llewe...
Reducing the cost of complexity for greater farming system change. Rick Llewe...Reducing the cost of complexity for greater farming system change. Rick Llewe...
Reducing the cost of complexity for greater farming system change. Rick Llewe...
 
Exploring hotspots in the carbon footprint and energy use profiles of fresh t...
Exploring hotspots in the carbon footprint and energy use profiles of fresh t...Exploring hotspots in the carbon footprint and energy use profiles of fresh t...
Exploring hotspots in the carbon footprint and energy use profiles of fresh t...
 
Adopt: adoption and diffusion outcome prediction tool. Geoff Kuehne
Adopt: adoption and diffusion outcome prediction tool. Geoff KuehneAdopt: adoption and diffusion outcome prediction tool. Geoff Kuehne
Adopt: adoption and diffusion outcome prediction tool. Geoff Kuehne
 
To mix or not to mix: evidences for the unexpected high productivity of new a...
To mix or not to mix: evidences for the unexpected high productivity of new a...To mix or not to mix: evidences for the unexpected high productivity of new a...
To mix or not to mix: evidences for the unexpected high productivity of new a...
 
The expected value of seasonal streamflow forecasts to a grain-cotton irrigat...
The expected value of seasonal streamflow forecasts to a grain-cotton irrigat...The expected value of seasonal streamflow forecasts to a grain-cotton irrigat...
The expected value of seasonal streamflow forecasts to a grain-cotton irrigat...
 

Dernier

BAG TECHNIQUE Bag technique-a tool making use of public health bag through wh...
BAG TECHNIQUE Bag technique-a tool making use of public health bag through wh...BAG TECHNIQUE Bag technique-a tool making use of public health bag through wh...
BAG TECHNIQUE Bag technique-a tool making use of public health bag through wh...Sapna Thakur
 
Sanyam Choudhary Chemistry practical.pdf
Sanyam Choudhary Chemistry practical.pdfSanyam Choudhary Chemistry practical.pdf
Sanyam Choudhary Chemistry practical.pdfsanyamsingh5019
 
Measures of Dispersion and Variability: Range, QD, AD and SD
Measures of Dispersion and Variability: Range, QD, AD and SDMeasures of Dispersion and Variability: Range, QD, AD and SD
Measures of Dispersion and Variability: Range, QD, AD and SDThiyagu K
 
The basics of sentences session 2pptx copy.pptx
The basics of sentences session 2pptx copy.pptxThe basics of sentences session 2pptx copy.pptx
The basics of sentences session 2pptx copy.pptxheathfieldcps1
 
BASLIQ CURRENT LOOKBOOK LOOKBOOK(1) (1).pdf
BASLIQ CURRENT LOOKBOOK  LOOKBOOK(1) (1).pdfBASLIQ CURRENT LOOKBOOK  LOOKBOOK(1) (1).pdf
BASLIQ CURRENT LOOKBOOK LOOKBOOK(1) (1).pdfSoniaTolstoy
 
Introduction to Nonprofit Accounting: The Basics
Introduction to Nonprofit Accounting: The BasicsIntroduction to Nonprofit Accounting: The Basics
Introduction to Nonprofit Accounting: The BasicsTechSoup
 
SOCIAL AND HISTORICAL CONTEXT - LFTVD.pptx
SOCIAL AND HISTORICAL CONTEXT - LFTVD.pptxSOCIAL AND HISTORICAL CONTEXT - LFTVD.pptx
SOCIAL AND HISTORICAL CONTEXT - LFTVD.pptxiammrhaywood
 
Advanced Views - Calendar View in Odoo 17
Advanced Views - Calendar View in Odoo 17Advanced Views - Calendar View in Odoo 17
Advanced Views - Calendar View in Odoo 17Celine George
 
Student login on Anyboli platform.helpin
Student login on Anyboli platform.helpinStudent login on Anyboli platform.helpin
Student login on Anyboli platform.helpinRaunakKeshri1
 
Nutritional Needs Presentation - HLTH 104
Nutritional Needs Presentation - HLTH 104Nutritional Needs Presentation - HLTH 104
Nutritional Needs Presentation - HLTH 104misteraugie
 
Arihant handbook biology for class 11 .pdf
Arihant handbook biology for class 11 .pdfArihant handbook biology for class 11 .pdf
Arihant handbook biology for class 11 .pdfchloefrazer622
 
Grant Readiness 101 TechSoup and Remy Consulting
Grant Readiness 101 TechSoup and Remy ConsultingGrant Readiness 101 TechSoup and Remy Consulting
Grant Readiness 101 TechSoup and Remy ConsultingTechSoup
 
Q4-W6-Restating Informational Text Grade 3
Q4-W6-Restating Informational Text Grade 3Q4-W6-Restating Informational Text Grade 3
Q4-W6-Restating Informational Text Grade 3JemimahLaneBuaron
 
fourth grading exam for kindergarten in writing
fourth grading exam for kindergarten in writingfourth grading exam for kindergarten in writing
fourth grading exam for kindergarten in writingTeacherCyreneCayanan
 
1029-Danh muc Sach Giao Khoa khoi 6.pdf
1029-Danh muc Sach Giao Khoa khoi  6.pdf1029-Danh muc Sach Giao Khoa khoi  6.pdf
1029-Danh muc Sach Giao Khoa khoi 6.pdfQucHHunhnh
 
Disha NEET Physics Guide for classes 11 and 12.pdf
Disha NEET Physics Guide for classes 11 and 12.pdfDisha NEET Physics Guide for classes 11 and 12.pdf
Disha NEET Physics Guide for classes 11 and 12.pdfchloefrazer622
 
Kisan Call Centre - To harness potential of ICT in Agriculture by answer farm...
Kisan Call Centre - To harness potential of ICT in Agriculture by answer farm...Kisan Call Centre - To harness potential of ICT in Agriculture by answer farm...
Kisan Call Centre - To harness potential of ICT in Agriculture by answer farm...Krashi Coaching
 
Holdier Curriculum Vitae (April 2024).pdf
Holdier Curriculum Vitae (April 2024).pdfHoldier Curriculum Vitae (April 2024).pdf
Holdier Curriculum Vitae (April 2024).pdfagholdier
 

Dernier (20)

Código Creativo y Arte de Software | Unidad 1
Código Creativo y Arte de Software | Unidad 1Código Creativo y Arte de Software | Unidad 1
Código Creativo y Arte de Software | Unidad 1
 
BAG TECHNIQUE Bag technique-a tool making use of public health bag through wh...
BAG TECHNIQUE Bag technique-a tool making use of public health bag through wh...BAG TECHNIQUE Bag technique-a tool making use of public health bag through wh...
BAG TECHNIQUE Bag technique-a tool making use of public health bag through wh...
 
Sanyam Choudhary Chemistry practical.pdf
Sanyam Choudhary Chemistry practical.pdfSanyam Choudhary Chemistry practical.pdf
Sanyam Choudhary Chemistry practical.pdf
 
Measures of Dispersion and Variability: Range, QD, AD and SD
Measures of Dispersion and Variability: Range, QD, AD and SDMeasures of Dispersion and Variability: Range, QD, AD and SD
Measures of Dispersion and Variability: Range, QD, AD and SD
 
The basics of sentences session 2pptx copy.pptx
The basics of sentences session 2pptx copy.pptxThe basics of sentences session 2pptx copy.pptx
The basics of sentences session 2pptx copy.pptx
 
BASLIQ CURRENT LOOKBOOK LOOKBOOK(1) (1).pdf
BASLIQ CURRENT LOOKBOOK  LOOKBOOK(1) (1).pdfBASLIQ CURRENT LOOKBOOK  LOOKBOOK(1) (1).pdf
BASLIQ CURRENT LOOKBOOK LOOKBOOK(1) (1).pdf
 
Introduction to Nonprofit Accounting: The Basics
Introduction to Nonprofit Accounting: The BasicsIntroduction to Nonprofit Accounting: The Basics
Introduction to Nonprofit Accounting: The Basics
 
SOCIAL AND HISTORICAL CONTEXT - LFTVD.pptx
SOCIAL AND HISTORICAL CONTEXT - LFTVD.pptxSOCIAL AND HISTORICAL CONTEXT - LFTVD.pptx
SOCIAL AND HISTORICAL CONTEXT - LFTVD.pptx
 
Advanced Views - Calendar View in Odoo 17
Advanced Views - Calendar View in Odoo 17Advanced Views - Calendar View in Odoo 17
Advanced Views - Calendar View in Odoo 17
 
Student login on Anyboli platform.helpin
Student login on Anyboli platform.helpinStudent login on Anyboli platform.helpin
Student login on Anyboli platform.helpin
 
Nutritional Needs Presentation - HLTH 104
Nutritional Needs Presentation - HLTH 104Nutritional Needs Presentation - HLTH 104
Nutritional Needs Presentation - HLTH 104
 
Arihant handbook biology for class 11 .pdf
Arihant handbook biology for class 11 .pdfArihant handbook biology for class 11 .pdf
Arihant handbook biology for class 11 .pdf
 
INDIA QUIZ 2024 RLAC DELHI UNIVERSITY.pptx
INDIA QUIZ 2024 RLAC DELHI UNIVERSITY.pptxINDIA QUIZ 2024 RLAC DELHI UNIVERSITY.pptx
INDIA QUIZ 2024 RLAC DELHI UNIVERSITY.pptx
 
Grant Readiness 101 TechSoup and Remy Consulting
Grant Readiness 101 TechSoup and Remy ConsultingGrant Readiness 101 TechSoup and Remy Consulting
Grant Readiness 101 TechSoup and Remy Consulting
 
Q4-W6-Restating Informational Text Grade 3
Q4-W6-Restating Informational Text Grade 3Q4-W6-Restating Informational Text Grade 3
Q4-W6-Restating Informational Text Grade 3
 
fourth grading exam for kindergarten in writing
fourth grading exam for kindergarten in writingfourth grading exam for kindergarten in writing
fourth grading exam for kindergarten in writing
 
1029-Danh muc Sach Giao Khoa khoi 6.pdf
1029-Danh muc Sach Giao Khoa khoi  6.pdf1029-Danh muc Sach Giao Khoa khoi  6.pdf
1029-Danh muc Sach Giao Khoa khoi 6.pdf
 
Disha NEET Physics Guide for classes 11 and 12.pdf
Disha NEET Physics Guide for classes 11 and 12.pdfDisha NEET Physics Guide for classes 11 and 12.pdf
Disha NEET Physics Guide for classes 11 and 12.pdf
 
Kisan Call Centre - To harness potential of ICT in Agriculture by answer farm...
Kisan Call Centre - To harness potential of ICT in Agriculture by answer farm...Kisan Call Centre - To harness potential of ICT in Agriculture by answer farm...
Kisan Call Centre - To harness potential of ICT in Agriculture by answer farm...
 
Holdier Curriculum Vitae (April 2024).pdf
Holdier Curriculum Vitae (April 2024).pdfHoldier Curriculum Vitae (April 2024).pdf
Holdier Curriculum Vitae (April 2024).pdf
 

Short term intensive rotational grazing in native pasture: effects on soil nitrate and extractable P. Gholamreza Sanjari

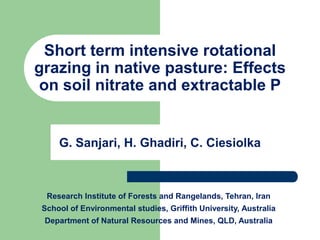
  • 1. Short term intensive rotational grazing in native pasture: Effects on soil nitrate and extractable P G. Sanjari, H. Ghadiri, C. Ciesiolka Research Institute of Forests and Rangelands, Tehran, Iran School of Environmental studies, Griffith University, Australia Department of Natural Resources and Mines, QLD, Australia
  • 2. Outline  Introduction  Currajong project  Location and climate  Grazing treatments  Soil analysis  Results  Soil Organic Carbon and Nitrogen  Soil nitrate and extractable P  Sheep camp results  Conclusion
  • 3. Introduction  Livestock industry is of main sources responsible for downstream water pollution
  • 4. Introduction (continue) Standards for the pollutants In water: • The maximum concentration of nitrate allowed in drinking water is 10 mg/L. • For aquatic life, nitrate level more than 4 mg/L considered as pollution problem • Biological growth can be stimulated when Dissolved reactive P (DRP) exceeds 0.01 mg/L In soil solutions: • Environmental concern arise when the nutrient level in soil profile exceed 160 kg/ha for nitrate and 330 kg/ha for available P
  • 5. Introduction (continue) Grazing behavior and animal waste concern in native pasture Grazing animals: • Recycle 75 – 85% of forage they consume • Don’t graze pasture uniformly • Distribute deposits mainly around food and water troughs, under shades, along fence lines, etc Outcomes of a continual grazing: • Imbalanced distribution of nutrients • Nutrient depletion across paddocks • Low pasture productivity • Animal camp site development and environmental concern on water contamination Sheep Camp
  • 6. Introduction (continue) Grazing practices affect soil health and water quality Continuous grazing (large paddock) • Increasing runoff and soil loss and low productivity • Grazing animals are free to congregate • Encourages animal camp development Rotational grazing (small paddocks) • Includes rest periods for pasture recovery after grazing operations • Better runoff and soil loss control • Discourages animal congregation • More balanced distribution of animal wastes
  • 7. Currajong case study Short term Intensive Rotational Grazing (SIRG) vs. yearlong Continuous Grazing (CG) Soil parameters: Q u e e n s la n d • Organic Carbon (SOC) • M u rra y D a rlin g B a s in Organic Nitrogen (SON) • Nitrate-Nitrogen Location: the data C u rra jo n g • Extractable P Property of Currajong Southeast Queensland
  • 8. Currajong study (continue) Climate Sep Rainfall: Dry Season Oct Long term annual: 645 mm 31% Wet season 69% Apr Mar Soil: Up to 50 cm in depth Brown to dark clay loam Vegetation: Open Eucalypt woodland with understorey of perennial grass species Dominant species: Dichanthium sericem
  • 9. Currajong study (continue) Methods: Stocking properties Grazing Grazing periods Rest periods SR DDH Treatments (days) (days) (dse/ha) dse.day/ha Short intensive rotational 14 9‡ (101 60)‡ 12.6 6‡ 3608 Continuous 365 0 1.6 0.2 3529 DDH- Number of dse days per hectare over the whole study period; ‡- Means 1SD; SR- Stocking rate 20 18 16 14 Stocking rate DSE/H 12 10 8 6 4 2 0 1/01/00 1/05/00 1/09/00 1/01/01 1/05/01 1/09/01 1/01/02 1/05/02 1/09/02 1/01/03 1/05/03 1/09/03 1/01/04 1/05/04 1/09/04 1/01/05 1/05/05 1/09/05 1/01/06 1/05/06 Continuous grazing Short intensive rotational grazing
  • 10. Currajong study (continue) Methods: Soil analysis Soil Organic Carbon: Rapid wet oxidation (Walkley and Black) Soil Organic Nitrogen: Semimicro Kjeldahl procedure (Bremner 1996) Nitrate and Ammonium: 2 M KCL solution extraction (Bremner Keeney 1966), auto analyzer (Lachat 2001) Extractable P 0.5 M NaHCO3 Orthophosphate extraction (Colwell 1963), colorimetric procedure (Murphy and Riley 1962)
  • 11. Currajong study (continue) Results: SOC & SON (treatments) 2001 2006 ns 2001 2006 30.0 ns 2.4 ns p<16 ns p<29 SOC tonne/ha 27.5 SON tonne/h a 2.2 ns ns p<25 25.0 2.0 22.5 1.8 20.0 Not 1.6 Short intensive Continuous grazed Short intensive Continuous Not rotational grazing grazing rotational grazing grazing grazed
  • 12. Currajong study (continue) Results: SOC & SON (sub-treatments) 2001 2006 2001 2006 3.0 ns 32.0 p<18 * p<10 ns ns 2.5 SON tonne/ha SOC tonne/ha ns ns 28.0 ns 2.0 ns 24.0 1.5 20.0 1.0 C1 C2 C3 C4 C1 C2 C3 C4 Short intensive Continuous Short intensive Continuous rotational grazing grazing rotational grazing grazing
  • 13. Currajong study (continue) Results: Nitrate & Extractable P Ammonium concentration In grazing exclusion: 2001 4.56 mg/kg 6.0 2006 13.69 mg/kg 2001 2006 2001 20 2006 4.5 Kg/ha Kg/ha Extractable P 3.0 NO3-N 10 1.5 0.0 0 Short intensive Continuous Not Short intensive Continuous Not rotational grazing grazing grazed rotational grazing grazing grazed
  • 14. Currajong study (continue) Results: Nitrate & Extractable P (continue) 3500 Herbage mass kg/ha 3000 Rotational grazing 2500 Increase in herbage mass 2000 Continuous grazing 1500 1000 May 01 Feb 02 Mar 03 Mar 04 Feb 05 Feb 06 May 06 2000 Date of sam pling Short intensive rotational grazing 1600 Continuous grazing Mass of residue kg/ha 1200 800 Increase in Residue 400 0 0 268 683 1047 1367 1737 1824 May 01 Days May 06
  • 15. Currajong study (continue) Results: Nitrate & Extractable P (Sheep camp effects) 100 1000 NO3 concentration (kg/ha in 0-10 cm) PO4 concentration (kg/ha in 0-10 cm) 10 100 NO3 2001 Sheep camp vegetation: 1 PO4 2001 10 Couch grass 0.1 PO4 2006 1 Agropyron repense (L.) P.Beauv NO3 2006 0.01 0.1 0 100 200 300 400 500 Distance from sheep camp (m) Couch grass regrowth: Herbage mass Rest period Kg/ha DM days 2650 26 3685 60
  • 16. Currajong study (continue) Results: Nitrate & Extractable P (Sheep camp effects) Nitrate Phosphate Kg/ha Kg/ha Soil analysis: 2001 126 222 2006 17.6 79.3 Thresholds 160 330 Water analysis: Sampled on 22/01/06 Water analysis: Time (min) 6 15 25 34 Sampled in 2001 NO3-N (Mg/L) 0.143 0.189 0.133 0.100 NO3-N 3.4 Mg/L DRP (Mg/L) 0.062 0.013 0.137 0.141 DRP 2.5 Mg/L
  • 17. Conclusion  Continuous grazing encourages animal aggregation to develop camp sites with large deposits of animal wastes raising alarm for downstream water contamination  In the study area we found the above threat could be easily the case at regional scale with more camp site development under continuous grazing  Short period Intensive Rotational Grazing (SIRG) in the native pasture, modified the aggregation behavior of animals, leading to a major decrease in soil nitrate and extractable P concentrations  The rotational grazing provides an environmentally oriented pasture utilization giving a more forage production over continuous grazing

Notes de l'éditeur

  1. Ladies and gentlemen; what I am going to present is the effects of a newly adopted grazing practice on soil available nutrients. The presentation includes a small review of literature followed by presenting the results of a case study carried out in semi arid region of Australia. The case study shows how the new practice in grazing lands reduces the risk of soil soluble nitrogen and phosphorus on contamination of downstream water bodies.
  2. We all know about the growing environmental concern of surface and ground waters pollution by animal wastes. High loading rates of contaminants to soils and waters can occur from animal operations, such as grazing. High N concentrations entering streams or lakes may also contribute to eutrophication. Phosphate is adsorbed onto sediments and can be transported with runoff to lakes and streams where its most significant effect is eutrophication.
  3. The maximum nitrate concentration should not be more than 10 ppm in drinking water as it’s harmful to young babies. Nitrate at around 20 ppm cause blue baby syndrome. The standards are most restricted for aquatic life. That is why the concentration of above 4 mg/L is considered pollution problem for aquatic life including fish etc.Regarding the phosphorus, dissolved reactive P in water can stimulate biological growth when the concentration exceed 0.01 ppm. Excessive Plant Growth and the subsequent decay uses up all the oxygen which results in mass dead fish.To be proactive we need to monitor the pollutants concentration at soil solution level before they are washed off into the streams. Although there is no a globally recognized guideline however there is a recommendation of 160 kg/ha for nitrate and 330 kg/ha for extractable as the maximum concentrations developed by Manitoba University researchers.According to Johnson and Eckert (1995) and Ewanek (1995), concern about losses of P and N by overland flow and the contamination of downstream water, arises when nitrate and available P concentrations in soil profiles exceed 160 kg/ha and 330 kg/ha respectively. The total available nutrient measured from the soil profile inside the camp showed the concentration of nitrate decreased sharply from 126 in 2001 to 17.6 kg/ha in 2006 and similarly available P declined from 222 in 2001 to 79.3 kg/ha in 2006. Although the results indicate that the nutrient concentrations obtained in 2001 in particular for nitrate are a little below the thresholds quoted by the above authors nevertheless, the environmental concerns about continuous grazing still remain, as many animal aggregation sites are normally established around feed lots, water troughs and in unproductive areas where no vegetation exist to uptake even minimum amount of available nutrients. From the other hand, much lower nutrient concentrations measured on 2006 under the sheep camp, once again showed that TC grazing is able to reduce the animal aggregation behavior, which in turn significantly decreases the potential for the contamination of downstream water bodies.Johnson J &amp; Eckert D. (1995), &apos;Best management practices: land application of animal manure&apos;, last updated: 8th Sep 2004, Retrieved Nov 2007 from http://ohioline.osu.edu/agf-fact/0208.html. Ewanek J (1995), &apos;Survey of nitrate-nitrogen in the soil profile under different field management practices in Manitoba&apos;, The 39th Annual Manitoba Society of Soil Science Meeting, University of Manitoba, Winnipeg, MB, pp. 62-65.Phosphorus LeachingPhosphorus is considered as a pollutant due to its effects of promoting algal growth and eutrophication of surface waters. At very low P concentrations, biological growth can be stimulated when dissolved reactive P concentration exceeds 0.01 mg L -1. Traditionally, most data on P movement in soil were obtained from soil analysis of extractable P as a function of depth, which has led to the general assumption that no substantial vertical P movement or leaching loss occurs because of high P-fixation capacity in many mineral soils. Nevertheless phosphorus can be lost from the soil if the amount applied exceeds the sorption capacity of the soil and the rate of uptake by plant roots.Excessive Plant Growth and the subsequent decaying plants uses up all the oxygen which results in mass dead fish. Therefore standards are lower then they are for drinking water sources. Excessive Plant Growth – can decrease the aesthetic value of water bodies by making the water cloudy or causing unsightly smelly mats of decaying plants on the shore. Decomposition of plants uses up all of the oxygen in the water. Plant Uptake – When plants are growing they use a lot of nitrate, in the fall and winter when plants die, the nitrate is released back into the water and concentrations increase. What pollutants would affect agricultural use? Salts (TDS for irrigation limit = 1200 mg/liter; TDS for stock watering = 2000 mg/l) and metals: arsenic, chromium, copper, cadmium, lead and seleniumYou may want to mention the phosphorus and nitrogen connection here … i.e the cascading effect leading to low oxygen, noxious plants in the water, etc.Also note that water doesn’t hold a lot of oxygen….only about 12 parts per million max.when oxygen concentrations get extremely low, some metals and other elements (such as phosphorus) redissolve from the sediments. These dissolved forms are more reactive, often more toxic. ~12ppm is max depending on elevation
  4. In native pasture, where no fertilizer or external forage are applied the environmental pollution may still be case. Grazing animals recycle between 75 to 85% of forage nutrients consumed and redistribute them back across the pasture. More balanced distribution of nutrients throughout a paddock is the main key for a productive pasture and animal growth.Unfortunately, grazing animals do not graze pasture evenly resulted in imbalanced distribution of urine and feces across the paddocks.They tend to leave manure piles or urine spots around food and water sources, on side hills, around water troughs, in depressions, along fence lines, and in other areas of animal congregation and manure deposition.In one rotational grazingstudy, urine spots occupied 16.7% of the pasture, while manure spots occupied 18.8%, following 504 grazing days per acre (49). Intensity of grazingrotations affects the distribution of manure coverage in paddocks. Under continuous, extensive grazing practices, 27 years would be neededto obtain one manure pile on every square yard within a paddock; if a two-day rotation were used instead only two years would be needed (42).Nutrient concentration within pastures results from the tendency of grazing animals to congregate. They tend to leave manure piles or urinespots around food and water sources, on side hills, in depressions, along fence lines, and under are another area of animal congregationand manure deposition. When animals have to walk more than 400 feet from the pasture pastureshade. Sheep have a greater tendency thancattle to congregate and deposit manure in these areas (50). Prevailing wind direction and exposure to sunlight can also affect animal movement,congregation, and manure deposition (51). Laneways that connect pastures or lead to watering areas to water, they deposit between 13 and 22% of their manure on laneways.Nutrients are concentrated in these congregation areas because animals transport nutrients from areas where they graze. Consequently, they also deplete nutrients from the grazing areas. Grazing practices that encourage foraging and manure distribution across paddocks and discourage congregation in limited areas will improve nutrient balances within pastures.By working with the normal foraging and herding behavior of grazing animals, distribution of animals across paddocks can be encouraged.In larger paddocks, animals tend to graze and lounge as a herd, while they distribute themselves more evenly across smaller paddocks (41).In larger paddocks, animals visit water, minerals, shade, and fly-control devices as a herd, whereas animals concentrated within small paddockstend to visit these areas one-by-one. Locating nutrients, shade, and pest-control devices farther apart in the paddock further discouragesconcentration of animals and manure. If a particular area of a paddock is deficient in nutrients, placement of supplemental feeds in that area can be used to encourage congregation and manure deposition there.Turbidity is the suspended matter in the water. Sediment is eroded soil or sand that has entered a waterway. The sediment smothers aquatic habitat, carries pollutants, and reduces water clarity. Waters that are high in sediment will often appear cloudy or muddy. The sediment covers spawning gravels, clogs fish gills, introduces nutrients such as phosphorus into the water, changes water temperatures, and degrades water quality.Why do we care about sediments in streams and lakes?Can fill space between cobble in stream and smother fish eggs and tiny aquatic lifeVery cloudy water affects visual predatorsSediments fill in reservoirs Sediments bring nutrients, metals, and more into water
  5. Grazing practices can modify animal grazing behaviour to achieve a better nutrient redistribution across paddocks. Conventional grazing including continuous grazing is largely documented to increase runoff and soil loss. Under continuous grazing that are normally practiced in large paddocks, grazing animals are free to congregate. Such a practice over a long period results in large accumulation of animal wastes in some parts of paddocks that may be of serious concern for downstream water bodies.Despite continuous grazing, in rotational grazing a group of small paddocks are used. In this practice a large mob of animals are moved between the paddocks for short period of time followed by a relatively long rest period. Rotational grazing is more reported to reduce the negative effects of continual grazing on runoff, soil loss and nutrient deposition across paddocks. A research conducted in USA showed that manure nutrients were distributed more evenly across the landscape when a field was managed using 12 or 24 paddocks rather than only three paddocks. As we see ......Animals in the smaller paddocks concentrated around favored areas for less timethan did animals in larger paddocks. Since animals tend to graze along the perimeter of fence lines, they distribute nutrients most evenly acrosspaddocks that are small, square, and have water available (55).A research in and animal camp developement is intensity refers to the impact animals have on forage growth and reproduction and on soil and water quality. It is influenced by animalforaging habits, stocking rates, the length of time animals are allowed to graze within a given paddock, and the relation these factors have to soil characteristics and climatic conditions.Continuous high-intensity grazing depletes soil nutrients, decreases the diversity of forage species, inhibits the ability of some forage plants to regrowand reproduce, and increases the potential for nutrient runoff and erosion. Conversely, shortterm high-intensity grazing combined with a resting period (as in rotational grazing practices) causes an increase in the diversity of forage species, enhances the dispersal of forage seeds, and helps conserve nutrient resources within the soil plant system.Subdividing depressions, side hills, and shady areas among several paddocks can enhance nutrient distribution across the landscape.Research conducted in Missouri showed that manure nutrients were distributed more evenly across the landscape when a field was managedusing 12 or 24 paddocks rather than only three paddocks (54). Animals in the smaller paddocks concentrated around favored areas for less timethan did animals in larger paddocks. Since animals tend to graze along the perimeter of fence lines, they distribute nutrients most evenly acrosspaddocks that are small, square, and have water available (55).
  6. Intensive short period rotational grazing is a new grazing practice in Australia and rest of the world. Many trial works carried out by graziers show a higher pasture production under this management as compared with continuous grazing resulted in rapid adoption of such grazing management by graziers. In southeast Queensland we compared the two grazing managements in terms of many aspects including potential contamination of downstream water bodies. On this regards we analysed a large number of soil samples for soil organic carbon and nitrogen, soil nitrate and extractable P.The area, known locally as Traprock, is located in the catchment of the MacIntyre Brook at the northern headwaters of the Murray Darling basin.
  7. The annual rainfall for the study area is 645 mm, with summer dominant of around 70% characterized by relatively high frequency of medium to large events of short (thunderstorms), and long (cyclonic depressions) durations. In the dry season (April to September), there are smaller events, both in magnitude and intensity associated with frontal depressions.The soil is shallow to moderately deep with a hard setting brown to dark clay loam. Vegetation is open Eucalypt woodland with an understorey of native and naturalized perennial grass species dominated by a desirable species known as Queensland blue grass [Dichanthium sericem (R. Br.) A. Camus].
  8. The stocking rate (SR) for the two grazing treatments is expressed as dry sheep equivalent (DSE) per hectare. DSE is defined as nutritional or metabolisable energy needed to maintain a 50 kg dry sheep (non-lactating). The history of stocking rates show that Short Intensive Rotational Grazing was heavily stocked with an average number of 12.3 dse/ha over a mean grazing period of 14 days and then rested for various time averaged at 101 days.In the continuous grazing, the pasture was stocked with a constant stocking rate of around 1.6 DSE/ha throughout the years of the study that is considered normal in the region and exerts a light to moderate pressure on the pasture. There was an exception in 2002, where the grazier removed all the stock out of the paddock for a few months due to a temporary loss of dam water. Maximum efforts were made to keep the same overall grazing pressure in both grazing treatments. This was achieved by the similar total number of dse.day/ha (DDH) reported in Table. despite the fact that the grazing systems had major differences in stocking rates, grazing durations and rest periods. The similar DDH between the paddocks indicates that the stocking management by the grazier kept the overall stocking pressure equal between the treatments. Dry sheep equivalent
  9. The SOC was measured using the rapid wet oxidation method (Walkley and Black 1934) modified by Sims and Haby (1971). In this method, SOC content, after oxidising by potassium dichromate and sulfuric acid, was calculated from the amount of chromic ion (Cr3+) formed using a colourimetric procedure measuring absorbance at 588 nm.The SON was determined using a semimicro-Kjeldahl procedure (Bremner 1996). This involved sample digestion by concentrated sulfuric acid in the presence of a copper sulfate catalyst and potassium sulfate using a block digester followed by a colourimetric determination of NH4 in the digests (Lachat 1992). SON was the difference between Kjeldahl-N and residual NH4-N.For the measurement of inorganic N (NO3 and NH4), a 2 M KCL solution was used for extraction, with a 1 : 10 ratio of soil to extractant (Bremner and Keeney 1966). The mixture was shaken for 1 h then centrifuged at 2000 r.p.m. for 20 min and filtered through a Whatman 42 filter paper and analysed using an autoanalyser (Lachat 2001).Orthophosphate extraction was performed using the method of Colwell (1963), which is a modification of the original bicarbonate procedure(Olson et al. 1954) that employs an extracting solution of 0.5 M NaHCO3 adjusted to pH 8.5. The extracted P was determined colorimetrically by a molybdate blue method (Murphy and Riley 1962) using an autoanalyser procedure.
  10. The results show an overall increase in SOC from 2001 to 2006 under rotational grazing and decrease in no grazed treatment. But as we see, the changes are not statistically different. No changes happened for SOC under continuous grazing. The same results were found for SON for the treatments.While this decline over time is not statistically significant, the trend shows a possible negative effect of long term animal exclusion on soil organic matter. Grazing animals appear to positively contribute to nutrient cycling, plant growth, and soil biological activities of the paddock. Larger size of the ground litter in the enclosures zone compared with those of grazed areas is probably one of reasons for the decrease in soil organic matter since they would not be trampled and broken down to the smaller pieces by grazing animals. Under non-grazed treatment, another part of litter referred to as standing plant residue does not contribute to soil organic materials. This fraction which accounts for 8 – 16% of the total above ground dry matter in our experiment is possibly one of the reasons for the reduction of SOC and SON in the ungrazed area. The important role of grazing animals in converting surface litter into SOC and incorporating it with the top soil has also been reported by Naeth and Bailey (1991). Reduction in soil organic carbon and nitrogen under grazing exclusion has been also pointed out by Schuman and Reeder (1999), who measured the lower annual rate of shoot turnover for enclosures in comparison with grazed areas.
  11. In the rotational grazing we had more OC stored in soil profile where soil condition is more favourable. C1 sub-treatment has the same soil condition as C4 characterized by gentler slope and higher soil depth than C2 and C3. That is why soils of C1 and C4 have more water storage for plant growth than C2 and C3. Apart from the positive effects of SOC accumulation on soil and pasture improvement, it’s got an added dimension of carbon sequestration. Our results show that on average we had around 3 tonne/ha more carbon sequestered in top 10 cm of soil profile under the rotational grazing compared with the continuous grazing.Increased accumulation of SOC and SON under TC grazing over the continuous grazing observed in this area is consistent with those of Southorn (2002). He attributed the accumulated soil carbon to the larger proportion of plant material being incorporated into the soil under TC grazing over continuous grazing. Gillen and Mccollum (1991) suggested that the long period of rest is a key driver in the recovery of grazed species and this probably has played a major role in the study area to substantially increase the above ground organic material, followed by its subsequent incorporation into the soil resulting in increased SOM. Root decay, even though not measured in this experiment, appears to be another reason for increasing SOM under TC grazing. As it was mentioned earlier, intensive defoliation under a single grazing event after a rest period (common in TC grazing), results in ceasing respiration leading to the death of a large amount of roots within a few hours after grazing in order to equalize the biomass (Richards 1993). The quantity of root pruned in this way depending on grazing intensity and the total root mass is substantial and highly valuable for soil organic matter accumulation and other soil physical and biological improvement (Jones 2000). Root mass which is mostly reported to be more than twice that of above-ground biomass (Ross 1977; Hall &amp; Lee 1980; Christie 1981; Montaniet al. 1996) provides a large amount of vertically oriented pores after dying off, facilitating better infiltration. Fewer animals treading on the soil under TC grazing have probably had a positive indirect effect on soil carbon and nitrogen providing a faster soil physical and biological recovery following each grazing period. Abdelmagid and Trlica (1987) showed the maximum distance traveled by grazing animals under continuous grazing is around 4.8 km/day, while this distance under the short period grazing (i.e. TC grazing) is 1.6 km/day for the same stocking rate. Taking the average hoof print size of the grazing animal into consideration, the above figures suggest that around 22% of the pasture area is trampled on under continuous grazing system while this fraction is only 7% for TC grazing. The increased SOC in TC grazing treatment reported in this study has an added dimension of carbon sequestration. Our results show that on average 1.37 ton/ha extra carbon is locked up in the top 10cm of the soil under TC grazing compared with the continuous grazing . This figure was as high as 3.13 tons/ha in C1 where the soil condition is more favorable for plant growth.
  12. Over here we have the results of soil nitrate measurements sampled from entire research paddocks. It reveals a sharp significant decline in nitrate concentration by a factor of 7 from 2001 to 2006 under rotational grazing. we have no such a change in continuous grazing over the period. The lowest decline (0.17 mg/kg soil) occurred in no grazed areas where grazing animals were excluded for 6 years. Such decline in nitrate along with the reduction in soil organic matter presented earlier for no grazed treatment, shows the important role of grazing animals in nutrient cycling and pasture fertility. Therefore a pasture with long term grazing exclusion is subject to a lower productivity.Unlike the decrease in nitrate under grazing exclusion, soil ammonium concentration increased significantly from 4.56 in 2001 to 13.69 mg/kg in 2006. This result supports the concept that NH4 concentration increases from a minimum in the first successional stage to a maximum in the climax and vice versa for NO3-N. In other words, under grassland ecosystems when herbivores are left out of pasture for a long time, soil available nitrogen is kept more in the form of ammonium which is less subject to leaching than nitrate.The graphs showing NO3:TON ratio for the grazing treatments illustrate the same fluctuations as nitrate nitrogen.On this graphs of extractable P, phosphate decreased in all the treatments with more significant reduction under rotational grazing. Despite nitrate that easily transported by water, phosphorous is less mobile and only excreted in faeces by animals. It is highly attached to clay particles in soil and similar to organic phosphorous in dungs and manure could be transported through runoff and sediment and this might be the main reason for the decline reported during the study in continuous grazing.A marked reduction in soil nitrate concentration in C1 and C2 (Fig 5.4c) along with an increase in C:N ratio (Fig 5.3) over time probably indicate that nitrogen and carbon immobilization by plants and micro-organisms have been the dominant process over mineralization, contributing to the relatively higher soil organic mater accumulation 103 under TC grazing practice (Fig 6.1). In continuous grazing treatment however, decrease in the C:N ratio and increase in NO3:TON ratio particularly under C3 indicates that mineralization has been probably the dominant process resulting in a decrease in soil organic matter.
  13. We can ask what are the main factors responsible for the decline in soil available nitrogen and phosphorous under rotational grazing?We believe that higher pasture production achieved under rotational grazing could be the main cause of such a decline. High herbage mass and the subsequent increase in residue accumulation driven by the rotational grazing in study area requires more nutrient to take up resulting in the decline in soil nitrate and phosphate.
  14. As I pointed out earlier, animal camp sites are largely developed under continuous grazing. Over here we have an historical sheep camp six year after conversion of continuous grazing to the rotational. We carried out soil measurement from 0 to 10 cm along a 500 meter permanent transact away from the center of the camp. The results showed major decline in both nitrate and extractable P from 2001 to 2006. In the middle of the camp we had a sharp decrease of up to 13 fold for nitrate and 3 fold for available phosphorus and this is a big achievement for rotational grazing. Such a decrease is even more highlighted in surrounding areas.Such achievement to reduce large quantities of animal wastes in the aggregation camp relies on the vegetation growth habits, favourable wether condition and soil moisture as well as grazing management which applies long rest periods for pasture recovery. Under the rotational grazing, couch grass as the dominant species established in the sheep camp area has a high chance of receiving consecutive rain events during the grazing exclusions. Such a condition provides the plant with an exceptional opportunity to launch a rapid re-growth and take up large quantities of nutrients over a long period of time producing high amount of herbage following each grazing event.To have an idea of the amount of herbage produced during rest period in sheep camp, our records show a regrowth of 2650 kg/ha over a 26 days and 3685 kg/ha over a 60 days rest period.rest periods. Under continuous grazing however, the yearlong presence of animals in the paddock inhibit such a re-growth resulting in less nutrient consumption by the vegetation. The second reason is the effect of smaller paddock size under TC grazing compared with continuous grazing, which reduces the uneven distribution of the fecal materials across the paddocks and therefore less faces and urine are deposited on the camp site (Haynes &amp; Williams 1993; Gerrishet al. 1994; Mueller &amp; Green 1995).
  15. Measuring the whole nutrient content of the soil profile, we had the total nitrate of 126 kg/ha in 2001 which reduced to 17.6 in 2006. For available phosphorous it moved from 222 to 79.3 kg/ha during the same period. Taking into account the soil critical thresholds for the above nutrients, we have the values below the thresholds for 2001 which is much more highlighted after 5 years application of rotational grazing in 2006.We also had some nutrients measurement in 2006 from water running the flume installed at the outlet of the catchment where the sheep camp is located in. The results show all the records had concentrations below 1 ppm which is much less than those averaged at 3.4 for nitrate and 2.5 ppm for dissolved reactive P in 2001. According to Johnson and Eckert (1995) and Ewanek (1995), concern about losses of P and N by overland flow and the contamination of downstream water, arises when nitrate and available P concentrations in soil profiles exceed 160 kg/ha and 330 kg/ha respectively. The total available nutrient measured from the soil profile inside the camp showed the concentration of nitrate decreased sharply from 126 in 2001 to 17.6 kg/ha in 2006 and similarly available P declined from 222 in 2001 to 79.3 kg/ha in 2006. Although the results indicate that the nutrient concentrations obtained in 2001 in particular for nitrate are a little below the thresholds quoted by the above authors nevertheless, the environmental concerns about continuous grazing still remain, as many animal aggregation sites are normally established around feed lots, water troughs and in unproductive areas where no vegetation exist to uptake even minimum amount of available nutrients. From the other hand, much lower nutrient concentrations measured on 2006 under the sheep camp, once again showed that TC grazing is able to reduce the animal aggregation behavior, which in turn significantly decreases the potential for the contamination of downstream water bodies.