Real Estate Statistics for Ocean City, NJ
•
0 j'aime•334 vues

Add your description, Ocean City, New Jersey, Zip Code, provided by REALTORS® Property Resource, RPR, as of July 28th, 2016, 9:22 AM. - John Mayfield - Contact Info.

Recommandé
Recommandé
Contenu connexe
Tendances
Tendances (20)
Similaire à Real Estate Statistics for Ocean City, NJ
Similaire à Real Estate Statistics for Ocean City, NJ (20)
Plus de John Mayfield
Plus de John Mayfield (20)
Dernier
Dernier (20)
Real Estate Statistics for Ocean City, NJ
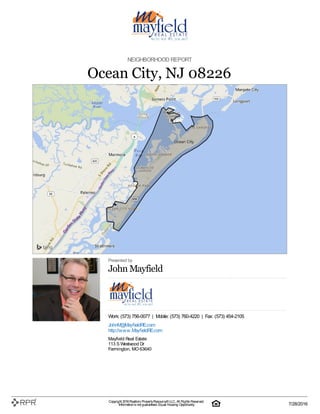
- 1. NEIGHBORHOOD REPORT Ocean City, NJ 08226 Presented by John Mayfield Work: (573) 756-0077 | Mobile: (573) 760-4220 | Fax: (573) 454-2105 JohnM@MayfieldRE.com http://www.MayfieldRE.com Mayfield Real Estate 113 S Westwood Dr Farmington, MO 63640 Copyright 2016Realtors PropertyResource®LLC. All Rights Reserved. Informationis not guaranteed. Equal Housing Opportunity. 7/28/2016
- 2. Median Sales Price Sales Volume MedianSales Price vs. Sales Volume Thischart comparesthe price trend and salesvolume for homesin an area. Home pricestypically followsales volume, with a time lag, since sales activity isthe driver behind price movements. Data Source: Public recordsdata Update Frequency: Monthly Neighborhood: Housing Stats and Charts 08226 Cape May County New Jersey USA Median Estimated Home Value $542K $360K $295K $319K Estimated Home Value 12-Month Change 1.1% 5.1% 1.2% – Median List Price $559K $389K $300K $99K List Price 1-Month Change 1.8% 1.1% 0.3% 0.2% List Price 12-Month Change 7.5% 5.2% –6% 2.6% Median Home Age 40 43 54 – Own 61% 75% 65% 64% Rent 39% 25% 35% 36% $ Value of All Buildings for which Permits Were Issued – $110M $2.04B $102B % Change in Permits for All Buildings – 18% 5% 2% % Change in $ Value for All Buildings – 17% –2% 7% Ocean City, NJ 08226 Copyright 2016Realtors PropertyResource®LLC. All Rights Reserved. Informationis not guaranteed. Equal Housing Opportunity. 7/28/2016
- 3. Median List Price Listing Volume MedianListingPrice vs. Listing Volume Thischart comparesthe listing price and listing volume for homesin an area. Listing pricesoften followlisting volume, with a time lag, because supply can drive price movements. Data Source: On- and off-market listings sources Update Frequency: Monthly Sales Count By Price Range Price Range of Homes Sold Thischart showsthe distribution of homesreported sold in the past six monthswithin different price rangesin the area of your search. The amount shown for the subject property issold data where available, or the property's estimated value when salesdata are unavailable (such asa non-disclosure state) or provided in range format. Data Source: Public recordsdata Update Frequency: Monthly Sales Count By Price Per Sq Ft Price per Square Foot of Homes Sold Thischart showsthe distribution of homesreported sold in the past six monthsat different pricesper square foot in the area of your search. Data Source: Public recordsdata Update Frequency: Monthly Ocean City, NJ 08226 Copyright 2016Realtors PropertyResource®LLC. All Rights Reserved. Informationis not guaranteed. Equal Housing Opportunity. 7/28/2016
- 4. Sales Count By Living Area Size of Homes Sold Thischart showsthe distribution of homesreported sold in the past six monthsof different sizesin the area of your search. Data Source: Public recordsdata Update Frequency: Monthly Sales Count by Age of House Age Range of Homes Sold Thischart showsthe distribution of homesreported sold in the past six monthsof different age rangesin the area of your search. Data Source: Public recordsdata Update Frequency: Monthly Ocean City, NJ 08226 Copyright 2016Realtors PropertyResource®LLC. All Rights Reserved. Informationis not guaranteed. Equal Housing Opportunity. 7/28/2016
- 5. 08226 Populationof Childrenby Age Group Thischart showsthe distribution of the population of children by age range — from birth to 17 —in the area of your search. Data Source: U.S. Census Update Frequency: Annually 08226 Populationof Adults by Age Group Thischart showsthe distribution of the population of adultsby age range — from 18 to 75-plus—in the area of your search. Data Source: U.S. Census Update Frequency: Annually 08226 Households WithChildren Thischart showsthe distribution of householdswith children, categorized by marital status, in the area of your search. Data Source: U.S. Census Update Frequency: Annually Neighborhood: People Stats and Charts 08226 Cape May County New Jersey USA Population 10.4K 96.3K 8.87M 314M Population Density per Sq Mi 2.19K 383 1.21K – Population Change since 2000 –25.4% –5.9% 5.5% 11.6% Median Age 52 48 39 37 Male / Female Ratio 47% 49% 49% 49% High School Graduate 23% 35% 29% 28% 2-Year Degree 25% 25% 23% 29% Bachelor Degree 28% 19% 22% 18% Post-graduate Degree 18% 10% 14% 11% Ocean City, NJ 08226 Copyright 2016Realtors PropertyResource®LLC. All Rights Reserved. Informationis not guaranteed. Equal Housing Opportunity. 7/28/2016
- 6. 08226 HouseholdIncome Brackets Thischart showsannual household income levelswithin an area. Data Source: U.S. Census Update Frequency: Annually Presidential VotingPattern Thischart showshowresidentsof a county voted in the 2014 presidential election. Data Source: USElectionAtlas.org Update Frequency: Annually Ocean City, NJ 08226 Copyright 2016Realtors PropertyResource®LLC. All Rights Reserved. Informationis not guaranteed. Equal Housing Opportunity. 7/28/2016
- 7. Cape May County NewJersey USA Unemployment Rate Thischart showsthe unemployment trend in the area of your search. The unemployment rate isan important driver behind the housing market. Data Source: Bureau of Labor Statistics Update Frequency: Monthly 08226 Occupational Categories Thischart showscategoriesof employment within an area. Data Source: U.S. Census Update Frequency: Annually Neighborhood: Economic Stats and Charts 08226 Cape May County New Jersey USA Income Per Capita $42,690 $33,499 $36,359 $28,555 Median Household Income $60,358 $57,394 $72,062 $53,482 Unemployment Rate – 8.3% 4.9% 4.7% Unemployment Number – 4.22K 226K 7.44M Employment Number – 46.6K 4.34M 151M Labor Force Number – 50.8K 4.56M 158M Ocean City, NJ 08226 Copyright 2016Realtors PropertyResource®LLC. All Rights Reserved. Informationis not guaranteed. Equal Housing Opportunity. 7/28/2016
- 8. 08226 Average Commute Time Thischart showsaverage commute times to work, in minutes, by percentage of an area'spopulation. Data Source: U.S. Census Update Frequency: Annually HowPeople Get to Work Thischart showsthe typesof transportation that residentsof the area you searched use for their commute. Data Source: U.S. Census Update Frequency: Annually Average Monthly Temperature Thischart showsaverage temperaturesin the area you searched. Data Source: NOAA Update Frequency: Annually Neighborhood: Quality of Life Stats and Charts Quality of Life in08226 08226 Cape May County New Jersey USA Elevation (in feet) 14 15 – – Annual Rainfall (in inches) 45 45 45.68 – Annual Snowfall (in inches) 18.05 18.05 24.78 – Days of Full Sun (per year) 98 98 92 – Travel Time to Work (in minutes) – 22 31 26 Water Quality - Health Violations – 0 – – Water Quality - Monitoring and Report Violations – 3 – – Superfund Sites 0 1 158 2,302 Brownfield Sites No No Yes Yes Ocean City, NJ 08226 Copyright 2016Realtors PropertyResource®LLC. All Rights Reserved. Informationis not guaranteed. Equal Housing Opportunity. 7/28/2016
- 9. Walkability Scores (out of 5) Thisneighborhood or ZIP code israted for walking accessto general pointsof interest, reflected in the overall score, plusamenities(such asretail stores) and leisure (such asrestaurantsand parks). Other factorsconsidered in the scoresare street types, weather, public transportation and population density. Data Source: Maponics Update Frequency: Quarterly Overall Score 2.6 Amenity Score 2.6 LeisureScore 2.7 Ocean City, NJ 08226 Copyright 2016Realtors PropertyResource®LLC. All Rights Reserved. Informationis not guaranteed. Equal Housing Opportunity. 7/28/2016