Simmethod predictive capabilities
•
2 j'aime•5,549 vues

SIMMETHOD™ creates a link between you and a moving Strategy/Execution “League Table” of Best-In-Class Enterprises thus extending your line of vision to where most value is being created at any given time

Recommandé
Recommandé
Contenu connexe
Plus de SIMMETHOD: Converting Information Into Assets
Plus de SIMMETHOD: Converting Information Into Assets (20)
Dernier
Dernier (20)
Simmethod predictive capabilities
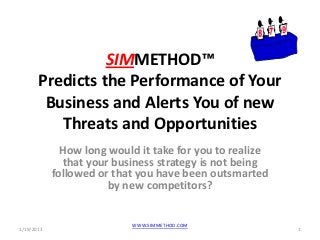
- 1. SIMMETHOD™ Predicts the Performance of Your Business and Alerts You of new Threats and Opportunities How long would it take for you to realize that your business strategy is not being followed or that you have been outsmarted by new competitors? WWW.SIMMETHOD.COM 1/19/2013 1
- 2. Why do Businesses Fail or Fail to Perform? From which Industry do your new competitors come from? Mervyns Circuit City Wachovia Washington Borders Mutual Are your leading Blockbuster performance and Linen n’ risk indicators Things protecting you ? WWW.SIMMETHOD.COM 1/19/2013 2
- 3. Why do you need new Industry-Agnostic Indices and Risk/Performance Leading Indicators? Today’s market is interlinked and the performance of one Business Sector is influenced by the performance of other Industry Sectors. WWW.SIMMETHOD.COM 1/19/2013 3
- 4. Why do you need new Industry-Agnostic Indices and Risk/Performance Leading Indicators? To understand the external factors impacting the performance of your Business, it is necessary to look beyond any given industry and instead look at many Business Sectors in order to reduce the risk and better measure, manage and predict your performance. WWW.SIMMETHOD.COM 1/19/2013 4
- 5. Why do you need new Industry-Agnostic Indices and Risk/Performance Leading Indicators? As Business value gravitates towards Valuechains and unlike single industry ratios, SIMMETHOD Industry-Agnostic Indices and Risk/ Performance Leading indicators can be used to measure the dynamic relationship between Valuechains of manufacturers, distributors and customers across a range of industries and the entire Market. WWW.SIMMETHOD.COM 1/19/2013 5
- 6. Why do you need new Industry-Agnostic Indices and Risk/Performance Leading Indicators? Industry-Agnostic Indices extend the line of vision to the entire value-chain and provide the opportunity to analyze and correlate 1000’s of unrelated business metrics across every Business Sector in order to: • Identify the Best-In-Class Enterprises and teams in any industry in order to study, adapt and incorporate their Best Practices. WWW.SIMMETHOD.COM 1/19/2013 6
- 7. Why do you need new Industry-Agnostic Indices and Risk/Performance Leading Indicators? • Identify previously undetected strengths and weaknesses in specific areas of your Business in relation to current and future competitors and threats and opportunities coming from outside your industry. • Enable you to collaborate with your value- chain partners, reduce your risk and improve your performance via shared performance and risk indicators. WWW.SIMMETHOD.COM 1/19/2013 7
- 8. The 4 Phases of the SIMMETHOD™ Continuous Value Creation Process • Analyze data from 1000’s • Find correlations between of Enterprises, convert it indices, find the B-I-C into industry agnostic Enterprises and indices & setup targets . build a Best-In-Class against B-I-C database Phase 1: Phase 2: . profile database Algorithm Identify based on the B-I-C and 7 Laws build D/base Phase 4: Phase 3: Performance your gap to & risk alerts. Updates the B-I-C • Risk & performance • Identify your alerts against the B-I-C risk/performance gap to profiles database & targets. the B-I-C & your targets Update strategy/execution WWW.SIMMETHOD.COM 1/19/2013 8
- 9. SIMMETHOD’s Phase 1 Performance Predictive Algorithm SIMMETHOD’s Predictive Algorithm converts a basket of unrelated data into industry-agnostic performance predictive indices enabling you to set up unique leading indicators against SIMMETHOD’s Global Success Metrics Database covering Sales, Profits, Assets, Overheads, Social Media, Business Models, Business Growth and Resource Management. WWW.SIMMETHOD.COM 1/19/2013 9
- 10. SIMMETHOD™ Algorithm: From Data to Industry- Agnostic Risk and Performance Indices and Leading Indicators Stockholder HR Overheads rating Assets Cash/Debt Profit Social Media SIMMETHOD Performance Sales CEO’s pay Predictive Indices and Risk Alerts WWW.SIMMETHOD.COM 1/19/2013 10
- 11. The SIMMETHOD™ Algorithm calculates the following Industry-Agnostic Risk and Performance Indices • Strategy/Execution Performance Predictive index • Management Controllable Index • Minimum Company Business Model index • Value Creation Index • Business and Value-chain Alignment Index • Social Media Index • HR Index • Asset Index • Sales Index • Overheads Index • CEO-Pay Alignment Index • Profit Index • Valuation Index • Cash/Debt Index WWW.SIMMETHOD.COM 1/19/2013 11
- 12. SIMMETHOD™ Algorithm is Based on the 7 Laws of Best Practices, Growth and Value Creation Integration Minimum /alignment Benchmarking company inside/outside /business your industry model SIMMETHOD™ 7 Laws Growth & Averages & positive value trends creation Predictive Resource performance contribution & risk to objectives WWW.SIMMETHOD.COM 1/19/2013 12
- 13. SIMMETHOD’s Phase 1 Set Up Targets Against the B-I-C Database Examples of targets set up against the moving SIMMETHOD™ Global Success Metrics Database and Alerts: • Top 25% Strategy/Execution Performance Predictive Index position in your Business Sector and Top 50% position in a range of Industries. • Top 25% HR, Cash and Social Media Index in your Business Sector. • Above Median Management Controllable Index. • Value Creation Index growing faster than your competitors. WWW.SIMMETHOD.COM 1/19/2013 13
- 14. SIMMETHOD™ Phase 2 Identify Best-In-Class and Build Database • Is your goal setting and strategy formulation based on the full picture? • Why is important to study Best- in-Class Enterprises in each Business Sector? • How good do you have to be to become Best-In-Class across a range of Industries to fend-off potential new competitors? WWW.SIMMETHOD.COM 1/19/2013 14
- 15. What is the role of the Best-in-Class performers in your strategy formulation? • How good do you have to be in order to outperform your current and future competitors and no to confuse any positive trend by real competitive advantage? 1/19/2013 WWW.SIMMETHOD.COM 15
- 16. What is the Role of the Best-in-Class Performers in your Strategy Formulation? In order to outperform your competitors, it is essential to understand: • Their ability to strategize and execute against you and your peers, • Their business models, • Risk and performance profiles, • Value-chain, • Success metrics, leading indicators and • Their competitive advantage. WWW.SIMMETHOD.COM 1/19/2013 16
- 17. SIMMETHOD Strategy/Execution Performance Predictive Index (Technology/HR) Top 25% Strategy/ Execution Performance Predictive index Top 25% 60 50 40 30 20 Strategy/ Execution 10 Performance Predictive index 0 WWW.SIMMETHOD.COM 1/19/2013 17
- 18. SIMMETHOD Strategy/Execution Performance Predictive Index (Technology/HR) Top 50% Strategy/ Execution Performance Predictive index Top 50% 60 50 40 30 Strategy/ 20 Execution 10 Performance 0 Predictive index salesforce citrix wipro intuit Groupon Cielo Priceline Teradata Oracle Tata Apple Infosys Microsoft Cognizant Checkpoint autodesk Dassault IBM SAP LinkedIn Google Amadeus Vmware Moodys ebay Aggreko World fuel serv BMC Yahoo amazon Paychex WWW.SIMMETHOD.COM 1/19/2013 18
- 19. Example of Link Between SIMMETHOD™ Industry Agnostic Indices and Risk/Performance 120 100 Strategy/Execution Performance 80 Predictive index 60 Avg Enterprise Profit 40 ($B) 20 Avg Enterprise Value 0 ($B) Top 25% Top 50% Bottom 50% Bottom 25% -20 -40 WWW.SIMMETHOD.COM 1/19/2013 19
- 20. Example of Link Between SIMMETHOD™ Industry Agnostic Indices and Risk/Performance 350 300 Strategy/Execution Performance 250 Predictive index 200 Profit/Employee 150 100 Cash/Employee 50 0 Top 25% Top 50% Bottom 50% Bottom 25% -50 WWW.SIMMETHOD.COM 1/19/2013 20
- 21. SIMMETHOD™ Phase 3 Identify Your Gap to the Best-In-Class • Is your dynamic gap to the Best-In-Class predictive of your future risk and performance? WWW.SIMMETHOD.COM 1/19/2013 21
- 22. Example of your Risk and Performance Gap to the SIMMETHOD™ Best-In-Class 180 160 140 120 Your Value above 100 Assets ($B) 80 60 Avg B-I-C Enterprise 40 Value Above Assets 20 ($B) 0 -20 Microsoft IBM Dell Randstad Adecco -40 WWW.SIMMETHOD.COM 1/19/2013 22
- 23. Example of your Risk and Performance Gap to the SIMMETHOD™ Best-In-Class 300 250 Profit/ 200 Employee 150 100 Avg. B-I-C Profit/ 50 Employee 0 Microsoft IBM Dell Randstad Adecco WWW.SIMMETHOD.COM 1/19/2013 23
- 24. Example of your Risk and Performance Gap to the SIMMETHOD™ Best-In-Class 900 800 700 600 Sales/ Employee 500 400 300 Avg. B-I-C 200 Sales/ 100 Employee 0 Microsoft IBM Dell Randstad Adecco WWW.SIMMETHOD.COM 1/19/2013 24
- 25. SIMMETHOD™ Phase 4 Risk/Performance Alerts and Leading Indicators • Are the Best-In-Class improving faster than your Business? • Are your competitors growing faster than you? • Are your sales/profits increasing at the same rate as your Social Media Index? WWW.SIMMETHOD.COM 1/19/2013 25
- 26. SIMMETHOD™ Phase 4 Risk/Performance Alerts and Leading Indicators There are basically four types of Risk and Performance Alerts set up against the SIMMETHOD™ Database: • Alerts against your targets set up in Phase 1 • Alerts against moving Best-In-Class values • Alerts against your current competitor’s data • Alerts against a range of Industries either to fend off potential future competitors or to monitor a potential new venture. WWW.SIMMETHOD.COM 1/19/2013 26
- 27. Example of Risk Alerts where the SIMMETHOD™ B-I-C are Improving at a Faster Rate than You 200 Your Value above Assets ($B) 150 Your value above 100 Assets ($B) period 2 50 Avg B-I-C Enterprise Value Above Assets ($B) 0 Avg B-I-C Enterprise Business Business Business Business Business Value Above Assets 1 2 3 4 5 ($B) period 2 -50 WWW.SIMMETHOD.COM 1/19/2013 27
- 28. Example of Risk Alerts Where your Competitors are Improving at a Faster Rate than You 250 Your Value above 200 Assets ($B) 150 Your Value above Assets ($B) period 2 100 Avg B-I-C Enterprise 50 Value Above Assets ($B) 0 Avg B-I-C Enterprise Business Business Business Business Business Value Above Assets -50 1 2 3 4 5 ($B) period 2 WWW.SIMMETHOD.COM 1/19/2013 28
- 29. SIMMETHOD™ Performance Predictive Capabilities SIMMETHOD’s Performance Predictive and Risk Reduction capabilities are based on: • The GPS concept: The targets and alerts against the continuously updated Success Metrics Database alert you of any deviation against your objectives and enables you to take corrective action to reach your outcomes in the most cost-effective way (thus adding certainty to your performance). WWW.SIMMETHOD.COM 1/19/2013 29
- 30. SIMMETHOD™ Performance Predictive Capabilities • The calculation of Industry-Agnostic Indices enables you to correlate 1000’s of unrelated Business Metrics across different Business Sectors and Value Chains in order to identify previously undetected threats and opportunities likely to impact your decisions, strategy and objectives. WWW.SIMMETHOD.COM 1/19/2013 30
- 31. SIMMETHOD™ Performance Predictive Capabilities • SIMMETHOD™ has found a strong correlation between the Management Controllable Index (the composite Index that represents known variables under Management’s control) and Enterprise value creation. This link between Management- Decisions, Resource Management and Value Creation contributes towards SIMMETHOD’s predictive and risk reduction capabilities. WWW.SIMMETHOD.COM 1/19/2013 31
- 32. SIMMETHOD™ Performance Predictive Capabilities • To calculate the industry agnostic composite indices, SIMMETHOD™ uses a “basket of operational and financial indicators” across a range of Businesses and Industries that have proved across different cycles that are less open to manipulation, are better able to show the dynamic relationship between businesses and any unexplained positive or negative deviation. WWW.SIMMETHOD.COM 1/19/2013 32
- 33. SIMMETHOD™ Performance Predictive Capabilities • SIMMETHOD™ creates a link between you and a moving Strategy/Execution “League Table” of Best-In-Class Enterprises thus extending your line of vision to where most value is being created at any given time. WWW.SIMMETHOD.COM 1/19/2013 33
- 34. Jorge Oscar Tabacman jtabacman@gmail.com SIMMETHOD™ Predicts the Performance of Your Business and Alerts You of New Risks and Opportunities from Inside and Outside your Business Sector WWW.SIMMETHOD.COM 1/19/2013 34