SlideShare une entreprise Scribd logo
1  sur  15
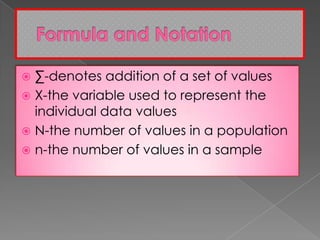
 ∑-denotes addition of a set of values
 X-the variable used to represent the
individual data values
 N-the number of values in a population
 n-the number of values in a sample
 Population
--complete collection of all elements to be
studied
 Sample
--subcollection of members selected from
a population
Population Sample Weighted
1
N
i
i
x
N
 


1
i
i
n
x
x
n


 1
1
iWi
i
i
i
k
x
x
k
w





 =lower case Greek mu
=denotes all values of the population
 =pronounced as x- bar
=denotes all the data values from a
sample of larger population

x
PopulationSample
 If N is odd
 If N is even
 If n is odd
 If n is even
1
( )2
N
x 

( 1)2 2
1
[ ]
2
N N
x x  
( 1)2 2
1
[ ]
2
n n
x x x  
1
( )2
n
x x 

 Observations: Number of hours spent by
the students in studying 2
3
3
3
6
2
3
2
4
2.5
10
1
1 2 3 4. .... 10
10
30.5
10
3.05
xi
x
n
x x x x x

    




( 1)2 2
1
[ ]
2
1 10 10
[ ( 1)]
2 2 2
1
( 5 6)
2
1
(3 3)
2
3
n n
x x x
x x
x x
 
  
 
 


 3
 -- the highest frequency
Observations=60
87, 85, 79, 75, 81, 88, 92, 86, 77, 72, 75, 77, 81, 80, 77,
73, 69, 71, 76, 79, 83, 81, 78, 75, 68, 67, 71, 73, 78, 75,
84, 81, 79, 82, 87, 89, 85, 81, 79, 77, 81, 78, 74, 76, 82,
85, 86, 81, 72, 69, 65, 71, 73, 78, 81, 77, 74, 77, 72, 68
μ = (87+85+ 79 +….+72+68)/60
= 4751/60
= 79.183
We now find the median of the population of temperature readings
87, 85, 79, 75, 81, 88, 92, 86, 77, 72, 75, 77, 81, 80, 77,
73, 69, 71, 76, 79, 83, 81, 78, 75, 68, 67, 71, 73, 78, 75,
84, 81, 79, 82, 87, 89, 85, 81, 79, 77, 81, 78, 74, 76, 82,
85, 86, 81, 72, 69, 65, 71, 73, 78, 81, 77, 74, 77, 72, 68
Arrange these 60 measurements in ascending order
65, 67, 68, 68, 69, 69, 71, 71, 71, 72, 72, 72, 73, 73, 73, 74, 74, 75,
75, 75, 75, 76, 76, 77, 77, 77, 77, 77, 77, 78, 78, 78, 78, 79, 79, 79,
79, 80, 81, 81, 81, 81, 81, 81, 81, 81, 82, 82, 83, 84, 85, 85, 85, 86,
86, 87, 87, 88, 89, 92
Since N/2 = 30 and both the 30th and 31st values in the list are the same,
we obtain median = 78
One further parameter of a population that may give some indication of
central tendency of the data is the mode
Define: mode = most frequently occurring value in the
population
From the previous data we see:
65, 67, 68, 68, 69, 69, 71, 71, 71, 72, 72, 72, 73, 73, 73, 74,
74, 75, 75, 75, 75, 76, 76, 77, 77, 77, 77, 77, 77, 78, 78, 78,
78, 79, 79, 79, 79, 80, 81, 81, 81, 81, 81, 81, 81, 81, 82, 82,
83, 84, 85, 85, 85, 86, 86, 87, 87, 88, 89, 92
That the value 81 occurs 8 times mode = 81
Note! If two different values were to occur most frequently, the distribution
would be bimodal. A distribution may be multi-modal.
Grade
99
92
90
91
88
85
82
Units
3
2
6
1
4
3
3
1
1
iWi
i
i
i
k
x
x
k
w





99(3) 92(2) 90(6) 91(6) 88(4) 85(3) 82(3)
3 2 6 1 4 3 3
89.32GPA
     

     


Contenu connexe

Tendances

Frequency distribution
Frequency distributionFrequency distribution
Frequency distributionAishwarya PT
 
Frequency Distributions and Graphs
Frequency Distributions and GraphsFrequency Distributions and Graphs
Frequency Distributions and Graphsmonritche
 
Presentation of Data and Frequency Distribution
Presentation of Data and Frequency DistributionPresentation of Data and Frequency Distribution
Presentation of Data and Frequency DistributionElain Cruz
 
Chapter 3: Prsentation of Data
Chapter 3: Prsentation of DataChapter 3: Prsentation of Data
Chapter 3: Prsentation of DataAndrilyn Alcantara
 
Frequency Tables, Frequency Distributions, and Graphic Presentation
Frequency Tables, Frequency Distributions, and Graphic PresentationFrequency Tables, Frequency Distributions, and Graphic Presentation
Frequency Tables, Frequency Distributions, and Graphic PresentationConflagratioNal Jahid
 
Frequency Distribution
Frequency DistributionFrequency Distribution
Frequency DistributionTeacherMariza
 
Chapter 2: Frequency Distribution and Graphs
Chapter 2: Frequency Distribution and GraphsChapter 2: Frequency Distribution and Graphs
Chapter 2: Frequency Distribution and GraphsMong Mara
 
frequency distribution
 frequency distribution frequency distribution
frequency distributionUnsa Shakir
 
2.3 Histogram/Frequency Polygon/Ogives
2.3 Histogram/Frequency Polygon/Ogives2.3 Histogram/Frequency Polygon/Ogives
2.3 Histogram/Frequency Polygon/Ogivesmlong24
 
2.1 Part 1 - Frequency Distributions
2.1 Part 1 - Frequency Distributions2.1 Part 1 - Frequency Distributions
2.1 Part 1 - Frequency Distributionsleblance
 
2.1 frequency distributions, histograms, and related topics
2.1 frequency distributions, histograms, and related topics2.1 frequency distributions, histograms, and related topics
2.1 frequency distributions, histograms, and related topicsleblance
 
Frequency Tables - Statistics
Frequency Tables - StatisticsFrequency Tables - Statistics
Frequency Tables - Statisticsmscartersmaths
 
Chapter 2 250110 083240
Chapter 2 250110 083240Chapter 2 250110 083240
Chapter 2 250110 083240guest25d353
 
Excel tutorial for frequency distribution
Excel tutorial for frequency distributionExcel tutorial for frequency distribution
Excel tutorial for frequency distributionS.c. Chopra
 
frequency distribution table
frequency distribution tablefrequency distribution table
frequency distribution tableMonie Ali
 
Probability and statistics (frequency distributions)
Probability and statistics (frequency distributions)Probability and statistics (frequency distributions)
Probability and statistics (frequency distributions)Don Bosco BSIT
 

Tendances (20)

Frequency distribution
Frequency distributionFrequency distribution
Frequency distribution
 
Frequency distribution
Frequency distributionFrequency distribution
Frequency distribution
 
Frequency Distributions and Graphs
Frequency Distributions and GraphsFrequency Distributions and Graphs
Frequency Distributions and Graphs
 
Presentation of Data and Frequency Distribution
Presentation of Data and Frequency DistributionPresentation of Data and Frequency Distribution
Presentation of Data and Frequency Distribution
 
Chapter 3: Prsentation of Data
Chapter 3: Prsentation of DataChapter 3: Prsentation of Data
Chapter 3: Prsentation of Data
 
Frequency Tables, Frequency Distributions, and Graphic Presentation
Frequency Tables, Frequency Distributions, and Graphic PresentationFrequency Tables, Frequency Distributions, and Graphic Presentation
Frequency Tables, Frequency Distributions, and Graphic Presentation
 
Frequency Distribution
Frequency DistributionFrequency Distribution
Frequency Distribution
 
Chapter 2: Frequency Distribution and Graphs
Chapter 2: Frequency Distribution and GraphsChapter 2: Frequency Distribution and Graphs
Chapter 2: Frequency Distribution and Graphs
 
Chapter 2
Chapter 2Chapter 2
Chapter 2
 
frequency distribution
 frequency distribution frequency distribution
frequency distribution
 
2.3 Histogram/Frequency Polygon/Ogives
2.3 Histogram/Frequency Polygon/Ogives2.3 Histogram/Frequency Polygon/Ogives
2.3 Histogram/Frequency Polygon/Ogives
 
2.1 Part 1 - Frequency Distributions
2.1 Part 1 - Frequency Distributions2.1 Part 1 - Frequency Distributions
2.1 Part 1 - Frequency Distributions
 
Medidas de tendencia central
Medidas de tendencia centralMedidas de tendencia central
Medidas de tendencia central
 
2.1 frequency distributions, histograms, and related topics
2.1 frequency distributions, histograms, and related topics2.1 frequency distributions, histograms, and related topics
2.1 frequency distributions, histograms, and related topics
 
Frequency Tables - Statistics
Frequency Tables - StatisticsFrequency Tables - Statistics
Frequency Tables - Statistics
 
Chapter 2 250110 083240
Chapter 2 250110 083240Chapter 2 250110 083240
Chapter 2 250110 083240
 
Excel tutorial for frequency distribution
Excel tutorial for frequency distributionExcel tutorial for frequency distribution
Excel tutorial for frequency distribution
 
Frequency distribution
Frequency distributionFrequency distribution
Frequency distribution
 
frequency distribution table
frequency distribution tablefrequency distribution table
frequency distribution table
 
Probability and statistics (frequency distributions)
Probability and statistics (frequency distributions)Probability and statistics (frequency distributions)
Probability and statistics (frequency distributions)
 

En vedette

Systematic instructional planning
Systematic instructional planningSystematic instructional planning
Systematic instructional planningJuvie De Hayo
 
Developing science lesson.final
Developing science lesson.finalDeveloping science lesson.final
Developing science lesson.finalJuvie De Hayo
 
Three dimensional (3 d) instructional media1
Three dimensional (3 d) instructional media1Three dimensional (3 d) instructional media1
Three dimensional (3 d) instructional media1Juvie De Hayo
 
Department of Education (RA 9155), DepEd Set Up, Educational Delivery Program...
Department of Education (RA 9155), DepEd Set Up, Educational Delivery Program...Department of Education (RA 9155), DepEd Set Up, Educational Delivery Program...
Department of Education (RA 9155), DepEd Set Up, Educational Delivery Program...Mark Anthony Soratos
 

En vedette (7)

Systematic instructional planning
Systematic instructional planningSystematic instructional planning
Systematic instructional planning
 
Developing science lesson.final
Developing science lesson.finalDeveloping science lesson.final
Developing science lesson.final
 
R.a. 9155.ppt v3
R.a. 9155.ppt v3R.a. 9155.ppt v3
R.a. 9155.ppt v3
 
Three dimensional (3 d) instructional media1
Three dimensional (3 d) instructional media1Three dimensional (3 d) instructional media1
Three dimensional (3 d) instructional media1
 
Department of Education (RA 9155), DepEd Set Up, Educational Delivery Program...
Department of Education (RA 9155), DepEd Set Up, Educational Delivery Program...Department of Education (RA 9155), DepEd Set Up, Educational Delivery Program...
Department of Education (RA 9155), DepEd Set Up, Educational Delivery Program...
 
Ra 9155 dep ed law
Ra 9155   dep ed lawRa 9155   dep ed law
Ra 9155 dep ed law
 
Republic Act 9155
Republic Act 9155Republic Act 9155
Republic Act 9155
 

Similaire à Measures of center un grouped data

Similaire à Measures of center un grouped data (20)

Mean of grouped data
Mean of grouped dataMean of grouped data
Mean of grouped data
 
SP and R.pptx
SP and R.pptxSP and R.pptx
SP and R.pptx
 
Statistics in Research
Statistics in ResearchStatistics in Research
Statistics in Research
 
Statistics in Research
Statistics in ResearchStatistics in Research
Statistics in Research
 
Statistics
StatisticsStatistics
Statistics
 
Empirics of standard deviation
Empirics of standard deviationEmpirics of standard deviation
Empirics of standard deviation
 
Basics of Stats (2).pptx
Basics of Stats (2).pptxBasics of Stats (2).pptx
Basics of Stats (2).pptx
 
Sampling distribution.pptx
Sampling distribution.pptxSampling distribution.pptx
Sampling distribution.pptx
 
A Brief Overview On Central Tendency.pptx
A Brief Overview On Central Tendency.pptxA Brief Overview On Central Tendency.pptx
A Brief Overview On Central Tendency.pptx
 
L3 sampling fundamentals and estimation
L3 sampling fundamentals and estimationL3 sampling fundamentals and estimation
L3 sampling fundamentals and estimation
 
Measures of Central Tendency.pptx
Measures of Central Tendency.pptxMeasures of Central Tendency.pptx
Measures of Central Tendency.pptx
 
Descriptive
DescriptiveDescriptive
Descriptive
 
Anova.ppt
Anova.pptAnova.ppt
Anova.ppt
 
DATA COLLECTION IN RESEARCH
DATA COLLECTION IN RESEARCHDATA COLLECTION IN RESEARCH
DATA COLLECTION IN RESEARCH
 
STATISTICS-AND-PROBABLITY-A-REVIEW-FOR-SHS.pdf
STATISTICS-AND-PROBABLITY-A-REVIEW-FOR-SHS.pdfSTATISTICS-AND-PROBABLITY-A-REVIEW-FOR-SHS.pdf
STATISTICS-AND-PROBABLITY-A-REVIEW-FOR-SHS.pdf
 
Ejercicio resuelto-de-estadc3adstica-descriptiva1
Ejercicio resuelto-de-estadc3adstica-descriptiva1Ejercicio resuelto-de-estadc3adstica-descriptiva1
Ejercicio resuelto-de-estadc3adstica-descriptiva1
 
Medical statistics
Medical statisticsMedical statistics
Medical statistics
 
Biostat.
Biostat.Biostat.
Biostat.
 
Engineering Statistics
Engineering Statistics Engineering Statistics
Engineering Statistics
 
Statistical basics
Statistical basicsStatistical basics
Statistical basics
 

Dernier

Choosing the Right CBSE School A Comprehensive Guide for Parents
Choosing the Right CBSE School A Comprehensive Guide for ParentsChoosing the Right CBSE School A Comprehensive Guide for Parents
Choosing the Right CBSE School A Comprehensive Guide for Parentsnavabharathschool99
 
Karra SKD Conference Presentation Revised.pptx
Karra SKD Conference Presentation Revised.pptxKarra SKD Conference Presentation Revised.pptx
Karra SKD Conference Presentation Revised.pptxAshokKarra1
 
Proudly South Africa powerpoint Thorisha.pptx
Proudly South Africa powerpoint Thorisha.pptxProudly South Africa powerpoint Thorisha.pptx
Proudly South Africa powerpoint Thorisha.pptxthorishapillay1
 
4.18.24 Movement Legacies, Reflection, and Review.pptx
4.18.24 Movement Legacies, Reflection, and Review.pptx4.18.24 Movement Legacies, Reflection, and Review.pptx
4.18.24 Movement Legacies, Reflection, and Review.pptxmary850239
 
Like-prefer-love -hate+verb+ing & silent letters & citizenship text.pdf
Like-prefer-love -hate+verb+ing & silent letters & citizenship text.pdfLike-prefer-love -hate+verb+ing & silent letters & citizenship text.pdf
Like-prefer-love -hate+verb+ing & silent letters & citizenship text.pdfMr Bounab Samir
 
MULTIDISCIPLINRY NATURE OF THE ENVIRONMENTAL STUDIES.pptx
MULTIDISCIPLINRY NATURE OF THE ENVIRONMENTAL STUDIES.pptxMULTIDISCIPLINRY NATURE OF THE ENVIRONMENTAL STUDIES.pptx
MULTIDISCIPLINRY NATURE OF THE ENVIRONMENTAL STUDIES.pptxAnupkumar Sharma
 
INTRODUCTION TO CATHOLIC CHRISTOLOGY.pptx
INTRODUCTION TO CATHOLIC CHRISTOLOGY.pptxINTRODUCTION TO CATHOLIC CHRISTOLOGY.pptx
INTRODUCTION TO CATHOLIC CHRISTOLOGY.pptxHumphrey A Beña
 
Judging the Relevance and worth of ideas part 2.pptx
Judging the Relevance  and worth of ideas part 2.pptxJudging the Relevance  and worth of ideas part 2.pptx
Judging the Relevance and worth of ideas part 2.pptxSherlyMaeNeri
 
ECONOMIC CONTEXT - LONG FORM TV DRAMA - PPT
ECONOMIC CONTEXT - LONG FORM TV DRAMA - PPTECONOMIC CONTEXT - LONG FORM TV DRAMA - PPT
ECONOMIC CONTEXT - LONG FORM TV DRAMA - PPTiammrhaywood
 
HỌC TỐT TIẾNG ANH 11 THEO CHƯƠNG TRÌNH GLOBAL SUCCESS ĐÁP ÁN CHI TIẾT - CẢ NĂ...
HỌC TỐT TIẾNG ANH 11 THEO CHƯƠNG TRÌNH GLOBAL SUCCESS ĐÁP ÁN CHI TIẾT - CẢ NĂ...HỌC TỐT TIẾNG ANH 11 THEO CHƯƠNG TRÌNH GLOBAL SUCCESS ĐÁP ÁN CHI TIẾT - CẢ NĂ...
HỌC TỐT TIẾNG ANH 11 THEO CHƯƠNG TRÌNH GLOBAL SUCCESS ĐÁP ÁN CHI TIẾT - CẢ NĂ...Nguyen Thanh Tu Collection
 
THEORIES OF ORGANIZATION-PUBLIC ADMINISTRATION
THEORIES OF ORGANIZATION-PUBLIC ADMINISTRATIONTHEORIES OF ORGANIZATION-PUBLIC ADMINISTRATION
THEORIES OF ORGANIZATION-PUBLIC ADMINISTRATIONHumphrey A Beña
 
Difference Between Search & Browse Methods in Odoo 17
Difference Between Search & Browse Methods in Odoo 17Difference Between Search & Browse Methods in Odoo 17
Difference Between Search & Browse Methods in Odoo 17Celine George
 
Influencing policy (training slides from Fast Track Impact)
Influencing policy (training slides from Fast Track Impact)Influencing policy (training slides from Fast Track Impact)
Influencing policy (training slides from Fast Track Impact)Mark Reed
 
Barangay Council for the Protection of Children (BCPC) Orientation.pptx
Barangay Council for the Protection of Children (BCPC) Orientation.pptxBarangay Council for the Protection of Children (BCPC) Orientation.pptx
Barangay Council for the Protection of Children (BCPC) Orientation.pptxCarlos105
 
ECONOMIC CONTEXT - PAPER 1 Q3: NEWSPAPERS.pptx
ECONOMIC CONTEXT - PAPER 1 Q3: NEWSPAPERS.pptxECONOMIC CONTEXT - PAPER 1 Q3: NEWSPAPERS.pptx
ECONOMIC CONTEXT - PAPER 1 Q3: NEWSPAPERS.pptxiammrhaywood
 
How to do quick user assign in kanban in Odoo 17 ERP
How to do quick user assign in kanban in Odoo 17 ERPHow to do quick user assign in kanban in Odoo 17 ERP
How to do quick user assign in kanban in Odoo 17 ERPCeline George
 
How to Add Barcode on PDF Report in Odoo 17
How to Add Barcode on PDF Report in Odoo 17How to Add Barcode on PDF Report in Odoo 17
How to Add Barcode on PDF Report in Odoo 17Celine George
 

Dernier (20)

Choosing the Right CBSE School A Comprehensive Guide for Parents
Choosing the Right CBSE School A Comprehensive Guide for ParentsChoosing the Right CBSE School A Comprehensive Guide for Parents
Choosing the Right CBSE School A Comprehensive Guide for Parents
 
Karra SKD Conference Presentation Revised.pptx
Karra SKD Conference Presentation Revised.pptxKarra SKD Conference Presentation Revised.pptx
Karra SKD Conference Presentation Revised.pptx
 
Proudly South Africa powerpoint Thorisha.pptx
Proudly South Africa powerpoint Thorisha.pptxProudly South Africa powerpoint Thorisha.pptx
Proudly South Africa powerpoint Thorisha.pptx
 
4.18.24 Movement Legacies, Reflection, and Review.pptx
4.18.24 Movement Legacies, Reflection, and Review.pptx4.18.24 Movement Legacies, Reflection, and Review.pptx
4.18.24 Movement Legacies, Reflection, and Review.pptx
 
Like-prefer-love -hate+verb+ing & silent letters & citizenship text.pdf
Like-prefer-love -hate+verb+ing & silent letters & citizenship text.pdfLike-prefer-love -hate+verb+ing & silent letters & citizenship text.pdf
Like-prefer-love -hate+verb+ing & silent letters & citizenship text.pdf
 
MULTIDISCIPLINRY NATURE OF THE ENVIRONMENTAL STUDIES.pptx
MULTIDISCIPLINRY NATURE OF THE ENVIRONMENTAL STUDIES.pptxMULTIDISCIPLINRY NATURE OF THE ENVIRONMENTAL STUDIES.pptx
MULTIDISCIPLINRY NATURE OF THE ENVIRONMENTAL STUDIES.pptx
 
TataKelola dan KamSiber Kecerdasan Buatan v022.pdf
TataKelola dan KamSiber Kecerdasan Buatan v022.pdfTataKelola dan KamSiber Kecerdasan Buatan v022.pdf
TataKelola dan KamSiber Kecerdasan Buatan v022.pdf
 
INTRODUCTION TO CATHOLIC CHRISTOLOGY.pptx
INTRODUCTION TO CATHOLIC CHRISTOLOGY.pptxINTRODUCTION TO CATHOLIC CHRISTOLOGY.pptx
INTRODUCTION TO CATHOLIC CHRISTOLOGY.pptx
 
Judging the Relevance and worth of ideas part 2.pptx
Judging the Relevance  and worth of ideas part 2.pptxJudging the Relevance  and worth of ideas part 2.pptx
Judging the Relevance and worth of ideas part 2.pptx
 
ECONOMIC CONTEXT - LONG FORM TV DRAMA - PPT
ECONOMIC CONTEXT - LONG FORM TV DRAMA - PPTECONOMIC CONTEXT - LONG FORM TV DRAMA - PPT
ECONOMIC CONTEXT - LONG FORM TV DRAMA - PPT
 
HỌC TỐT TIẾNG ANH 11 THEO CHƯƠNG TRÌNH GLOBAL SUCCESS ĐÁP ÁN CHI TIẾT - CẢ NĂ...
HỌC TỐT TIẾNG ANH 11 THEO CHƯƠNG TRÌNH GLOBAL SUCCESS ĐÁP ÁN CHI TIẾT - CẢ NĂ...HỌC TỐT TIẾNG ANH 11 THEO CHƯƠNG TRÌNH GLOBAL SUCCESS ĐÁP ÁN CHI TIẾT - CẢ NĂ...
HỌC TỐT TIẾNG ANH 11 THEO CHƯƠNG TRÌNH GLOBAL SUCCESS ĐÁP ÁN CHI TIẾT - CẢ NĂ...
 
THEORIES OF ORGANIZATION-PUBLIC ADMINISTRATION
THEORIES OF ORGANIZATION-PUBLIC ADMINISTRATIONTHEORIES OF ORGANIZATION-PUBLIC ADMINISTRATION
THEORIES OF ORGANIZATION-PUBLIC ADMINISTRATION
 
YOUVE_GOT_EMAIL_PRELIMS_EL_DORADO_2024.pptx
YOUVE_GOT_EMAIL_PRELIMS_EL_DORADO_2024.pptxYOUVE_GOT_EMAIL_PRELIMS_EL_DORADO_2024.pptx
YOUVE_GOT_EMAIL_PRELIMS_EL_DORADO_2024.pptx
 
LEFT_ON_C'N_ PRELIMS_EL_DORADO_2024.pptx
LEFT_ON_C'N_ PRELIMS_EL_DORADO_2024.pptxLEFT_ON_C'N_ PRELIMS_EL_DORADO_2024.pptx
LEFT_ON_C'N_ PRELIMS_EL_DORADO_2024.pptx
 
Difference Between Search & Browse Methods in Odoo 17
Difference Between Search & Browse Methods in Odoo 17Difference Between Search & Browse Methods in Odoo 17
Difference Between Search & Browse Methods in Odoo 17
 
Influencing policy (training slides from Fast Track Impact)
Influencing policy (training slides from Fast Track Impact)Influencing policy (training slides from Fast Track Impact)
Influencing policy (training slides from Fast Track Impact)
 
Barangay Council for the Protection of Children (BCPC) Orientation.pptx
Barangay Council for the Protection of Children (BCPC) Orientation.pptxBarangay Council for the Protection of Children (BCPC) Orientation.pptx
Barangay Council for the Protection of Children (BCPC) Orientation.pptx
 
ECONOMIC CONTEXT - PAPER 1 Q3: NEWSPAPERS.pptx
ECONOMIC CONTEXT - PAPER 1 Q3: NEWSPAPERS.pptxECONOMIC CONTEXT - PAPER 1 Q3: NEWSPAPERS.pptx
ECONOMIC CONTEXT - PAPER 1 Q3: NEWSPAPERS.pptx
 
How to do quick user assign in kanban in Odoo 17 ERP
How to do quick user assign in kanban in Odoo 17 ERPHow to do quick user assign in kanban in Odoo 17 ERP
How to do quick user assign in kanban in Odoo 17 ERP
 
How to Add Barcode on PDF Report in Odoo 17
How to Add Barcode on PDF Report in Odoo 17How to Add Barcode on PDF Report in Odoo 17
How to Add Barcode on PDF Report in Odoo 17
 

Measures of center un grouped data

  • 1.  ∑-denotes addition of a set of values  X-the variable used to represent the individual data values  N-the number of values in a population  n-the number of values in a sample
  • 2.  Population --complete collection of all elements to be studied  Sample --subcollection of members selected from a population
  • 3. Population Sample Weighted 1 N i i x N     1 i i n x x n    1 1 iWi i i i k x x k w     
  • 4.  =lower case Greek mu =denotes all values of the population  =pronounced as x- bar =denotes all the data values from a sample of larger population  x
  • 5. PopulationSample  If N is odd  If N is even  If n is odd  If n is even 1 ( )2 N x   ( 1)2 2 1 [ ] 2 N N x x   ( 1)2 2 1 [ ] 2 n n x x x   1 ( )2 n x x  
  • 6.  Observations: Number of hours spent by the students in studying 2 3 3 3 6 2 3 2 4 2.5
  • 7. 10 1 1 2 3 4. .... 10 10 30.5 10 3.05 xi x n x x x x x          
  • 8. ( 1)2 2 1 [ ] 2 1 10 10 [ ( 1)] 2 2 2 1 ( 5 6) 2 1 (3 3) 2 3 n n x x x x x x x           
  • 9.  3  -- the highest frequency
  • 10.
  • 11. Observations=60 87, 85, 79, 75, 81, 88, 92, 86, 77, 72, 75, 77, 81, 80, 77, 73, 69, 71, 76, 79, 83, 81, 78, 75, 68, 67, 71, 73, 78, 75, 84, 81, 79, 82, 87, 89, 85, 81, 79, 77, 81, 78, 74, 76, 82, 85, 86, 81, 72, 69, 65, 71, 73, 78, 81, 77, 74, 77, 72, 68 μ = (87+85+ 79 +….+72+68)/60 = 4751/60 = 79.183
  • 12. We now find the median of the population of temperature readings 87, 85, 79, 75, 81, 88, 92, 86, 77, 72, 75, 77, 81, 80, 77, 73, 69, 71, 76, 79, 83, 81, 78, 75, 68, 67, 71, 73, 78, 75, 84, 81, 79, 82, 87, 89, 85, 81, 79, 77, 81, 78, 74, 76, 82, 85, 86, 81, 72, 69, 65, 71, 73, 78, 81, 77, 74, 77, 72, 68 Arrange these 60 measurements in ascending order 65, 67, 68, 68, 69, 69, 71, 71, 71, 72, 72, 72, 73, 73, 73, 74, 74, 75, 75, 75, 75, 76, 76, 77, 77, 77, 77, 77, 77, 78, 78, 78, 78, 79, 79, 79, 79, 80, 81, 81, 81, 81, 81, 81, 81, 81, 82, 82, 83, 84, 85, 85, 85, 86, 86, 87, 87, 88, 89, 92 Since N/2 = 30 and both the 30th and 31st values in the list are the same, we obtain median = 78
  • 13. One further parameter of a population that may give some indication of central tendency of the data is the mode Define: mode = most frequently occurring value in the population From the previous data we see: 65, 67, 68, 68, 69, 69, 71, 71, 71, 72, 72, 72, 73, 73, 73, 74, 74, 75, 75, 75, 75, 76, 76, 77, 77, 77, 77, 77, 77, 78, 78, 78, 78, 79, 79, 79, 79, 80, 81, 81, 81, 81, 81, 81, 81, 81, 82, 82, 83, 84, 85, 85, 85, 86, 86, 87, 87, 88, 89, 92 That the value 81 occurs 8 times mode = 81 Note! If two different values were to occur most frequently, the distribution would be bimodal. A distribution may be multi-modal.
  • 15. 1 1 iWi i i i k x x k w      99(3) 92(2) 90(6) 91(6) 88(4) 85(3) 82(3) 3 2 6 1 4 3 3 89.32GPA              