1. Water cycle
From Wikipedia, the free encyclopedia
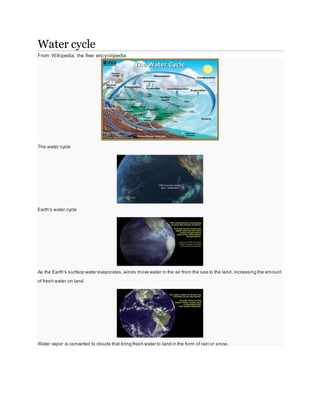
The water cycle
Earth's water cycle
As the Earth's surface water evaporates, winds move water in the air from the sea to the land, increasing the amount
of fresh water on land.
Water vapor is converted to clouds that bring fresh water to land in the form of rain or snow.
2. Precipitation falls on the ground, but what happens to that water depends greatly on the geography of the land at any
particular place.
The water cycle, also known as the hydrologic cycle or the H2O cycle, describes the continuous
movement of water on, above and below the surface of the Earth. The mass of water on Earth
remains fairly constant over time but the partitioning of the water into the major reservoirs of
ice, fresh water, saline water and atmospheric water is variable depending on a wide range
of climatic variables. The water moves from one reservoir to another, such as from river to ocean, or
from the ocean to the atmosphere, by the physical processes
of evaporation, condensation, precipitation, infiltration, runoff, and subsurface flow. In so doing, the
water goes through different phases: liquid, solid ( ice), and gas (vapor).
The water cycle involves the exchange of energy, which leads to temperature changes. For
instance, when water evaporates, it takes up energy from its surroundings and cools the
environment. When it condenses, it releases energy and warms the environment. These heat
exchanges influence climate.
The evaporative phase of the cycle purifies water which then replenishes the land with freshwater.
The flow of liquid water and ice transports minerals across the globe. It is also involved in reshaping
the geological features of the Earth, through processes including erosion and sedimentation. The
water cycle is also essential for the maintenance of most life and ecosystems on the planet.
Description[edit]
The Sun, which drives the water cycle, heats water in oceans and seas. Water evaporates as water
vapour into the air. Ice,rain and snow can sublimate directly into water vapour. Evapotranspiration is
water transpired from plants and evaporated from the soil. Rising air currents take the vapour up into
the atmosphere where cooler temperatures cause it to condense into clouds. Air currents move
water vapour around the globe, cloud particles collide, grow, and fall out of the upper atmospheric
layers as precipitation. Some precipitation falls as snow or hail, sleet, and can accumulate as ice
caps and glaciers, which can store frozen water for thousands of years. Most water falls back into
the oceans or onto land as rain, where the water flows over the ground as surface runoff. A portion
of runoff enters rivers in valleys in the landscape, with streamflow moving water towards the oceans.
Runoff and water emerging from the ground (groundwater) may be stored as freshwater in lakes.
Not all runoff flows into rivers, much of it soaks into the ground as infiltration. Some water infiltrates
deep into the ground and replenishes aquifers, which can store freshwater for long periods of time.
Some infiltration stays close to the land surface and can seep back into surface-water bodies (and
the ocean) as groundwater discharge. Some groundwater finds openings in the land surface and
comes out as freshwater springs. In river valleys and flood-plains there is often continuous water
3. exchange between surface water and ground water in the hyporheic zone. Over time, the water
returns to the ocean, to continue the water cycle.
Processes[edit]
Many different processes lead to movements and phase changes in water
Precipitation
Condensed water vapor that falls to the Earth's surface . Most precipitation occurs as rain,
but also includes snow, hail, fog drip,graupel, and sleet.[1] Approximately
505,000 km3 (121,000 cu mi) of water falls as precipitation each year,
398,000 km3 (95,000 cu mi) of it over the oceans.[2] The rain on land contains
107,000 km3 (26,000 cu mi) of water per year and a snowing only
1,000 km3(240 cu mi).[3] 78% of global precipitation occurs over the ocean.[4]
Canopy interception
The precipitation that is intercepted by plant foliage, eventually evaporates back to the
atmosphere rather than falling to the ground.
Snowmelt
The runoff produced by melting snow.
Runoff
The variety of ways by which water moves across the land. This includes both surface runoff
and channel runoff. As it flows, the water may seep into the ground, evaporate into the air,
become stored in lakes or reservoirs, or be extracted for agricultural or other human uses.
Infiltration
The flow of water from the ground surface into the ground. Once infiltrated, the water
becomes soil moisture or groundwater.[5]
Subsurface flow
The flow of water underground, in the vadose zone and aquifers. Subsurface water may
return to the surface (e.g. as a spring or by being pumped) or eventually seep into the
oceans. Water returns to the land surface at lower elevation than where it infiltrated, under
4. the force of gravity or gravity induced pressures. Groundwater tends to move slowly, and is
replenished slowly, so it can remain in aquifers for thousands of years.
Evaporation
The transformation of water from liquid to gas phases as it moves from the ground or bodies
of water into the overlying atmosphere.[6] The source of energy for evaporation is
primarily solar radiation. Evaporation often implicitly includes transpiration from plants,
though together they are specifically referred to as evapotranspiration. Total annual
evapotranspiration amounts to approximately 505,000 km3 (121,000 cu mi) of water,
434,000 km3 (104,000 cu mi) of which evaporates from the oceans.[2] 86% of global
evaporation occurs over the ocean.[4]
Sublimation
The state change directly from solid water (snow or ice) to water vapor. [7]
Deposition
This refers to changing of water vapor directly to ice.
Advection
The movement of water — in solid, liquid, or vapor states — through the atmosphere.
Without advection, water that evaporated over the oceans could not precipitate over land. [8]
Condensation
The transformation of water vapor to liquid water droplets in the air, creating clouds and
fog.[9]
Transpiration
The release of water vapor from plants and soil into the air. Water vapor is a gas that cannot
be seen.
Percolation
Water flows vertically through the soil and rocks under the influence of gravity
Plate tectonics
Water enters the mantle via subduction of oceanic crust. Water returns to the surface via
volcanism.
Residence times[edit]
5. Average reservoir residence times[10]
Reservoir
Average
residence time
Antarctica 20,000 years
Oceans 3,200 years
Glaciers 20 to 100 years
Seasonal snow cover 2 to 6 months
Soil moisture 1 to 2 months
Groundwater: shallow 100 to 200 years
Groundwater: deep 10,000 years
Lakes (see lake
retention time)
50 to 100 years
Rivers 2 to 6 months
Atmosphere 9 days
The residence time of a reservoir within
the hydrologic cycle is the average time a
water molecule will spend in that reservoir
(see adjacent table). It is a measure of the
average age of the water in that reservoir.
Groundwater can spend over 10,000 years
beneath Earth's surface before leaving.
Particularly old groundwater is called fossil
water. Water stored in the soil remains
there very briefly, because it is spread
thinly across the Earth, and is readily lost
by evaporation, transpiration, stream flow,
6. or groundwater recharge. After
evaporating, the residence time in the
atmosphere is about 9 days before
condensing and falling to the Earth as
precipitation.
The major ice sheets -
Antarctica and Greenland - store ice for
very long periods. Ice from Antarctica has
been reliably dated to 800,000 years
before present, though the average
residence time is shorter.[11]
In hydrology, residence times can be
estimated in two ways. The more common
method relies on the principle
ofconservation of mass and assumes the
amount of water in a given reservoir is
roughly constant. With this method,
residence times are estimated by dividing
the volume of the reservoir by the rate by
which water either enters or exits the
reservoir. Conceptually, this is equivalent
to timing how long it would take the
reservoir to become filled from empty if no
water were to leave (or how long it would
take the reservoir to empty from full if no
water were to enter).
An alternative method to estimate
residence times, which is gaining in
popularity for dating groundwater, is the
use ofisotopic techniques. This is done in
the subfield of isotope hydrology.
7. Changes over time[edit]
Time-mean precipitation and evaporation as a
function of latitude as simulated by an aqua-planet
vers ion of an atmos pheric GCM (GFDL’s
AM2.1) with a homogeneous “s lab-ocean” lower
boundary (saturated surface with small heat
capacity), forced by annual mean insolation.
Global map of Annual mean Evaporation minus
precipitation by Latitude-Longitude
The water cycle describes the processes
that drive the movement of water
throughout the hydrosphere. However,
much more water is "in storage" for long
periods of time than is actually moving
through the cycle. The storehouses for the
vast majority of all water on Earth are the
oceans. It is estimated that of the
332,500,000 mi3 (1,386,000,000 km3) of
the world's water supply, about
321,000,000 mi3(1,338,000,000 km3) is
stored in oceans, or about 97%. It is also
estimated that the oceans supply about
8. 90% of the evaporated water that goes
into the water cycle.[12]
During colder climatic periods more ice
caps and glaciers form, and enough of the
global water supply accumulates as ice to
lessen the amounts in other parts of the
water cycle. The reverse is true during
warm periods. During the last ice age
glaciers covered almost one-third of
Earth's land mass, with the result being
that the oceans were about 400 ft (122 m)
lower than today. During the last global
"warm spell," about 125,000 years ago,
the seas were about 18 ft (5.5 m) higher
than they are now. About three million
years ago the oceans could have been up
to 165 ft (50 m) higher.[12]
The scientific consensus expressed in the
2007 Intergovernmental Panel on Climate
Change (IPCC) Summary for
Policymakers[13] is for the water cycle to
continue to intensify throughout the 21st
century, though this does not mean that
precipitation will increase in all regions. In
subtropical land areas — places that are
already relatively dry — precipitation is
projected to decrease during the 21st
century, increasing the probability
of drought. The drying is projected to be
strongest near the poleward margins of
the subtropics (for example,
theMediterranean Basin, South Africa,
southern Australia, and the Southwestern
United States). Annual precipitation
amounts are expected to increase in near-equatorial
regions that tend to be wet in
the present climate, and also at high
9. latitudes. These large-scale patterns are
present in nearly all of the climate
model simulations conducted at several
international research centers as part of
the 4th Assessment of the IPCC. There is
now ample evidence that increased
hydrologic variability and change in
climate has and will continue to have a
profound impact on the water sector
through the hydrologic cycle, water
availability, water demand, and water
allocation at the global, regional, basin,
and local levels.[14] Research published in
2012 in Science based on surface ocean
salinity over the period 1950 to 2000
confirm this projection of an intensified
global water cycle with salty areas
becoming more saline and fresher areas
becoming more fresh over the period:[15]
Fundamental thermodynamics and climate
models suggest that dry regions will
become drier and wet regions will become
wetter in response to warming. Efforts to
detect this long-term response in sparse
surface observations of rainfall and
evaporation remain ambiguous. We show
that ocean salinity patterns express an
identifiable fingerprint of an intensifying
water cycle. Our 50-year observed global
surface salinity changes, combined with
changes from global climate models,
present robust evidence of an intensified
global water cycle at a rate of 8 ± 5% per
degree of surface warming. This rate is
double the response projected by current-generation
climate models and suggests
that a substantial (16 to 24%)
10. intensification of the global water cycle will
occur in a future 2° to 3° warmer world.[16]
An instrument carried by the SAC-D
satellite launched in June, 2011
measures global sea surface salinity but
data collection began only in June,
2011.[15][17]
Glacial retreat is also an example of a
changing water cycle, where the supply of
water to glaciers from precipitation cannot
keep up with the loss of water from melting
and sublimation. Glacial retreat since
1850 has been extensive.[18]
Human activities that alter the water cycle
include:
agriculture
industry
alteration of the chemical composition
of the atmosphere
construction of dams
deforestation and afforestation
removal of groundwater from wells
water abstraction from rivers
urbanization
Effects on climate[edit]
The water cycle is powered from solar
energy. 86% of the global evaporation
occurs from the oceans, reducing their
temperature by evaporative
cooling.[19] Without the cooling, the effect of
evaporation on the greenhouse effect
would lead to a much higher surface
temperature of 67 °C (153 °F), and a
warmer planet.[citation needed]
11. Aquifer drawdown or overdrafting and the
pumping of fossil water increases the total
amount of water in the hydrosphere, and
has been postulated to be a contributor to
sea-level rise.[20]
Effects on biogeochemical
cycling[edit]
While the water cycle is itself
a biogeochemical cycle,[21] flow of water
over and beneath the Earth is a key
component of the cycling of other
biogeochemicals. Runoff is responsible for
almost all of the transport
of eroded sediment and phosphorus[22] fro
m land to waterbodies. The salinity of the
oceans is derived from erosion and
transport of dissolved salts from the land.
Cultural eutrophication of lakes is primarily
due to phosphorus, applied in excess
to agricultural fields in fertilizers, and then
transported overland and down rivers.
Both runoff and groundwater flow play
significant roles in transporting nitrogen
from the land to waterbodies.[23] The dead
zone at the outlet of the Mississippi
River is a consequence of nitrates from
fertilizer being carried off agricultural fields
and funnelled down the river system to
the Gulf of Mexico. Runoff also plays a
part in thecarbon cycle, again through the
transport of eroded rock and soil.[24]
Slow loss over geologic time[edit]
Main article: Atmospheric escape
The hydrodynamic wind within the upper
portion of a planet's atmosphere allows
12. light chemical elements such
as Hydrogen to move up to the exobase,
the lower limit of theexosphere, where the
gases can then reach escape velocity,
entering outer space without impacting
other particles of gas. This type of gas loss
from a planet into space is known
as planetary wind.[25] Planets with hot lower
atmospheres could result in humid upper
atmospheres that accelerate the loss of
hydrogen.[26]
History of hydrologic cycle
theory[edit]
Floating land mass[edit]
In ancient times, it was thought that the
land mass floated on a body of water, and
that most of the water in rivers has its
origin under the earth. Examples of this
belief can be found in the works
of Homer (circa 800 BCE).
Precipitation and
percolation[edit]
By roughly 500 BCE, Greek scholars were
speculating that much of the water in
rivers can be attributed to rain. The origin
of rain was also known by then. These
scholars maintained the belief, however,
that water rising up through the earth
contributed a great deal to rivers.
Examples of this thinking included
Anaximander (570 BCE) (who also
speculated about the evolution of land
animals from fish[27]) and Xenophanes of
Colophon (530 BCE).[28] Chinese scholars
such as Chi Ni Tzu (320 BC) and Lu Shih
Ch'un Ch'iu (239 BCE) had similar
13. thoughts.[29] The idea that the water cycle
is a closed cycle can be found in the works
of Anaxagoras of Clazomenae (460 BCE)
and Diogenes of Apollonia(460 BCE).
Both Plato (390 BCE) and Aristotle (350
BCE) speculated about percolation as part
of the water cycle.
Precipitation alone[edit]
Up to the time of the Renaissance, it was
thought that precipitation alone was
insufficient to feed rivers, for a complete
water cycle, and that underground water
pushing upwards from the oceans were
the main contributors to river
water. Bartholomew of England held this
view (1240 CE), as did Leonardo da Vinci
(1500 CE) and Athanasius Kircher (1644
CE).
The first published thinker to assert that
rainfall alone was sufficient for the
maintenance of rivers was Bernard
Palissy (1580 CE), who is often credited
as the "discoverer" of the modern theory of
the water cycle. Palissy's theories were
not tested scientifically until 1674, in a
study commonly attributed to Pierre
Perrault. Even so, these beliefs were not
accepted in mainstream science until early
nineteenth century, and in some scientific
circles the contribution of ground water as
a major contributor to the water cycle was
still accepted into the early twentieth
century.[30]
14. A spillway is a structure used to provide the controlled release of flows from a dam or levee into a
downstream area, typically being the river that was dammed. In the UK they may be known
as overflow channels. Spillways release floods so that the water does not overtop and damage or
even destroy the dam. Except during flood periods, water does not normally flow over a spillway. In
contrast, an intake is a structure used to release water on a regular basis for water
supply, hydroelectricitygeneration, etc. Floodgates and fuse plugs may be designed into spillways to
regulate water flow and dam height. Other uses of the term "spillway" include bypasses of dams or
outlets of a channels used during highwater, and outlet channels carved through natural dams such
as moraines.
Types[edit]
A spillway is located at the top of the reservoir pool. Dams may also have bottom outlets with valves
or gates which may be operated to release flood flow, and a few dams lack overflow spillways and
rely entirely on bottom outlets.
Cross section of a spillway
15. There are two main types of spillways: controlled and uncontrolled.
A controlled spillway has mechanical structures or gates to regulate the rate of flow. This design
allows nearly the full height of the dam to be used for water storage year-round, and flood waters
can be released as required by opening one or more gates.
An uncontrolled spillway, in contrast, does not have gates; when the water rises above the lip
or crest of the spillway it begins to be released from the reservoir. The rate of discharge is controlled
only by the depth of water within the reservoir. Storage volume in the reservoir above the spillway
crest can only be used for the temporary storage of floodwater; it cannot be used as water supply
storage because it is normally empty.
In an intermediate type, normal level regulation of the reservoir is controlled by the mechanical
gates. If inflow to the reservoir exceeds the gate's capacity, an artificial channel called either
an auxiliary or emergency spillway that is blocked by a fuse plug dike will operate. The fuse plug is
designed to over-top and wash out in case of a large flood, greater than the discharge capacity of
the spillway gates. Although it may take many months to restore the fuse plug and channel after
such an operation, the total damage and cost to repair is less than i f the main water-retaining
structures had been overtopped. The fuse plug concept is used where it would be very costly to build
a spillway with capacity for the probable maximum flood.
Chute spillways[edit]
Chute spillways are common and basic in design as they transfer excess water from behind the dam
down a smooth decline into the river below. These are usually designed following an ogee curve.
Most often, they are lined on the bottom and sides with concrete to protect the dam and topography.
They may have a controlling device and some are thinner and multiply lined if space and funding are
tight. In addition, they are not always intended to dissipate energy like stepped spillways. Chute
spillways can be ingrained with a baffle of concrete blocks but usually have a 'flip lip' and/or
dissipator basin which creates a hydraulic jump, protecting the toe of the dam from erosion.[1]
Stepped spillways[edit]
Main article: Stepped spillway
16. A stepped chute baffled spillway of the Yeoman Hey Reservoir in England.
Stepped channels and spillways have been used for over 3,000 years.[2] Recently, new construction
materials (e.g. RCC, gabions) and design techniques (e.g. embankment overtopping protection)
have increased the interest in stepped spillways and chutes.[3][4] The steps produce considerable
energy dissipation along the chute[5] and reduce the size of the required downstream energy
dissipation basin.[6][7]
Research is still active on the topic, with newer developments on embankment dam overflow
protection systems,[7] converging spillways[8]and small weir design.[9]
Bell-mouth spillways [edit]
Bell-mouth spillway of Hungry Horse Dam in operation.
Some spillways are designed like an inverted bell so that water can enter all around the perimeter.
These uncontrolled spillway devices are also called morning glory,[10] plughole,[citation needed] glory
hole[10] or bell-mouth[11] spillways. In areas where the surface of the reservoir may freeze, this type of
spillway is normally fitted with ice-breaking arrangements to prevent the spillway from becoming ice-bound.
In some cases bell-mouth spillways are gate controlled. The spillway at Hungry Horse Dam (pictured
right), the highest morning glory structure in the world,[12] is controlled by a 64-by-12-foot (19.5 by
3.7 m) ring gate. However the largest remains in Lake Berryessa, measuring 72 feet in diameter at
the lake's surface.[13][14][15]
Siphon spillway[edit]
A siphon makes use of the difference in the height between the intake and the outlet to create a
pressure difference needed to remove excess water. Siphons however require priming or the
removal of air in the bend in order for them to function and most siphon spillways are designed with
a system that makes use of water to remove the air and automatically prime the siphon. One su ch
design is the volute siphon which makes use of water forced into a spiral vortex by volutes or fins on
a funnel that draw air out of the system. The priming happens automatically when the water level
rises above the inlets that are used to drive the priming process.[16]
17. Other types[edit]
Serrated weir spillway of Taiwan's Li-Yu-Tan Reservoir.
Other spillway types include an ogee crest which over-tops a dam, a side channel that wraps around
the topography of a dam and alabyrinth which uses a 'zig-zag' design to increase the sill length for a
thinner design and increased discharge. There is also a drop inletwhich resembles an intake for a
hydroelectric power plant but transfers water from behind the dam directly through tunnels to the
river downstream.[17]
Design considerations[edit]
The largest flood that needs be considered in the evaluation of a given project, regardless of
whether a spillway is provided; i.e., a given project should have structures capable of safely passing
the appropriate spillway design flood (SDF). A 100-year recurrence interval is the flood magnitude
expected to be exceeded on the average of once in 100 years. It may also be expressed as an
exceedance frequency with a one per cent chance of being exceeded in any given year.
Energy dissipation[edit]
A U.S. Bureau of Reclamation Type-III stilling basin
As water passes over a spillway and down the chute, potential energy converts into
increasing kinetic energy. Failure to dissipate the water's energy can lead to scouring and erosion at
the dam's toe (base). This can cause spillway damage and undermine the dam's stability. [18] To put
18. this energy in perspective, the spillways at Tarbela Dam could, at full capacity, produce 40,000 MW;
about ten times the capacity of its power plant.[19]
The energy can be dissipated by addressing one or more parts of a spillway's design.
Steps
First, on the spillway surface itself by baffles and/or steps along the spillway.
Flip bucket
Second, at the base of a spillway, a flip bucket can create a hydraulic jump and deflect water
upwards.
Ski jump
A ski jump can also direct water horizontally and eventually down into a plunge pool or two ski jumps
can direct their water discharges to collide with one another.[19][20]
Stilling basin
Third, a stilling basin at the terminus of a spillway serves to further dissipate energy and prevent
erosion. They are usually filled with a relatively shallow depth of water and sometimes lined with
concrete. A number of velocity-reducing components can be incorporated into the their design to
include chute blocks, baffle blocks, wing walls, surface boils or an end sill. [21]
Safety[edit]
Spillway gates may operate suddenly without warning, under remote control. Trespassers within the
spillway run the risk of drowning. Spillways are usually fenced and equipped with locked gates to
prevent casual trespassing within the structure. Warning signs, sirens, and other measures may be
in place to warn users of the downstream area of sudden release of water. Operating protocols may
require "cracking" a gate to release a small amount of water to warn persons downstream.
The sudden closure of a spillway gate can result in the stranding of fish, and this is also usually
avoided.
19. A culvert is a structure that allows water to flow under a road, railroad, trail, or similar obstruction.
Typically embedded so as to be surrounded by soil, a culvert may be made from a pipe, reinforced
concrete or other material. A structure that carries water above land is known as an aqueduct.
Culverts may be used to form a bridge-like structure to carry traffic. Culverts come in many sizes and
shapes including round, elliptical, flat-bottomed, pear-shaped, and box-like constructions. Culverts
may be made of concrete, galvanized steel, aluminum, or plastic, typically high density polyethylene.
Two or more materials may be combined to form composite structures. For example, open-bottom
corrugated steel structures are often built on concrete footings.
Plastic culvert liners are also inserted into failing concrete or steel structures in order to repair the
structure without excavating and closing the road. To prevent the older structure from collapsing, the
space between it and the plastic liner is usually filled
with grout.
Steel culvert with a plunge pool below
A multiple culvert assembly in Italy
Accidents due to culvert failures[edit]
Culverts fail due to corrosion of the materials from which they are made, or erosion of the soil around
or under them. If the failure is sudden and catastrophic, it can result in injury or loss of life.
Sudden road collapses are often at poorly designed culvert crossing sites. Water passing through
undersized culverts will scour away the surrounding soil over time. This can cause a sudden failure
during medium sized rain events. There are more than 5,000,000 culverts currently in use in the
United States alone. Continued inspection, maintenance, and replacement of these structures is
crucial for infrastructure and safety.
Accidents due to culverts can also occur if a flood overwhelms it, or disrupts the road or railway
above it.
20. Soil and sand carried through a culvert can wear away the galvanizing of a steel culvert, allowing it
to corrode and eventually collapse, disrupting the road or railway above it. This happened at a
culvert near Gosford, New South Wales in 2007, killing five.
Environmental impacts[edit]
This culvert has a natural surface bottom connecting wildlife habitat. Vermont
Safe and stable stream crossings can accommodate wildlife and protect stream health while
reducing expensive erosion and structural damage.
Undersized and poorly placed culverts can cause problems for water quality and aquatic organisms.
Poorly designed culverts can degrade water quality via scour and erosion and also restrict aquatic
organisms from being able to move freely between upstream and downstream habitat. Fish are a
common victim in the loss of habitat due to poorly designed crossing structures. Culverts that offer
adequate aquatic organism passage reduce impediments to movement of fish, wildlife and other
aquatic life that require instream passage. These structures are less likely to fail in medium to large
scale rain and snow melt events.[citation needed]
This culvert cannot accommodate wildlife passage
Poorly designed culverts are also more apt to become jammed with sediment and debris during
medium to large scale rain events. If the culvert cannot pass the water volume in the stream, the
water may overflow over the road embankment. This may cause signif icant erosion, washing out the
culvert. The embankment material that is washed away can clog other structures downstream,
21. causing them to fail as well. It can also damage crops and property. A properly sized structure and
hard bank armoring can help to alleviate this pressure.
Aquatic organism passage compatible culvert replacement in Franklin, Vermont, just upstream from Lake Carmi
Culvert style replacement is a widespread practice in stream restoration. Long-term benefits of this
practice include reduced risk of catastrophic failure and improved fish passage. If best management
practices are followed, short-term impacts on the aquatic biology are minimal.[1]
Minimum energy loss culverts[edit]
Culvert size relative to a person
In the coastal plains of Queensland (north-east Australia), torrential rains during the wet season
place a heavy demand on culverts. The natural slope of the flood plains is often very small and little
fall (or head loss) is permissible in the culverts. Professors Gordon R. McKay and Colin J. Apelt
developed and patented the design procedure of minimum energy loss culverts waterways which
yield small afflux. Colin J. Apelt, (emeritus) professor of civil engineering at the University of
Queensland, presented an authoritative review of the topic (1983) [2] and a well-documented
documentary (1994).[3]
A minimum energy loss culvert or waterway is a structure designed with the concept of minimum
head loss. The flow in the approach channel is contracted through a streamlined inlet into the barrel
where the channel width is minimum, and then it is expanded in a streamlined outlet before being
finally released into the downstream natural channel. Both the inlet and outlet must be streamlined to
avoid significant form losses. The barrel invert is often lowered to increase the discharge capacity.
22. The concept of minimum energy loss culverts was developed by Norman Cottman, shire engineer in
Victoria (Australia) and by Professor Gordon McKay, University of Queensland (Brisbane, Australia)
during the late 1960s.[4] While a number of small-size structures were designed and built in Victoria,
some major structures were designed, tested and built in South-East Queensland.
Forestry[edit]
In forestry, proper use of cross-drainage culverts can improve water quality while allowing forest
operations to continue.

![Precipitation falls on the ground, but what happens to that water depends greatly on the geography of the land at any
particular place.
The water cycle, also known as the hydrologic cycle or the H2O cycle, describes the continuous
movement of water on, above and below the surface of the Earth. The mass of water on Earth
remains fairly constant over time but the partitioning of the water into the major reservoirs of
ice, fresh water, saline water and atmospheric water is variable depending on a wide range
of climatic variables. The water moves from one reservoir to another, such as from river to ocean, or
from the ocean to the atmosphere, by the physical processes
of evaporation, condensation, precipitation, infiltration, runoff, and subsurface flow. In so doing, the
water goes through different phases: liquid, solid ( ice), and gas (vapor).
The water cycle involves the exchange of energy, which leads to temperature changes. For
instance, when water evaporates, it takes up energy from its surroundings and cools the
environment. When it condenses, it releases energy and warms the environment. These heat
exchanges influence climate.
The evaporative phase of the cycle purifies water which then replenishes the land with freshwater.
The flow of liquid water and ice transports minerals across the globe. It is also involved in reshaping
the geological features of the Earth, through processes including erosion and sedimentation. The
water cycle is also essential for the maintenance of most life and ecosystems on the planet.
Description[edit]
The Sun, which drives the water cycle, heats water in oceans and seas. Water evaporates as water
vapour into the air. Ice,rain and snow can sublimate directly into water vapour. Evapotranspiration is
water transpired from plants and evaporated from the soil. Rising air currents take the vapour up into
the atmosphere where cooler temperatures cause it to condense into clouds. Air currents move
water vapour around the globe, cloud particles collide, grow, and fall out of the upper atmospheric
layers as precipitation. Some precipitation falls as snow or hail, sleet, and can accumulate as ice
caps and glaciers, which can store frozen water for thousands of years. Most water falls back into
the oceans or onto land as rain, where the water flows over the ground as surface runoff. A portion
of runoff enters rivers in valleys in the landscape, with streamflow moving water towards the oceans.
Runoff and water emerging from the ground (groundwater) may be stored as freshwater in lakes.
Not all runoff flows into rivers, much of it soaks into the ground as infiltration. Some water infiltrates
deep into the ground and replenishes aquifers, which can store freshwater for long periods of time.
Some infiltration stays close to the land surface and can seep back into surface-water bodies (and
the ocean) as groundwater discharge. Some groundwater finds openings in the land surface and
comes out as freshwater springs. In river valleys and flood-plains there is often continuous water](data:image/gif;base64,R0lGODlhAQABAIAAAAAAAP///yH5BAEAAAAALAAAAAABAAEAAAIBRAA7)