SlideShare une entreprise Scribd logo
1  sur  27
Overview
As a social science student, it is vitally important that you
become an educated consumer of social science research, even
if you never get to conduct an actual research study.
You need to have a basic understanding of the steps in the
scientific process, a familiarity with commonly used social
science research designs and methods, and a knowledge of
procedures for collecting and analyzing social science data.
This module provides very basic information about these topics.
It addresses the following subjects:
· the scientific method
· qualitative and quantitative research
· data analysis and presentation
· discipline-specific research designs and methods The
Scientific Method
The scientific method is a form of inquiry that was originally
developed to answer questions in the natural sciences. The
scientific method uses systematic observation and measurement
to confirm or disconfirm hypotheses that most often are derived
from underlying theories.
When a hypothesis is confirmed, it lends support to the
underlying theory. When it is not confirmed, researchers must
reformulate the theory and come up with other explanations.
Scientists share their findings by presenting at conferences or
publishing in peer-reviewed journals. Sharing results with the
research world is an important part of the scientific method
because science is an iterative activity.
As social scientists, we have a great challenge. Because we
cannot exert complete control over human behavior, it is not
possible to conduct true experiments. Real life cannot be
captured in a lab, and human behavior cannot be explained by
one or even two causes. This makes it difficult to determine
"cause and effect." For example, if we are interested in knowing
why poor people have compromised health outcomes, we would
need to account for an impossibly large number of factors or
variables such as race, ethnicity, genetic markers, income,
education level, access to health care services, and living
conditions.
Steps for Conducting a Research Study
Figure 4.1
Steps for Conducting a Research Study
Source: UMUC PSYC 100.
The use of the scientific method allows researchers to develop
explanations of social science phenomena. The steps of the
research process are explained from a psychological perspective
in this tutorial (Bradley, 2000).
Step 1: Make an Observation
The starting place for any research study is an observation
(idea) regarding a topic of interest to you, the researcher. It may
come from a conversation with a friend, a book or television
program, or the conclusion of a related research project. All that
is needed at this point is your interest in pursuing the topic
further.
Let's take an example that we will use for all of the steps in the
process. You observe that you are able to memorize items such
as telephone numbers better when you eat candy. Because of
this, you wonder if there is a connection between the primary
component of candy (sugar) and memory.
Step 2: Propose a Hypothesis to Explain the Observation
Once you have your idea, the next step is to turn it into a
statement called a hypothesis. A hypothesis is
a testable prediction/belief of what will happen in some
circumstance. Developing a good hypothesis requires an
examination of the literature on that topic. Your research will
help you to learn how other researchers have conceptualized and
tested the hypothesis.
Example: You research the topic of memory enhancement and
see that other researchers have looked at how certain herbs and
a healthy diet can improve memory. However, no one* has
examined the effect of sugar on memory. On the basis of your
review of the literature, you formulate the following hypothesis:
"College students who ingest two grams of sugar before a
memorization task will perform better than college students who
do not ingest sugar."
(*Keep in mind that this is just an example and does not
accurately reflect the research literature on memory
enhancement.)
Step 3: Test the Hypothesis
In this step, you perform two important tasks:
1. You define all important terms and variables in your study.
As the researcher, you need to create an operational definition
of all important terms in your study so that others can replicate
it.
Example: "Sugar" and "memory" are terms that need to be
defined. Sugar could be defined as the substance in white sugar
cubes, while memory could be described as a score on a specific
memorization test.
Since you control the amount of sugar ingested by subjects in
this experiment, sugar is the independent variable. Scores on the
memorization test are the dependent variable. Preexisting
factors or characteristics can also be independent variables. For
example, if some of the subjects in the study have Type II
diabetes and others do not, diabetes could be an additional
independent variable.
2. You decide on the best research method to test your
hypothesis.
After you define the variables, you need to choose the best
research method. The best method depends on your hypothesis.
Psychologists typically choose from the five methods below.
Click on each method for a definition and examples. Which
would you choose for this study?
Figure 4.2
Social Science Research Methods
Source: UMUC PSYC 100.
Example: For our sugar study, we decide on the experimental
method. We divide a class of college students into two groups.
One group is given two grams of sugar cubes (the experimental
group); the second group is given two grams of sugarless
placebo cubes (the control group). After ingesting their cubes,
the two groups have three minutes to memorize a list of
nonsense syllables. After a five-minute break, both groups are
tested on the number of nonsense syllables that they can recall.
The number of correct syllables recalled represents their
memory score.
Step 4: Analyze Data
After you have collected the data, you select the statistical
procedures needed to prove or disprove your hypothesis. In the
"sugar/memory" experiment, you compare the number of
nonsense syllables that are correctly recalled by each group of
subjects. The "Data Analysis" section of this module provides
an introduction to statistical procedures that you might consider
for this analysis.
Step 5: State Conclusions About Your Hypothesis Based on
Data Analysis
The communication of research results is the final, important
step in the overall process. Your findings are based on your
analysis of the data collected. Researchers typically
communicate their results through the publication of journal
articles. They may also choose to present a poster or conduct a
discussion at a professional meeting or research conference.
Your findings may prompt others to conduct additional research
that may result in new findings leading to additional research,
and on and on.Social Science Research
Qualitative and Quantitative ResearchData AnalysisPresenting
Data
As a social science student, why is it important for you to
understand research methods? It is vitally important that you
become an educated consumer of social science research, even
if you never get to conduct an actual research study.
That means that you need to have a basic understanding of how
social science data are collected, analyzed, and presented. Like
it or not, statistics are an important component of those
activities. Let’s start with data collection.
Qualitative and Quantitative Research
Qualitative and quantitative research are two forms of scientific
inquiry characterized by their differences in philosophy,
methods, and results.
Qualitative Research
In qualitative research, the establishment of trust and rapport
with study participants is the foundation of the research. The
researcher cannot obtain in-depth and accurate information
about an individual's or group's experience without establishing
rapport with the participants. Establishing rapport enables the
researcher to gain access to important sources of data.
Qualitative researchers use various means of collecting
information or data to help them understand the experience of
study participants. One way of gathering data is
through participant observation. The researcher may venture
into the field and participate in rituals, ceremonies, or other
activities of the individuals being studied. Another way of
collecting data is by interviewing study participants. Interviews
use open-ended questions to allow study participants to provide
in-depth information about their experiences and understanding
of people and events.
Ethnography is a common form of qualitative research. It is an
in-depth study of an individual or group of people using
observed, self-reported, and secondary data. One example of
ethnography would be a study of the life story of a military
veteran to better understand the impact of war on the veteran’s
life and personal development. Data sources may include
interviews, personal journals, and meaningful artifacts. Those
sources are analyzed by examining important themes that
emerge from those resources. They may also include linguistic,
literary, and psychological analysis.
Quantitative Research
Quantitative research generates reliable, sample-based data that
can be generalized to larger populations and used to establish
cause-and-effect relationships. Data are expressed and recorded
as quantities using a standard system of measurement.
Quantities such as number, amount, time, frequency, or a host
of others may be measured.
Quantitative research encompasses
both correlational and experimental designs.
Correlational research examines relationships among variables.
An example is the relationship between frequency/duration of
exercise and diabetic health status (blood-sugar level). As the
frequency/duration of exercise increases, the blood-sugar level
decreases. This is an example of a negative correlation.
A positive correlation is one in which if one variable increases,
then the other variable increases as well (similarly, if one
variable decreases, the other variable decreases). An example of
a positive correlation is the relationship between religiosity and
perceived health status. The higher the level of religiosity, the
higher the level of self-reported wellness or health.
A correlation or relationship between two variables doesn't
mean that a change in one variable causes a change in the other.
It simply means there is a relationship between two variables.
The correlation coefficient is a measure of the strength of the
relationship between two variables. It can range from -1 to +1.
The closer the coefficient is to +1, the stronger the positive
association between variables. The closer the coefficient is to -
1, the stronger the negative association between variables. A
correlation coefficient of 0 means that there is no relationship
between the variables.
Figure 4.3
Graphing Correlational Data: Perfect Positive Correlation
Figure 4.4
Graphing Correlational Data: Perfect Negative Correlation
Experimental research attempts to prove that a change in one
variable causes a change in another variable. An experimental
study manipulates an independent variable to examine its effect
on an outcome (the dependent variable). Study participants are
randomly assigned to an experimental or control group. The
experimental group receives the intervention while the control
group does not. Then the outcomes are measured and compared.
One example of experimental research is the examination of the
impact of a new health-promotion program for seniors on
specific outcome or dependent variables such as food choice,
sleep patterns, or physical activity.
The decision of whether to choose a quantitative or a qualitative
design is a philosophical question that depends on the nature of
the project, the type of information needed, the context of the
study, and the availability of resources (time, money, and
personnel). This chart spells out some of the distinguishing
characteristics of quantitative and qualitative research.
Check your understanding of the differences between qualitative
and quantitative research by sorting these research
questions.Research MethodsRESEARCH QUESTIONS
Cultural anthropology: What was the significance of cats for the
people of ancient Egypt?
Forensic anthropology: What is the sex of a human skeleton?
Sociology (Social demography): How has the structure and
composition of the American family changed over the past
decades?
Sociology: What makes a high school student vulnerable to
dropping out of school?
Women's Studies: What do women earn in terms of average
salary, compared to men in similar jobs, in the United States?
Sociology: How do Americans feel about same-sex marriage?
Gerontology: What is it like to live in a nursing home?
Geography: How fast is the world's population growing?
Psychology: Is IQ lower in individuals with severe mental
illness?
Gerontology: What is the impact of ageism on health outcomes?
Now, check your understanding of the differences between
qualitative and quantitative research by classifying the
following research questions as qualitative or quantitative in
nature:QUALITATIVEQUANTITATIVEBOTH
METHODSFEEDBACK
RESET
Data Analysis
An understanding of certain basic statistical concepts such as
variables, hypotheses, scales of measurement, populations,
samples, and estimates is essential in the social sciences. This
section of the module examines the meaning of these concepts
by using an example.
Let's say that we want to look at how talkative people are in
general. There is a basic assumption inherent in this interest—
we assume that people vary in terms of their "talkativeness"
(i.e., some talk more than others). Therefore, we consider
"talkativeness" to be a variable. If we wanted to compare how
talkative people are at work compared to how talkative they are
at parties, then location (work vs. parties) would also be a
variable. We now have two distinct variables, talkativeness and
location.
In this case, location is our independent variable because we
have some control over it (it may help to use the first letter
of independent, i, to represent the phrase "I control").
Talkativeness is our dependent variable; we can measure it, but
we cannot control it (here, you may think of the first letter
of dependent, d, to represent "don't control").
Going further with our example, we will posit that people are
more talkative at parties than at work. This would be our
research hypothesis. The opposite of our research hypothesis is
that people are either equally talkative at work and parties, or
that they talk less at parties. These are called null hypotheses.
In order to evaluate our research hypothesis, we need to figure
out how to measure our two variables, location and
talkativeness. Location is an easily-measured variable. You can
only be in one place at a time (work vs. party)! You cannot be
working a bit and partying a lot at the same time (presumably)!
Therefore, the scale of measurement here is
considered nominal.
Talkativeness can be measured in many different ways. If we
compare the talkativeness of some people to the talkativeness of
others, then we have an ordinal scale of measurement. However,
if we count the number of actual words spoken, we have
a ratioscale of measurement.
We typically like to make statements about "people in general,"
but how can we do this when we are basing our results only on
the friends who are at our party? On the other hand, is it
feasible to invite all the people in the world to our party?
Therefore, we are drawing conclusions based on the behaviors
of a sample of the larger population. Nevertheless, by using the
appropriate research methods, we can make a guess
or estimate about talkativeness based on our sample situations.
As we move into the area of analyzing the data that we’ve
collected, let’s look at a different example. Suppose we were to
ask you, "How many movies have you seen per week in the past
year?"
Let’s say you can only remember the number of movies that you
saw during each of the last 10 weeks. This is a sample since you
don’t have numbers for all 52 weeks. Suppose that the
numerical values for the past 10 weeks of movies are:
Figure 4.5
Sample Frequency Data
Week 1
Week 2
Week 3
Week 4
Week 5
Week 6
Week 7
Week 8
Week 9
Week 10
2
1
3
1
4
1
3
2
1
1
Source: UMUC STAT 225.
Making Sense of Raw Data
Raw data such as numbers of movies watched per week per year
only make sense when they are organized. There are two
standard ways of making sense of distributions of raw data. The
first method is aimed at counting the amount (or frequency) of
data that is of a particular value or range of values. The
numerical representation of all these individual frequencies of a
distribution is called a frequency distribution.
Translating the above raw data into a frequency distribution, we
have:
Figure 4.6
Sample Frequency Chart
Number of Movies
Frequency
1
5
2
2
3
2
4
1
Source: UMUC STAT 225.
Central Tendency
Central tendency is one of the most basic concepts used to make
sense of a data distribution. It is used to answer questions that
contain words like usually, typically, and average; questions
such as "How many movies do you see during an average
week?" All of these words describe what we generally expect to
happen. This is the core of the concept of central tendency.
Of course, nothing is that simple in statistics. We must have a
few ways of describing central tendency in order to make it
more complicated! There are three types of central tendency:
the mean, median, and mode. Any distribution has all three
types.
The Mean
The mean of a distribution is the mathematical "average." To
obtain its specific value, you simply add all the scores and
divide by n(the number of scores). The mean number of movies
in our sample is 1.5.
The Median
The median of a distribution is the value representing the
middle point of that distribution, with half the scores falling
above it and half below. To find the specific value, you simply
use the formula, (n + 1)/2. For our movie example, n = 10.
Therefore, the median would be the value associated with the
(10 + 1)/2 = 5.5.
The Mode
The mode is simply the most frequently occurring score.
Looking at our movie example, we see that in five out of the 10
weeks, you saw only one movie. One movie per week is the
most frequently occurring score in this distribution. Therefore,
the mode in this example is one. Sometimes two or more scores
share the highest degree of frequency. In these cases, you have
bimodal or multimodal distributions. While a distribution can
have only one mean and median, it can have more than one
mode.
Comparing the Mean, Median, and Mode
The mean and the median both take all the scores of a
distribution into consideration when calculating central
tendency. Furthermore, the mean takes into consideration each
score's specific numerical value. The median uses the
knowledge that a distribution has x number of scores to
determine central tendency. The mode ignores all information
except which score occurs most frequently. In the next section,
we cover variability. We will see that different measures of
variability are very similar to these three types of central
tendency.
Let’s say we had different samples of how many movies you
watched over the last year. Each sample recorded 10 weeks of
movie watching, but no two samples had the identical set of 10
weeks in it. What we would probably see is similar mean values
for all samples; in other words, the means would be more alike
than either the medians or modes. You can also say that "the
mean is the type of central tendency that is least subject to
sampling variability."
Graphing
The second method of making sense of a frequency distribution
is graphing. Graphing takes the numerical summary of a
distribution and provides a visual representation of it. Various
types of graphical figures can be used, depending on the types
of data and the way they are organized. Graphs offer the ability
to step back and look at the big picture rather than getting stuck
in the minutia of numerical values of a distribution. See the
"Presenting Data" section for some examples of frequency
graphs.
Variability
If we were to ask people how many movies they tend to see per
month, the response might be "two, give or take one." The
"two" is an estimate of central tendency and the "give or take
one" is a guess about variability. This idea of variability is
important because not all values in a distribution are the same.
Values can differ a great deal or just a little. Variability gives
us a sense of the extent to which scores are alike. It is another
important characteristic of a distribution.
For example, another classmate says that "on average" she sees
the same number of movies per week as you do. She says that
the number of movies she has seen in the last 10 weeks,
respectively, are:
Figure 4.7
Movies Per Week (Individual Data)
4
4
0
1
4
2
0
1
1
1
Source: UMUC STAT 225.
Organizing these data creates the following frequency
distribution:
Figure 4.8
Frequency Distribution (Individual)
Number of Movies
Frequency
0
4
1
1
2
1
3
0
4
4
Source: UMUC STAT 225
The mean and median values for your classmate’s movie
distribution are the same as those for your distribution (in the
central tendency activity). However, by looking at them, you
can see they differ in their variability. This section looks at
standard ways used to measure this variability.
The Range
The range is a lot like the mode. Remember, the mode
represented the most frequently occurring value. The range is
similar in that it captures the highest and lowest scores of a
distribution, neglecting the information contained in between.
The range is useful to get a sense of how broad (or variable) is
the score distribution. It is limited by its ability to describe the
extremes, but not the internal variability of a distribution.
The Standard Deviation and Variance
What if we want to get a measure of how scores vary from some
central tendency? Since the mean value is the one measure of
central tendency that takes into consideration the value of every
score, we use standard deviation and variance to perform this
calculation. Standard deviation and variance are very similar
concepts. The only difference is that variance is in squared
units, and the standard deviation is not.
Z Scores
We learned in the previous sections that the mean and standard
deviation are significant characteristics of any distribution.
Another significant characteristic is unit of measurement (e.g.,
meters vs. inches). Would you expect to get the same value for
a person’s height in meters as in inches? Of course you
wouldn't. But you would agree that they measured the same
degree of height but just in different kinds of units.
Z scores solve that problem. They are a universal form of
measurement. Transforming regular scores into z scores
(otherwise known as standard scores) allows a comparison
across different units of measurement. How can this be? Look at
the example on height we just talked about. Transforming
meters and inches into z scores allows an easy comparison of
mean values (subtraction) and standard deviation (division).
The two new z distributions should be identical (if the original
measurements are precise).
The Normal Curve
The normal or "bell curve" represents a normal distribution of
data that always "behaves" in the same manner. A seemingly
infinite number of datasets exhibit this pattern. Mathematical
formulas (or functions) for a bell curve are identical with the
exception of their mean values and standard deviations.
If we were to take the means and standard deviations out of any
normal distribution, we would be left with z scores. This is
called "the z distribution." The standard normal (z) distribution
allows us to find percentages, percentiles, and proportions
associated with a single score or the area between scores.
Figure 4.9
Normal Distribution (Bell) Curve
Source: UMUC STAT 225.
Inferential Statistics
Inferential statistics provides us with the means to make
statements about what is likely to be true about populations
based upon information about a smaller segment of that
population (sample).
For example, imagine that we want to see if a new type of
medication helps allergy sufferers by decreasing the severity of
their symptoms. It would be difficult, and very expensive, to
test the drug on all the allergy sufferers in the world. So
instead, we try it on a sample and see what happens for this
smaller group.
Let’s say we find that, for the allergy sufferers in the sample,
their symptoms are reduced by 50 percent. What we are really
interested in is the whole population of allergy sufferers. So we
use the information we got from the sample and guess what
might be true for the population. In this case, we would estimate
that on average, the symptoms of all allergy sufferers (a
population) would be reduced by 50 percent if the medicine
were used.
We use a sample statistic to provide an estimate of a population
parameter. Inferential statistics allows us to evaluate whether
our estimate is predictable or just due to chance. To help us
decide whether the difference is due to chance, we use
probability theory.
Probability and Statistical Significance
As scientists, when we conduct an experiment or make
observations, we are hoping for definitive findings. The term
"probability" (or likelihood) refers to how likely it is that an
event will occur or that a statement is true. A probability is
given as a percentage from 0 (0 percent chance of occurring) to
100 (100 percent chance of occurring).
If we get the same result in 100 percent of our experiments, we
can be confident that our results are "real" (or true), but what
conclusions can we draw if the same result occurs only 50
percent of the time? We may conclude that extraneous variables
or conditions are affecting our results. If we get similar results
when we "control" for these variables or conditions, we need to
face the possibility that our findings are not real; they may be
occurring by chance or coincidence. How do we calculate that
likelihood?
The term statistical significance refers to whether the
probability of the difference between two results is real or due
to chance alone. Statistical significance is expressed in terms of
levels of confidence. We can say that the probability that a
result is due to chance is less than 5 percent. We can also say
that we are 95 percent confident that a research finding is real,
and not due to chance. If we want to be even more conservative,
we can say that the probability that the difference is due to
chance is less than 1 percent, or that we are 99 percent
confident that our result is not due to chance. These probability
values are usually reported in research articles as p<.05 and
p<.01, respectively.
Presenting Data
Presenting data clearly is as important to the success of a
research study as methods and statistical procedures. As you
look at the following table and graphs, ask yourself why the
researcher decided to present the data in this way.
Click on the individual figure number to check your response.
Figure 4.10
Ratio Data Presented in a Table
Ratio of
Social Security Covered Workers
to Beneficiaries
Calendar Years 1940-2010
Year
Covered Workers (in thousands)
Beneficiaries (in thousands)
Ratio
1940
35,390
222
159.4
1945
46,390
1,106
41.9
1950
48,280
2,930
16.5
1955
65,200
7,563
8.6
1960
72,530
14,262
5.1
1965
80,680
20,157
4.0
1970
93,090
25,186
3.7
1975
100,200
31,123
3.2
Source: U.S. Social Security Administration.
Figure 4.11
Trend-Mapping Graph
Source: Nature Reviews Drug Discovery.
Figure 4.12
Scatterplot Graph
Source: National Institutes of Health, Research Services
Branch.
Figure 4.13
Bar Graph
Source: National Kidney and Urologic Diseases Information
Clearinghouse (NKUDIC).
Figure 4.14
3-D Bar Graph
Source: National Institutes of Health, National Eye Institute.
Figure 4.15
Pie Chart
Source: National Institutes of Health, National Center for
Alternative and Complementary Medicine.
Figure 4.16
Standard Line Graph
Source: National Institutes of Health.
Figure 4.17
3-D Shape Graph
Source: Journal of Automated Methods and Management in
Chemistry. Used under the terms of the Creative Commons
Attribution license.
Graphing Tutorial
To check your knowledge and skills in presenting data
graphically, give this graphing tutorial a try.
Discipline-Specific Research Methods
AnthropologistsGerontologistsPsychologistsSociologistsSumma
ry
Natural scientists and some behavioral scientists rely heavily on
classic experimentation as the primary tool for scientific
research. The power of the experimental method is that
scientists tightly control the conditions under which a
phenomenon is observed so that they can minimize the
likelihood that observations are due to chance or error. In so
doing, researchers can determine "causality"—that is, they can
conclude that a change in one variable causes a change in
another.
Classic experimentation is not always possible in the social
sciences. Social scientists study complex phenomena such as
cultures, social norms, and behavior that are dynamic and are
affected by multiple factors; therefore, it is not always possible
to conduct true experiments because it is impossible to allow
for every influential factor.
So, how do social scientists conduct research? Do
anthropologists tend to use different methods than
psychologists, for example? If so, what are the methods
typically used by each discipline? Do social scientists ever
"borrow" methods used by other disciplines to answer their
research questions?
To introduce this topic, let’s look at the ways that different
social science disciplines might investigate the life stage known
as "retirement." Try to predict research questions that might be
posed by different disciplines and the methods that they might
use to answer them before you click on the lenses on the left
side of the graphic.
Figure 4.18
Retirement, Through a Social Sciences Lens
Anthropologists
Anthropologists have a varied toolkit available to them to
answer their research questions. They are well-known for their
qualitative research approach, although they also use
quantitative methods. Human beings are complex biological and
cultural organisms, so anthropologists will integrate
quantitative and qualitative approaches in their work.
Here’s an example to illustrate this: People must drink and eat
to survive. How would an anthropologist study this behavior?
An anthropologist may use a quantitative research approach to
examine how food is apportioned differently between men and
women in diverse settings. The anthropologist may ask the
research question—are men allotted more high-protein food
than women in certain cultures, and if so, what are the health
outcomes of this difference? An anthropologist also may seek to
understand and represent the ways men and women feel about
these differences in food apportionment; this is a qualitative
research question.
The two research methods that are thought to distinguish
anthropology from other social science disciplines
are ethnography and participant observation.
Ethnography is a research method that employs personal
observations of a living culture. In their fieldwork,
anthropologists ask open-ended questions that allow people to
respond as they wish. Anthropologists call the people they
study informants or consultants to emphasize the expertise of
the people and the fact that the people are the experts rather the
"subjects" of experiments or "respondents" to a survey with
forced-choice questions.
To construct an ethnography, anthropologists ask informants to
detail their life histories, draw pictures and maps, tell stories,
demonstrate how they make their art and artifacts, or cook their
food. In other words, they ask informants to show and tell what
it means to live their particular lives. They use statistical
procedures or qualitative analyses to make sense of their data.
Anthropologists are interested in uncovering
both emic and etic points of view―that is, they try to identify
the point of view of the people being studied ("emic") as well as
other "outside" perspectives ("etic"). For example, surveys
often ask demographic questions that divide people into groups
according to age, education, income, marital status, religion,
and ethnic group or race. These are standard "etic" categories,
typically agreed upon by Western researchers as important
markers of difference. On the other hand, people may or may
not identify themselves according to these categories, and they
may also have other "emic" categories for grouping people, such
as clan, political group, or musical style. Indeed, they may not
think in terms of differences among people at all.
To better understand the "emic" and "etic" perspectives for the
people they are studying, cultural anthropologists
use participant observation. In this way, they experience a
culture from the "inside" and the "outside." Participant
observation is a fieldwork method in which a researcher lives in
and participates in a culture. At the same time, he or she
observes everyday life and learns how the society actually
works. Gerontologists
Gerontologists are interdisciplinary by training, so they rely on
a variety of research methods to answer important scientific
questions about aging. They may use surveys to gather
information about attitudes and feelings. They may use
unstructured interviews and observations to better understand
the experience of aging from the perspective of an older adult.
Gerontologists interested in health outcomes may collect
physical and behavioral measurements.
Because gerontologists are interested in the process of aging,
they rely heavily on research designs that follow participants
through time. Two such examples are:
· longitudinal studies (also known as "panel studies") that
collect data repeatedly from the same participants over an
extended period of time.
· cohort sequential design, a longitudinal design that follows
multiple cohorts across time and allows researchers to
differentiate among age, period, and cohort effects (described
below). The primary disadvantage of this type of research is
that it is expensive, labor-intensive, and takes a long time to
complete.
The challenge for gerontologists is to determine whether
changes are due to cohort effects, period effects, or age effects.
Cohort effects = Differences between age groups due to the time
period in which people are born and raised.
For example, the experience of an African American person
born in 1930 (prior to the Civil Rights movement) is very
different from that of an African American person born in
1980.
Period effects = Differences between age groups attributable to
an historic event or time period.
As an example, if we notice that US alcohol consumption in
people 50 and older increases dramatically between 1930 and
1940, we might draw the conclusion that as people get older,
they drink more; however, if we remember that Prohibition
ended in 1933, we might draw a very different conclusion. That
is, the reason people seemed to drink more as they got older is
that the ban on alcohol ended during the time period of
interest.
Age effects = Physiological, psychosocial, and behavioral
changes that are attributable to getting older.
For example, nearly all of us will have some degree of
atherosclerosis (hardening of the arteries) as we get older, but
what are the psychosocial and behavioral changes that are
attributable to the aging process? One example of a true aging
effect is that of criminal behavior. Across many generations and
time periods, it has been shown that criminality is higher among
teens and young adults. As people age, they are less likely to
commit crimes (Hirschi & Gottfredson, 1983).
When gerontologists are not interested in "process"(change over
time), they may choose a cross-sectional study design. Cross-
sectional studies gather data across groups at a single point in
time. They tell researchers little about whether differences in
age groups can be attributed to age, period, or cohort effects.
For example, a gerontologist may compare the eating habits of
two groups of 75-year-old men—one group that lives at home,
and another in an assisted living environment.
Gerontologists often use their research to advocate for changes
in policy and legislation that directly impact older Americans.
They are at the forefront when it comes to decisions on Social
Security, retirement, Medicare, transportation, and other
issues.Psychologists
Modern psychology is defined as the scientific study of
behavior and mental processes and how they are affected by an
organism's physical state, mental state, and external
environment (Tavris & Wade, 1995).
Let's break down the definition. Behavior refers to any action
that can be observed and measured. For example, smiling at a
friend, crying at a movie, or blinking your eyes in response to a
bright light are examples of behaviors. Mental processes refer
to internal aspects of our lives, including thinking, feeling, and
perceiving. Thus, calculating 7 + 9, recalling your 16th
birthday, and experiencing happiness are mental processes. Our
behavior and mental experiences can influence or be influenced
by genetics, physical health, level of intelligence, economic
situation, culture, ethnicity, and other aspects of our
environment.
An important element of psychological research is empiricism,
the reliance on information from direct observation and
measurement. Experimental psychologists test their hypotheses
on laboratory animals in controlled environments, while clinical
psychologists conduct their research on human subjects in their
natural surroundings.
Psychologists rely heavily on the following research designs:
· Correlational research that examines the relationship between
variables. Correlational research does not yield cause-and-effect
conclusions.
· Descriptive research that describes the characteristics of a
population or phenomenon of interest. Through the use
of descriptive statistics such as averages, frequencies, and
ranges, researchers can make observations about the prevalence
of certain variables and can make comparisons among groups.
Because psychologists are interested in the measurement of
behaviors, attitudes, and beliefs, they are skilled in the
development and use of instruments that capture those
constructs. Sophisticated statistical tools allow them to analyze
and interpret correlational and descriptive research data.
Sociologists
Sociologists seek to uncover the social factors that affect
behavior. The goal of sociologists is to obtain data that test
assumptions about the social world. The sociological
perspective requires us to look beyond our common sense
(which can be faulty), our experience (which can be limited),
and our values (which are bound in time and culture) to gain
new understandings of the social world.
Sociologists may use quantitative, qualitative, or mixed
methods in their research. The methods used for a sociological
study depend upon the research questions being asked.
Quantitative research in sociology employs methods such
as surveys (developed to answer specific research questions)
and secondary data analysis (research using existing data sets
gathered for general purposes). A quantitative design attempts
to amass information from large numbers of people. It often
requires respondents to answer prepared (close-ended)
questions. Close-ended questions are limiting in that they do not
allow respondents to describe how they see or experience their
world.
Qualitative research employs some of the methods already
discussed for other social sciences. Qualitative methods
include interviews (asking people open-ended
questions), content analysis (research to study content to
uncover the explicit and implicit or hidden meanings),
and participant observation (observation of, and involvement in,
the social interaction patterns of groups). In qualitative studies,
sociologists may ask subjects why they act in certain ways or
what rules and assumptions govern their behavior. Questions in
qualitative research instruments are more open-ended.
The following are limitations of qualitative methods:
· greater potential for bias (because researchers themselves can
be influenced by their subjects)
· difficulty in generalizing findings to larger groups, given the
small sample size in studies
Summary
What sets the social science disciplines apart from each other?
Anthropologists, gerontologists, psychologists, and sociologists
all select their research designs and methods based on clearly
articulated research hypotheses and questions. Their designs
and methods can be either qualitative, quantitative, or mixed.
What truly sets the disciplines apart are the principles and
theories that guide their research and interpretation of data.
For more information on those principles and theories, check
out the Social Science Perspectives module.References
Agarwal, P. & Searls, D. B. (2009, November). Can literature
analysis identify innovation drivers in drug discovery? Nature
Reviews Drug Discovery, 8, 865–878. doi:10.1038/nrd297.
Bianchin, J. N., Martendal, E., & Carasek, E. (2011, June 28).
Determination of trace silver in water samples by online column
preconcentration flame atomic absorption spectrometry using
termite digestion product. Journal of Automated Methods and
Management in Chemistry. Retrieved from
http://openi.nlm.nih.gov/imgs/rescaled512/3142775_JAMMC20
11-839365.008.png.
Bradley, M. E. (2000). The cyberlab for psychological research.
Retrieved July 22, 2013, from
http://faculty.frostburg.edu/mbradley/cyberlab.html
Hirschi, T., & Gottfredson, M. (1983). Age and the explanation
of crime. American Journal of Sociology, 89(3), 552–584.
Nahin, R. L., Barnes, P. M., Stussman, B. J., and Bloom, B.
(2009). Costs of complementary and alternative medicine
(CAM) and frequency of visits to CAM practitioners: United
States, 2007. National Health Statistics Reports No. 18.
Hyattsville, MD: National Center for Health Statistics.
Retrieved July 24, 2013, from
http://nccam.nih.gov/about/plans/2011/introduction.htm.
National Institutes of Health, National Eye Institute. (n.d.).
Congressional justification for FY 2007. Retrieved July 24,
2013, from
http://www.nei.nih.gov/news/congressjust/cj2007.asp.
National Institutes of Health, Research Services Branch. (n.d.).
Image processing and analysis in Java (plug-ins, Fraclac).
Retrieved July 24, 2013, from
http://rsbweb.nih.gov/ij/plugins/fraclac/FLHelp/Subs.htm
National Kidney and Urologic Diseases Information
Clearinghouse (NKUDIC). (2012, June). Kidney disease
statistics for the United States (ESRD incident rate). Retrieved
July 24, 2013, from
http://kidney.niddk.nih.gov/kudiseases/pubs/kustats/images/Adj
std_Incident_Rates_ESRD.jpg
OverviewAs a social science student, it is vitally important t.docx

Contenu connexe

Similaire à OverviewAs a social science student, it is vitally important t.docx

1. You can use the book, the Internet, and other reliable sources,
1. You can use the book, the Internet, and other reliable sources,1. You can use the book, the Internet, and other reliable sources,
1. You can use the book, the Internet, and other reliable sources,BenitoSumpter862
 
1. You can use the book, the Internet, and other reliable sources,
1. You can use the book, the Internet, and other reliable sources,1. You can use the book, the Internet, and other reliable sources,
1. You can use the book, the Internet, and other reliable sources,SantosConleyha
 
UNIT-1 BRM marketing to my career to solar.pptx
UNIT-1 BRM marketing to my career to solar.pptxUNIT-1 BRM marketing to my career to solar.pptx
UNIT-1 BRM marketing to my career to solar.pptxJANNU VINAY
 
Mba724 s3 2 elements of research design v2
Mba724 s3 2 elements of research design v2Mba724 s3 2 elements of research design v2
Mba724 s3 2 elements of research design v2Rachel Chung
 
Chapter 1 Social Research
Chapter 1 Social ResearchChapter 1 Social Research
Chapter 1 Social Researcharpsychology
 
Ayesha iftikhar
Ayesha iftikharAyesha iftikhar
Ayesha iftikharFJWU
 
Research methods (arfan rai) assignment
Research methods (arfan rai) assignmentResearch methods (arfan rai) assignment
Research methods (arfan rai) assignmentArfan rai
 
Drug Addiction docx
Drug Addiction docxDrug Addiction docx
Drug Addiction docxSafeer Ali
 
Insocio lecture 2 sociological research process lecture
Insocio lecture 2 sociological research process lectureInsocio lecture 2 sociological research process lecture
Insocio lecture 2 sociological research process lectureCarlos Molina
 
Is Chocolate Your Key to Understanding Qualitative Research?
Is Chocolate Your Key to Understanding Qualitative Research? Is Chocolate Your Key to Understanding Qualitative Research?
Is Chocolate Your Key to Understanding Qualitative Research? QuekelsBaro
 
Research methodology
Research methodology Research methodology
Research methodology Balaji P
 
Research methodology as per the syllabus of CDLU Sirsa
Research methodology as per the syllabus of CDLU SirsaResearch methodology as per the syllabus of CDLU Sirsa
Research methodology as per the syllabus of CDLU SirsaParveen Vashisth
 
Course OverviewResearch, regardless of the venue, is an ac.docx
Course OverviewResearch, regardless of the venue, is an ac.docxCourse OverviewResearch, regardless of the venue, is an ac.docx
Course OverviewResearch, regardless of the venue, is an ac.docxvanesaburnand
 

Similaire à OverviewAs a social science student, it is vitally important t.docx (20)

SociologyExchange.co.uk Shared Resource
SociologyExchange.co.uk Shared ResourceSociologyExchange.co.uk Shared Resource
SociologyExchange.co.uk Shared Resource
 
SociologyExchange.co.uk Shared Resource
SociologyExchange.co.uk Shared ResourceSociologyExchange.co.uk Shared Resource
SociologyExchange.co.uk Shared Resource
 
1. You can use the book, the Internet, and other reliable sources,
1. You can use the book, the Internet, and other reliable sources,1. You can use the book, the Internet, and other reliable sources,
1. You can use the book, the Internet, and other reliable sources,
 
1. You can use the book, the Internet, and other reliable sources,
1. You can use the book, the Internet, and other reliable sources,1. You can use the book, the Internet, and other reliable sources,
1. You can use the book, the Internet, and other reliable sources,
 
UNIT-1 BRM marketing to my career to solar.pptx
UNIT-1 BRM marketing to my career to solar.pptxUNIT-1 BRM marketing to my career to solar.pptx
UNIT-1 BRM marketing to my career to solar.pptx
 
Mba724 s3 2 elements of research design v2
Mba724 s3 2 elements of research design v2Mba724 s3 2 elements of research design v2
Mba724 s3 2 elements of research design v2
 
Chapter 1 Social Research
Chapter 1 Social ResearchChapter 1 Social Research
Chapter 1 Social Research
 
Ayesha iftikhar
Ayesha iftikharAyesha iftikhar
Ayesha iftikhar
 
Research methods (arfan rai) assignment
Research methods (arfan rai) assignmentResearch methods (arfan rai) assignment
Research methods (arfan rai) assignment
 
Drug Addiction docx
Drug Addiction docxDrug Addiction docx
Drug Addiction docx
 
Why Social Research
Why Social ResearchWhy Social Research
Why Social Research
 
PR2_Wk1-2.pptx
PR2_Wk1-2.pptxPR2_Wk1-2.pptx
PR2_Wk1-2.pptx
 
Insocio lecture 2 sociological research process lecture
Insocio lecture 2 sociological research process lectureInsocio lecture 2 sociological research process lecture
Insocio lecture 2 sociological research process lecture
 
Is Chocolate Your Key to Understanding Qualitative Research?
Is Chocolate Your Key to Understanding Qualitative Research? Is Chocolate Your Key to Understanding Qualitative Research?
Is Chocolate Your Key to Understanding Qualitative Research?
 
Evaluation Of A Research Methodology Essay
Evaluation Of A Research Methodology EssayEvaluation Of A Research Methodology Essay
Evaluation Of A Research Methodology Essay
 
Research methodology
Research methodology Research methodology
Research methodology
 
Research Methodolgy Part 1
Research Methodolgy Part 1Research Methodolgy Part 1
Research Methodolgy Part 1
 
Research methodology as per the syllabus of CDLU Sirsa
Research methodology as per the syllabus of CDLU SirsaResearch methodology as per the syllabus of CDLU Sirsa
Research methodology as per the syllabus of CDLU Sirsa
 
Research Essay Questions
Research Essay QuestionsResearch Essay Questions
Research Essay Questions
 
Course OverviewResearch, regardless of the venue, is an ac.docx
Course OverviewResearch, regardless of the venue, is an ac.docxCourse OverviewResearch, regardless of the venue, is an ac.docx
Course OverviewResearch, regardless of the venue, is an ac.docx
 

Plus de karlhennesey

Resources Assigned readings, ERRs, the Internet,and other resources.docx
Resources Assigned readings, ERRs, the Internet,and other resources.docxResources Assigned readings, ERRs, the Internet,and other resources.docx
Resources Assigned readings, ERRs, the Internet,and other resources.docxkarlhennesey
 
Resource Review Documenting the Face of America Roy Stryker and.docx
Resource Review Documenting the Face of America Roy Stryker and.docxResource Review Documenting the Face of America Roy Stryker and.docx
Resource Review Documenting the Face of America Roy Stryker and.docxkarlhennesey
 
Resource Review Thelma Golden--How Art Gives Shape to Cultural C.docx
Resource Review Thelma Golden--How Art Gives Shape to Cultural C.docxResource Review Thelma Golden--How Art Gives Shape to Cultural C.docx
Resource Review Thelma Golden--How Art Gives Shape to Cultural C.docxkarlhennesey
 
Resource Review Representational Cityscape, and Ch. 3 of Oxfo.docx
Resource Review Representational Cityscape, and Ch. 3 of Oxfo.docxResource Review Representational Cityscape, and Ch. 3 of Oxfo.docx
Resource Review Representational Cityscape, and Ch. 3 of Oxfo.docxkarlhennesey
 
Resource Part 2 of Terrorism TodayYou work on a national se.docx
Resource Part 2 of Terrorism TodayYou work on a national se.docxResource Part 2 of Terrorism TodayYou work on a national se.docx
Resource Part 2 of Terrorism TodayYou work on a national se.docxkarlhennesey
 
Resources Appendix A, The Home Depot, Inc. Annual Report in Fun.docx
Resources Appendix A, The Home Depot, Inc. Annual Report in Fun.docxResources Appendix A, The Home Depot, Inc. Annual Report in Fun.docx
Resources Appendix A, The Home Depot, Inc. Annual Report in Fun.docxkarlhennesey
 
Resources Annotated Bibliography document. Research five websites t.docx
Resources Annotated Bibliography document. Research five websites t.docxResources Annotated Bibliography document. Research five websites t.docx
Resources Annotated Bibliography document. Research five websites t.docxkarlhennesey
 
Resources American History, Primary Source Investigator;Cente.docx
Resources American History, Primary Source Investigator;Cente.docxResources American History, Primary Source Investigator;Cente.docx
Resources American History, Primary Source Investigator;Cente.docxkarlhennesey
 
Resource University of Phoenix Material Data SetDownload the.docx
Resource University of Phoenix Material Data SetDownload the.docxResource University of Phoenix Material Data SetDownload the.docx
Resource University of Phoenix Material Data SetDownload the.docxkarlhennesey
 
Resource Ch. 6 & 7 of Financial AccountingComplete Brief Ex.docx
Resource Ch. 6 & 7 of Financial AccountingComplete Brief Ex.docxResource Ch. 6 & 7 of Financial AccountingComplete Brief Ex.docx
Resource Ch. 6 & 7 of Financial AccountingComplete Brief Ex.docxkarlhennesey
 
Resource Films on DemandCrime and Punishment”Experiment Res.docx
Resource Films on DemandCrime and Punishment”Experiment Res.docxResource Films on DemandCrime and Punishment”Experiment Res.docx
Resource Films on DemandCrime and Punishment”Experiment Res.docxkarlhennesey
 
Resource Managing Environmental Issues Simulation(or research a.docx
Resource Managing Environmental Issues Simulation(or research a.docxResource Managing Environmental Issues Simulation(or research a.docx
Resource Managing Environmental Issues Simulation(or research a.docxkarlhennesey
 
Resource Ch. 9 of Introduction to Business Create a 5-to-7 slide .docx
Resource Ch. 9 of Introduction to Business Create a 5-to-7 slide .docxResource Ch. 9 of Introduction to Business Create a 5-to-7 slide .docx
Resource Ch. 9 of Introduction to Business Create a 5-to-7 slide .docxkarlhennesey
 
Resource Ch. 9 of Introduction to Business Complete the table in .docx
Resource Ch. 9 of Introduction to Business Complete the table in .docxResource Ch. 9 of Introduction to Business Complete the table in .docx
Resource Ch. 9 of Introduction to Business Complete the table in .docxkarlhennesey
 
Resource Ch. 3 of ManagementIdentify a time in your life wh.docx
Resource Ch. 3 of ManagementIdentify a time in your life wh.docxResource Ch. 3 of ManagementIdentify a time in your life wh.docx
Resource Ch. 3 of ManagementIdentify a time in your life wh.docxkarlhennesey
 
Resource Significant Health Care Event Paper Grading Criteria.docx
Resource Significant Health Care Event Paper Grading Criteria.docxResource Significant Health Care Event Paper Grading Criteria.docx
Resource Significant Health Care Event Paper Grading Criteria.docxkarlhennesey
 
Resource Ch. 3 of Financial AccountingComplete Exercises E3.docx
Resource Ch. 3 of Financial AccountingComplete Exercises E3.docxResource Ch. 3 of Financial AccountingComplete Exercises E3.docx
Resource Ch. 3 of Financial AccountingComplete Exercises E3.docxkarlhennesey
 
Resource University of Phoenix Material Appendix AIdentify.docx
Resource University of Phoenix Material Appendix AIdentify.docxResource University of Phoenix Material Appendix AIdentify.docx
Resource University of Phoenix Material Appendix AIdentify.docxkarlhennesey
 
Resource The Threat of Bioterrorism VideoWrite a 700 to 850-w.docx
Resource The Threat of Bioterrorism VideoWrite a 700 to 850-w.docxResource The Threat of Bioterrorism VideoWrite a 700 to 850-w.docx
Resource The Threat of Bioterrorism VideoWrite a 700 to 850-w.docxkarlhennesey
 
Resource Ch. 14 of Introduction to Psychology Create an 8 to 12 s.docx
Resource Ch. 14 of Introduction to Psychology Create an 8 to 12 s.docxResource Ch. 14 of Introduction to Psychology Create an 8 to 12 s.docx
Resource Ch. 14 of Introduction to Psychology Create an 8 to 12 s.docxkarlhennesey
 

Plus de karlhennesey (20)

Resources Assigned readings, ERRs, the Internet,and other resources.docx
Resources Assigned readings, ERRs, the Internet,and other resources.docxResources Assigned readings, ERRs, the Internet,and other resources.docx
Resources Assigned readings, ERRs, the Internet,and other resources.docx
 
Resource Review Documenting the Face of America Roy Stryker and.docx
Resource Review Documenting the Face of America Roy Stryker and.docxResource Review Documenting the Face of America Roy Stryker and.docx
Resource Review Documenting the Face of America Roy Stryker and.docx
 
Resource Review Thelma Golden--How Art Gives Shape to Cultural C.docx
Resource Review Thelma Golden--How Art Gives Shape to Cultural C.docxResource Review Thelma Golden--How Art Gives Shape to Cultural C.docx
Resource Review Thelma Golden--How Art Gives Shape to Cultural C.docx
 
Resource Review Representational Cityscape, and Ch. 3 of Oxfo.docx
Resource Review Representational Cityscape, and Ch. 3 of Oxfo.docxResource Review Representational Cityscape, and Ch. 3 of Oxfo.docx
Resource Review Representational Cityscape, and Ch. 3 of Oxfo.docx
 
Resource Part 2 of Terrorism TodayYou work on a national se.docx
Resource Part 2 of Terrorism TodayYou work on a national se.docxResource Part 2 of Terrorism TodayYou work on a national se.docx
Resource Part 2 of Terrorism TodayYou work on a national se.docx
 
Resources Appendix A, The Home Depot, Inc. Annual Report in Fun.docx
Resources Appendix A, The Home Depot, Inc. Annual Report in Fun.docxResources Appendix A, The Home Depot, Inc. Annual Report in Fun.docx
Resources Appendix A, The Home Depot, Inc. Annual Report in Fun.docx
 
Resources Annotated Bibliography document. Research five websites t.docx
Resources Annotated Bibliography document. Research five websites t.docxResources Annotated Bibliography document. Research five websites t.docx
Resources Annotated Bibliography document. Research five websites t.docx
 
Resources American History, Primary Source Investigator;Cente.docx
Resources American History, Primary Source Investigator;Cente.docxResources American History, Primary Source Investigator;Cente.docx
Resources American History, Primary Source Investigator;Cente.docx
 
Resource University of Phoenix Material Data SetDownload the.docx
Resource University of Phoenix Material Data SetDownload the.docxResource University of Phoenix Material Data SetDownload the.docx
Resource University of Phoenix Material Data SetDownload the.docx
 
Resource Ch. 6 & 7 of Financial AccountingComplete Brief Ex.docx
Resource Ch. 6 & 7 of Financial AccountingComplete Brief Ex.docxResource Ch. 6 & 7 of Financial AccountingComplete Brief Ex.docx
Resource Ch. 6 & 7 of Financial AccountingComplete Brief Ex.docx
 
Resource Films on DemandCrime and Punishment”Experiment Res.docx
Resource Films on DemandCrime and Punishment”Experiment Res.docxResource Films on DemandCrime and Punishment”Experiment Res.docx
Resource Films on DemandCrime and Punishment”Experiment Res.docx
 
Resource Managing Environmental Issues Simulation(or research a.docx
Resource Managing Environmental Issues Simulation(or research a.docxResource Managing Environmental Issues Simulation(or research a.docx
Resource Managing Environmental Issues Simulation(or research a.docx
 
Resource Ch. 9 of Introduction to Business Create a 5-to-7 slide .docx
Resource Ch. 9 of Introduction to Business Create a 5-to-7 slide .docxResource Ch. 9 of Introduction to Business Create a 5-to-7 slide .docx
Resource Ch. 9 of Introduction to Business Create a 5-to-7 slide .docx
 
Resource Ch. 9 of Introduction to Business Complete the table in .docx
Resource Ch. 9 of Introduction to Business Complete the table in .docxResource Ch. 9 of Introduction to Business Complete the table in .docx
Resource Ch. 9 of Introduction to Business Complete the table in .docx
 
Resource Ch. 3 of ManagementIdentify a time in your life wh.docx
Resource Ch. 3 of ManagementIdentify a time in your life wh.docxResource Ch. 3 of ManagementIdentify a time in your life wh.docx
Resource Ch. 3 of ManagementIdentify a time in your life wh.docx
 
Resource Significant Health Care Event Paper Grading Criteria.docx
Resource Significant Health Care Event Paper Grading Criteria.docxResource Significant Health Care Event Paper Grading Criteria.docx
Resource Significant Health Care Event Paper Grading Criteria.docx
 
Resource Ch. 3 of Financial AccountingComplete Exercises E3.docx
Resource Ch. 3 of Financial AccountingComplete Exercises E3.docxResource Ch. 3 of Financial AccountingComplete Exercises E3.docx
Resource Ch. 3 of Financial AccountingComplete Exercises E3.docx
 
Resource University of Phoenix Material Appendix AIdentify.docx
Resource University of Phoenix Material Appendix AIdentify.docxResource University of Phoenix Material Appendix AIdentify.docx
Resource University of Phoenix Material Appendix AIdentify.docx
 
Resource The Threat of Bioterrorism VideoWrite a 700 to 850-w.docx
Resource The Threat of Bioterrorism VideoWrite a 700 to 850-w.docxResource The Threat of Bioterrorism VideoWrite a 700 to 850-w.docx
Resource The Threat of Bioterrorism VideoWrite a 700 to 850-w.docx
 
Resource Ch. 14 of Introduction to Psychology Create an 8 to 12 s.docx
Resource Ch. 14 of Introduction to Psychology Create an 8 to 12 s.docxResource Ch. 14 of Introduction to Psychology Create an 8 to 12 s.docx
Resource Ch. 14 of Introduction to Psychology Create an 8 to 12 s.docx
 

Dernier

A Critique of the Proposed National Education Policy Reform
A Critique of the Proposed National Education Policy ReformA Critique of the Proposed National Education Policy Reform
A Critique of the Proposed National Education Policy ReformChameera Dedduwage
 
fourth grading exam for kindergarten in writing
fourth grading exam for kindergarten in writingfourth grading exam for kindergarten in writing
fourth grading exam for kindergarten in writingTeacherCyreneCayanan
 
1029-Danh muc Sach Giao Khoa khoi 6.pdf
1029-Danh muc Sach Giao Khoa khoi  6.pdf1029-Danh muc Sach Giao Khoa khoi  6.pdf
1029-Danh muc Sach Giao Khoa khoi 6.pdfQucHHunhnh
 
Presentation by Andreas Schleicher Tackling the School Absenteeism Crisis 30 ...
Presentation by Andreas Schleicher Tackling the School Absenteeism Crisis 30 ...Presentation by Andreas Schleicher Tackling the School Absenteeism Crisis 30 ...
Presentation by Andreas Schleicher Tackling the School Absenteeism Crisis 30 ...EduSkills OECD
 
SOCIAL AND HISTORICAL CONTEXT - LFTVD.pptx
SOCIAL AND HISTORICAL CONTEXT - LFTVD.pptxSOCIAL AND HISTORICAL CONTEXT - LFTVD.pptx
SOCIAL AND HISTORICAL CONTEXT - LFTVD.pptxiammrhaywood
 
1029 - Danh muc Sach Giao Khoa 10 . pdf
1029 -  Danh muc Sach Giao Khoa 10 . pdf1029 -  Danh muc Sach Giao Khoa 10 . pdf
1029 - Danh muc Sach Giao Khoa 10 . pdfQucHHunhnh
 
Sanyam Choudhary Chemistry practical.pdf
Sanyam Choudhary Chemistry practical.pdfSanyam Choudhary Chemistry practical.pdf
Sanyam Choudhary Chemistry practical.pdfsanyamsingh5019
 
Interactive Powerpoint_How to Master effective communication
Interactive Powerpoint_How to Master effective communicationInteractive Powerpoint_How to Master effective communication
Interactive Powerpoint_How to Master effective communicationnomboosow
 
9548086042 for call girls in Indira Nagar with room service
9548086042  for call girls in Indira Nagar  with room service9548086042  for call girls in Indira Nagar  with room service
9548086042 for call girls in Indira Nagar with room servicediscovermytutordmt
 
Class 11th Physics NEET formula sheet pdf
Class 11th Physics NEET formula sheet pdfClass 11th Physics NEET formula sheet pdf
Class 11th Physics NEET formula sheet pdfAyushMahapatra5
 
Kisan Call Centre - To harness potential of ICT in Agriculture by answer farm...
Kisan Call Centre - To harness potential of ICT in Agriculture by answer farm...Kisan Call Centre - To harness potential of ICT in Agriculture by answer farm...
Kisan Call Centre - To harness potential of ICT in Agriculture by answer farm...Krashi Coaching
 
Paris 2024 Olympic Geographies - an activity
Paris 2024 Olympic Geographies - an activityParis 2024 Olympic Geographies - an activity
Paris 2024 Olympic Geographies - an activityGeoBlogs
 
Russian Escort Service in Delhi 11k Hotel Foreigner Russian Call Girls in Delhi
Russian Escort Service in Delhi 11k Hotel Foreigner Russian Call Girls in DelhiRussian Escort Service in Delhi 11k Hotel Foreigner Russian Call Girls in Delhi
Russian Escort Service in Delhi 11k Hotel Foreigner Russian Call Girls in Delhikauryashika82
 
Student login on Anyboli platform.helpin
Student login on Anyboli platform.helpinStudent login on Anyboli platform.helpin
Student login on Anyboli platform.helpinRaunakKeshri1
 
The basics of sentences session 2pptx copy.pptx
The basics of sentences session 2pptx copy.pptxThe basics of sentences session 2pptx copy.pptx
The basics of sentences session 2pptx copy.pptxheathfieldcps1
 
Accessible design: Minimum effort, maximum impact
Accessible design: Minimum effort, maximum impactAccessible design: Minimum effort, maximum impact
Accessible design: Minimum effort, maximum impactdawncurless
 
Holdier Curriculum Vitae (April 2024).pdf
Holdier Curriculum Vitae (April 2024).pdfHoldier Curriculum Vitae (April 2024).pdf
Holdier Curriculum Vitae (April 2024).pdfagholdier
 
BAG TECHNIQUE Bag technique-a tool making use of public health bag through wh...
BAG TECHNIQUE Bag technique-a tool making use of public health bag through wh...BAG TECHNIQUE Bag technique-a tool making use of public health bag through wh...
BAG TECHNIQUE Bag technique-a tool making use of public health bag through wh...Sapna Thakur
 

Dernier (20)

A Critique of the Proposed National Education Policy Reform
A Critique of the Proposed National Education Policy ReformA Critique of the Proposed National Education Policy Reform
A Critique of the Proposed National Education Policy Reform
 
Advance Mobile Application Development class 07
Advance Mobile Application Development class 07Advance Mobile Application Development class 07
Advance Mobile Application Development class 07
 
fourth grading exam for kindergarten in writing
fourth grading exam for kindergarten in writingfourth grading exam for kindergarten in writing
fourth grading exam for kindergarten in writing
 
1029-Danh muc Sach Giao Khoa khoi 6.pdf
1029-Danh muc Sach Giao Khoa khoi  6.pdf1029-Danh muc Sach Giao Khoa khoi  6.pdf
1029-Danh muc Sach Giao Khoa khoi 6.pdf
 
Presentation by Andreas Schleicher Tackling the School Absenteeism Crisis 30 ...
Presentation by Andreas Schleicher Tackling the School Absenteeism Crisis 30 ...Presentation by Andreas Schleicher Tackling the School Absenteeism Crisis 30 ...
Presentation by Andreas Schleicher Tackling the School Absenteeism Crisis 30 ...
 
Mattingly "AI & Prompt Design: Structured Data, Assistants, & RAG"
Mattingly "AI & Prompt Design: Structured Data, Assistants, & RAG"Mattingly "AI & Prompt Design: Structured Data, Assistants, & RAG"
Mattingly "AI & Prompt Design: Structured Data, Assistants, & RAG"
 
SOCIAL AND HISTORICAL CONTEXT - LFTVD.pptx
SOCIAL AND HISTORICAL CONTEXT - LFTVD.pptxSOCIAL AND HISTORICAL CONTEXT - LFTVD.pptx
SOCIAL AND HISTORICAL CONTEXT - LFTVD.pptx
 
1029 - Danh muc Sach Giao Khoa 10 . pdf
1029 -  Danh muc Sach Giao Khoa 10 . pdf1029 -  Danh muc Sach Giao Khoa 10 . pdf
1029 - Danh muc Sach Giao Khoa 10 . pdf
 
Sanyam Choudhary Chemistry practical.pdf
Sanyam Choudhary Chemistry practical.pdfSanyam Choudhary Chemistry practical.pdf
Sanyam Choudhary Chemistry practical.pdf
 
Interactive Powerpoint_How to Master effective communication
Interactive Powerpoint_How to Master effective communicationInteractive Powerpoint_How to Master effective communication
Interactive Powerpoint_How to Master effective communication
 
9548086042 for call girls in Indira Nagar with room service
9548086042  for call girls in Indira Nagar  with room service9548086042  for call girls in Indira Nagar  with room service
9548086042 for call girls in Indira Nagar with room service
 
Class 11th Physics NEET formula sheet pdf
Class 11th Physics NEET formula sheet pdfClass 11th Physics NEET formula sheet pdf
Class 11th Physics NEET formula sheet pdf
 
Kisan Call Centre - To harness potential of ICT in Agriculture by answer farm...
Kisan Call Centre - To harness potential of ICT in Agriculture by answer farm...Kisan Call Centre - To harness potential of ICT in Agriculture by answer farm...
Kisan Call Centre - To harness potential of ICT in Agriculture by answer farm...
 
Paris 2024 Olympic Geographies - an activity
Paris 2024 Olympic Geographies - an activityParis 2024 Olympic Geographies - an activity
Paris 2024 Olympic Geographies - an activity
 
Russian Escort Service in Delhi 11k Hotel Foreigner Russian Call Girls in Delhi
Russian Escort Service in Delhi 11k Hotel Foreigner Russian Call Girls in DelhiRussian Escort Service in Delhi 11k Hotel Foreigner Russian Call Girls in Delhi
Russian Escort Service in Delhi 11k Hotel Foreigner Russian Call Girls in Delhi
 
Student login on Anyboli platform.helpin
Student login on Anyboli platform.helpinStudent login on Anyboli platform.helpin
Student login on Anyboli platform.helpin
 
The basics of sentences session 2pptx copy.pptx
The basics of sentences session 2pptx copy.pptxThe basics of sentences session 2pptx copy.pptx
The basics of sentences session 2pptx copy.pptx
 
Accessible design: Minimum effort, maximum impact
Accessible design: Minimum effort, maximum impactAccessible design: Minimum effort, maximum impact
Accessible design: Minimum effort, maximum impact
 
Holdier Curriculum Vitae (April 2024).pdf
Holdier Curriculum Vitae (April 2024).pdfHoldier Curriculum Vitae (April 2024).pdf
Holdier Curriculum Vitae (April 2024).pdf
 
BAG TECHNIQUE Bag technique-a tool making use of public health bag through wh...
BAG TECHNIQUE Bag technique-a tool making use of public health bag through wh...BAG TECHNIQUE Bag technique-a tool making use of public health bag through wh...
BAG TECHNIQUE Bag technique-a tool making use of public health bag through wh...
 

OverviewAs a social science student, it is vitally important t.docx

  • 1. Overview As a social science student, it is vitally important that you become an educated consumer of social science research, even if you never get to conduct an actual research study. You need to have a basic understanding of the steps in the scientific process, a familiarity with commonly used social science research designs and methods, and a knowledge of procedures for collecting and analyzing social science data. This module provides very basic information about these topics. It addresses the following subjects: · the scientific method · qualitative and quantitative research · data analysis and presentation · discipline-specific research designs and methods The Scientific Method The scientific method is a form of inquiry that was originally developed to answer questions in the natural sciences. The scientific method uses systematic observation and measurement to confirm or disconfirm hypotheses that most often are derived from underlying theories. When a hypothesis is confirmed, it lends support to the underlying theory. When it is not confirmed, researchers must reformulate the theory and come up with other explanations. Scientists share their findings by presenting at conferences or publishing in peer-reviewed journals. Sharing results with the research world is an important part of the scientific method because science is an iterative activity. As social scientists, we have a great challenge. Because we cannot exert complete control over human behavior, it is not possible to conduct true experiments. Real life cannot be captured in a lab, and human behavior cannot be explained by one or even two causes. This makes it difficult to determine "cause and effect." For example, if we are interested in knowing
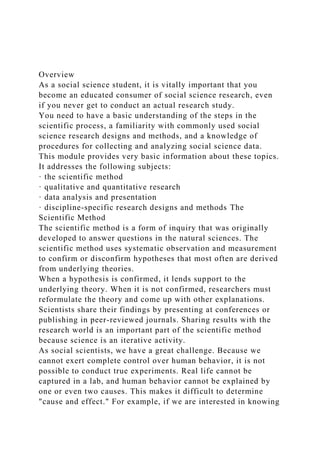
  • 2. why poor people have compromised health outcomes, we would need to account for an impossibly large number of factors or variables such as race, ethnicity, genetic markers, income, education level, access to health care services, and living conditions. Steps for Conducting a Research Study Figure 4.1 Steps for Conducting a Research Study Source: UMUC PSYC 100. The use of the scientific method allows researchers to develop explanations of social science phenomena. The steps of the research process are explained from a psychological perspective in this tutorial (Bradley, 2000). Step 1: Make an Observation The starting place for any research study is an observation (idea) regarding a topic of interest to you, the researcher. It may come from a conversation with a friend, a book or television program, or the conclusion of a related research project. All that is needed at this point is your interest in pursuing the topic further. Let's take an example that we will use for all of the steps in the process. You observe that you are able to memorize items such as telephone numbers better when you eat candy. Because of this, you wonder if there is a connection between the primary component of candy (sugar) and memory. Step 2: Propose a Hypothesis to Explain the Observation Once you have your idea, the next step is to turn it into a statement called a hypothesis. A hypothesis is a testable prediction/belief of what will happen in some circumstance. Developing a good hypothesis requires an examination of the literature on that topic. Your research will help you to learn how other researchers have conceptualized and tested the hypothesis. Example: You research the topic of memory enhancement and see that other researchers have looked at how certain herbs and
  • 3. a healthy diet can improve memory. However, no one* has examined the effect of sugar on memory. On the basis of your review of the literature, you formulate the following hypothesis: "College students who ingest two grams of sugar before a memorization task will perform better than college students who do not ingest sugar." (*Keep in mind that this is just an example and does not accurately reflect the research literature on memory enhancement.) Step 3: Test the Hypothesis In this step, you perform two important tasks: 1. You define all important terms and variables in your study. As the researcher, you need to create an operational definition of all important terms in your study so that others can replicate it. Example: "Sugar" and "memory" are terms that need to be defined. Sugar could be defined as the substance in white sugar cubes, while memory could be described as a score on a specific memorization test. Since you control the amount of sugar ingested by subjects in this experiment, sugar is the independent variable. Scores on the memorization test are the dependent variable. Preexisting factors or characteristics can also be independent variables. For example, if some of the subjects in the study have Type II diabetes and others do not, diabetes could be an additional independent variable. 2. You decide on the best research method to test your hypothesis. After you define the variables, you need to choose the best research method. The best method depends on your hypothesis. Psychologists typically choose from the five methods below. Click on each method for a definition and examples. Which would you choose for this study? Figure 4.2 Social Science Research Methods
  • 4. Source: UMUC PSYC 100. Example: For our sugar study, we decide on the experimental method. We divide a class of college students into two groups. One group is given two grams of sugar cubes (the experimental group); the second group is given two grams of sugarless placebo cubes (the control group). After ingesting their cubes, the two groups have three minutes to memorize a list of nonsense syllables. After a five-minute break, both groups are tested on the number of nonsense syllables that they can recall. The number of correct syllables recalled represents their memory score. Step 4: Analyze Data After you have collected the data, you select the statistical procedures needed to prove or disprove your hypothesis. In the "sugar/memory" experiment, you compare the number of nonsense syllables that are correctly recalled by each group of subjects. The "Data Analysis" section of this module provides an introduction to statistical procedures that you might consider for this analysis. Step 5: State Conclusions About Your Hypothesis Based on Data Analysis The communication of research results is the final, important step in the overall process. Your findings are based on your analysis of the data collected. Researchers typically communicate their results through the publication of journal articles. They may also choose to present a poster or conduct a discussion at a professional meeting or research conference. Your findings may prompt others to conduct additional research that may result in new findings leading to additional research, and on and on.Social Science Research Qualitative and Quantitative ResearchData AnalysisPresenting Data As a social science student, why is it important for you to understand research methods? It is vitally important that you become an educated consumer of social science research, even if you never get to conduct an actual research study.
  • 5. That means that you need to have a basic understanding of how social science data are collected, analyzed, and presented. Like it or not, statistics are an important component of those activities. Let’s start with data collection. Qualitative and Quantitative Research Qualitative and quantitative research are two forms of scientific inquiry characterized by their differences in philosophy, methods, and results. Qualitative Research In qualitative research, the establishment of trust and rapport with study participants is the foundation of the research. The researcher cannot obtain in-depth and accurate information about an individual's or group's experience without establishing rapport with the participants. Establishing rapport enables the researcher to gain access to important sources of data. Qualitative researchers use various means of collecting information or data to help them understand the experience of study participants. One way of gathering data is through participant observation. The researcher may venture into the field and participate in rituals, ceremonies, or other activities of the individuals being studied. Another way of collecting data is by interviewing study participants. Interviews use open-ended questions to allow study participants to provide in-depth information about their experiences and understanding of people and events. Ethnography is a common form of qualitative research. It is an in-depth study of an individual or group of people using observed, self-reported, and secondary data. One example of ethnography would be a study of the life story of a military veteran to better understand the impact of war on the veteran’s life and personal development. Data sources may include interviews, personal journals, and meaningful artifacts. Those sources are analyzed by examining important themes that emerge from those resources. They may also include linguistic, literary, and psychological analysis.
  • 6. Quantitative Research Quantitative research generates reliable, sample-based data that can be generalized to larger populations and used to establish cause-and-effect relationships. Data are expressed and recorded as quantities using a standard system of measurement. Quantities such as number, amount, time, frequency, or a host of others may be measured. Quantitative research encompasses both correlational and experimental designs. Correlational research examines relationships among variables. An example is the relationship between frequency/duration of exercise and diabetic health status (blood-sugar level). As the frequency/duration of exercise increases, the blood-sugar level decreases. This is an example of a negative correlation. A positive correlation is one in which if one variable increases, then the other variable increases as well (similarly, if one variable decreases, the other variable decreases). An example of a positive correlation is the relationship between religiosity and perceived health status. The higher the level of religiosity, the higher the level of self-reported wellness or health. A correlation or relationship between two variables doesn't mean that a change in one variable causes a change in the other. It simply means there is a relationship between two variables. The correlation coefficient is a measure of the strength of the relationship between two variables. It can range from -1 to +1. The closer the coefficient is to +1, the stronger the positive association between variables. The closer the coefficient is to - 1, the stronger the negative association between variables. A correlation coefficient of 0 means that there is no relationship between the variables. Figure 4.3 Graphing Correlational Data: Perfect Positive Correlation Figure 4.4 Graphing Correlational Data: Perfect Negative Correlation
  • 7. Experimental research attempts to prove that a change in one variable causes a change in another variable. An experimental study manipulates an independent variable to examine its effect on an outcome (the dependent variable). Study participants are randomly assigned to an experimental or control group. The experimental group receives the intervention while the control group does not. Then the outcomes are measured and compared. One example of experimental research is the examination of the impact of a new health-promotion program for seniors on specific outcome or dependent variables such as food choice, sleep patterns, or physical activity. The decision of whether to choose a quantitative or a qualitative design is a philosophical question that depends on the nature of the project, the type of information needed, the context of the study, and the availability of resources (time, money, and personnel). This chart spells out some of the distinguishing characteristics of quantitative and qualitative research. Check your understanding of the differences between qualitative and quantitative research by sorting these research questions.Research MethodsRESEARCH QUESTIONS Cultural anthropology: What was the significance of cats for the people of ancient Egypt? Forensic anthropology: What is the sex of a human skeleton? Sociology (Social demography): How has the structure and composition of the American family changed over the past decades? Sociology: What makes a high school student vulnerable to dropping out of school? Women's Studies: What do women earn in terms of average salary, compared to men in similar jobs, in the United States? Sociology: How do Americans feel about same-sex marriage? Gerontology: What is it like to live in a nursing home? Geography: How fast is the world's population growing? Psychology: Is IQ lower in individuals with severe mental illness? Gerontology: What is the impact of ageism on health outcomes?
  • 8. Now, check your understanding of the differences between qualitative and quantitative research by classifying the following research questions as qualitative or quantitative in nature:QUALITATIVEQUANTITATIVEBOTH METHODSFEEDBACK RESET Data Analysis An understanding of certain basic statistical concepts such as variables, hypotheses, scales of measurement, populations, samples, and estimates is essential in the social sciences. This section of the module examines the meaning of these concepts by using an example. Let's say that we want to look at how talkative people are in general. There is a basic assumption inherent in this interest— we assume that people vary in terms of their "talkativeness" (i.e., some talk more than others). Therefore, we consider "talkativeness" to be a variable. If we wanted to compare how talkative people are at work compared to how talkative they are at parties, then location (work vs. parties) would also be a variable. We now have two distinct variables, talkativeness and location. In this case, location is our independent variable because we have some control over it (it may help to use the first letter of independent, i, to represent the phrase "I control"). Talkativeness is our dependent variable; we can measure it, but we cannot control it (here, you may think of the first letter of dependent, d, to represent "don't control"). Going further with our example, we will posit that people are more talkative at parties than at work. This would be our research hypothesis. The opposite of our research hypothesis is that people are either equally talkative at work and parties, or that they talk less at parties. These are called null hypotheses. In order to evaluate our research hypothesis, we need to figure out how to measure our two variables, location and talkativeness. Location is an easily-measured variable. You can
  • 9. only be in one place at a time (work vs. party)! You cannot be working a bit and partying a lot at the same time (presumably)! Therefore, the scale of measurement here is considered nominal. Talkativeness can be measured in many different ways. If we compare the talkativeness of some people to the talkativeness of others, then we have an ordinal scale of measurement. However, if we count the number of actual words spoken, we have a ratioscale of measurement. We typically like to make statements about "people in general," but how can we do this when we are basing our results only on the friends who are at our party? On the other hand, is it feasible to invite all the people in the world to our party? Therefore, we are drawing conclusions based on the behaviors of a sample of the larger population. Nevertheless, by using the appropriate research methods, we can make a guess or estimate about talkativeness based on our sample situations. As we move into the area of analyzing the data that we’ve collected, let’s look at a different example. Suppose we were to ask you, "How many movies have you seen per week in the past year?" Let’s say you can only remember the number of movies that you saw during each of the last 10 weeks. This is a sample since you don’t have numbers for all 52 weeks. Suppose that the numerical values for the past 10 weeks of movies are: Figure 4.5 Sample Frequency Data Week 1 Week 2 Week 3 Week 4 Week 5 Week 6 Week 7 Week 8 Week 9
  • 10. Week 10 2 1 3 1 4 1 3 2 1 1 Source: UMUC STAT 225. Making Sense of Raw Data Raw data such as numbers of movies watched per week per year only make sense when they are organized. There are two standard ways of making sense of distributions of raw data. The first method is aimed at counting the amount (or frequency) of data that is of a particular value or range of values. The numerical representation of all these individual frequencies of a distribution is called a frequency distribution. Translating the above raw data into a frequency distribution, we have: Figure 4.6 Sample Frequency Chart Number of Movies Frequency 1 5 2 2 3 2 4 1 Source: UMUC STAT 225. Central Tendency
  • 11. Central tendency is one of the most basic concepts used to make sense of a data distribution. It is used to answer questions that contain words like usually, typically, and average; questions such as "How many movies do you see during an average week?" All of these words describe what we generally expect to happen. This is the core of the concept of central tendency. Of course, nothing is that simple in statistics. We must have a few ways of describing central tendency in order to make it more complicated! There are three types of central tendency: the mean, median, and mode. Any distribution has all three types. The Mean The mean of a distribution is the mathematical "average." To obtain its specific value, you simply add all the scores and divide by n(the number of scores). The mean number of movies in our sample is 1.5. The Median The median of a distribution is the value representing the middle point of that distribution, with half the scores falling above it and half below. To find the specific value, you simply use the formula, (n + 1)/2. For our movie example, n = 10. Therefore, the median would be the value associated with the (10 + 1)/2 = 5.5. The Mode The mode is simply the most frequently occurring score. Looking at our movie example, we see that in five out of the 10 weeks, you saw only one movie. One movie per week is the most frequently occurring score in this distribution. Therefore, the mode in this example is one. Sometimes two or more scores share the highest degree of frequency. In these cases, you have bimodal or multimodal distributions. While a distribution can have only one mean and median, it can have more than one mode. Comparing the Mean, Median, and Mode The mean and the median both take all the scores of a distribution into consideration when calculating central
  • 12. tendency. Furthermore, the mean takes into consideration each score's specific numerical value. The median uses the knowledge that a distribution has x number of scores to determine central tendency. The mode ignores all information except which score occurs most frequently. In the next section, we cover variability. We will see that different measures of variability are very similar to these three types of central tendency. Let’s say we had different samples of how many movies you watched over the last year. Each sample recorded 10 weeks of movie watching, but no two samples had the identical set of 10 weeks in it. What we would probably see is similar mean values for all samples; in other words, the means would be more alike than either the medians or modes. You can also say that "the mean is the type of central tendency that is least subject to sampling variability." Graphing The second method of making sense of a frequency distribution is graphing. Graphing takes the numerical summary of a distribution and provides a visual representation of it. Various types of graphical figures can be used, depending on the types of data and the way they are organized. Graphs offer the ability to step back and look at the big picture rather than getting stuck in the minutia of numerical values of a distribution. See the "Presenting Data" section for some examples of frequency graphs. Variability If we were to ask people how many movies they tend to see per month, the response might be "two, give or take one." The "two" is an estimate of central tendency and the "give or take one" is a guess about variability. This idea of variability is important because not all values in a distribution are the same. Values can differ a great deal or just a little. Variability gives us a sense of the extent to which scores are alike. It is another important characteristic of a distribution. For example, another classmate says that "on average" she sees
  • 13. the same number of movies per week as you do. She says that the number of movies she has seen in the last 10 weeks, respectively, are: Figure 4.7 Movies Per Week (Individual Data) 4 4 0 1 4 2 0 1 1 1 Source: UMUC STAT 225. Organizing these data creates the following frequency distribution: Figure 4.8 Frequency Distribution (Individual) Number of Movies Frequency 0 4 1 1 2 1 3 0 4 4 Source: UMUC STAT 225 The mean and median values for your classmate’s movie distribution are the same as those for your distribution (in the central tendency activity). However, by looking at them, you
  • 14. can see they differ in their variability. This section looks at standard ways used to measure this variability. The Range The range is a lot like the mode. Remember, the mode represented the most frequently occurring value. The range is similar in that it captures the highest and lowest scores of a distribution, neglecting the information contained in between. The range is useful to get a sense of how broad (or variable) is the score distribution. It is limited by its ability to describe the extremes, but not the internal variability of a distribution. The Standard Deviation and Variance What if we want to get a measure of how scores vary from some central tendency? Since the mean value is the one measure of central tendency that takes into consideration the value of every score, we use standard deviation and variance to perform this calculation. Standard deviation and variance are very similar concepts. The only difference is that variance is in squared units, and the standard deviation is not. Z Scores We learned in the previous sections that the mean and standard deviation are significant characteristics of any distribution. Another significant characteristic is unit of measurement (e.g., meters vs. inches). Would you expect to get the same value for a person’s height in meters as in inches? Of course you wouldn't. But you would agree that they measured the same degree of height but just in different kinds of units. Z scores solve that problem. They are a universal form of measurement. Transforming regular scores into z scores (otherwise known as standard scores) allows a comparison across different units of measurement. How can this be? Look at the example on height we just talked about. Transforming meters and inches into z scores allows an easy comparison of mean values (subtraction) and standard deviation (division). The two new z distributions should be identical (if the original measurements are precise). The Normal Curve
  • 15. The normal or "bell curve" represents a normal distribution of data that always "behaves" in the same manner. A seemingly infinite number of datasets exhibit this pattern. Mathematical formulas (or functions) for a bell curve are identical with the exception of their mean values and standard deviations. If we were to take the means and standard deviations out of any normal distribution, we would be left with z scores. This is called "the z distribution." The standard normal (z) distribution allows us to find percentages, percentiles, and proportions associated with a single score or the area between scores. Figure 4.9 Normal Distribution (Bell) Curve Source: UMUC STAT 225. Inferential Statistics Inferential statistics provides us with the means to make statements about what is likely to be true about populations based upon information about a smaller segment of that population (sample). For example, imagine that we want to see if a new type of medication helps allergy sufferers by decreasing the severity of their symptoms. It would be difficult, and very expensive, to test the drug on all the allergy sufferers in the world. So instead, we try it on a sample and see what happens for this smaller group. Let’s say we find that, for the allergy sufferers in the sample, their symptoms are reduced by 50 percent. What we are really interested in is the whole population of allergy sufferers. So we use the information we got from the sample and guess what might be true for the population. In this case, we would estimate that on average, the symptoms of all allergy sufferers (a population) would be reduced by 50 percent if the medicine were used. We use a sample statistic to provide an estimate of a population parameter. Inferential statistics allows us to evaluate whether our estimate is predictable or just due to chance. To help us
  • 16. decide whether the difference is due to chance, we use probability theory. Probability and Statistical Significance As scientists, when we conduct an experiment or make observations, we are hoping for definitive findings. The term "probability" (or likelihood) refers to how likely it is that an event will occur or that a statement is true. A probability is given as a percentage from 0 (0 percent chance of occurring) to 100 (100 percent chance of occurring). If we get the same result in 100 percent of our experiments, we can be confident that our results are "real" (or true), but what conclusions can we draw if the same result occurs only 50 percent of the time? We may conclude that extraneous variables or conditions are affecting our results. If we get similar results when we "control" for these variables or conditions, we need to face the possibility that our findings are not real; they may be occurring by chance or coincidence. How do we calculate that likelihood? The term statistical significance refers to whether the probability of the difference between two results is real or due to chance alone. Statistical significance is expressed in terms of levels of confidence. We can say that the probability that a result is due to chance is less than 5 percent. We can also say that we are 95 percent confident that a research finding is real, and not due to chance. If we want to be even more conservative, we can say that the probability that the difference is due to chance is less than 1 percent, or that we are 99 percent confident that our result is not due to chance. These probability values are usually reported in research articles as p<.05 and p<.01, respectively. Presenting Data Presenting data clearly is as important to the success of a research study as methods and statistical procedures. As you look at the following table and graphs, ask yourself why the researcher decided to present the data in this way.
  • 17. Click on the individual figure number to check your response. Figure 4.10 Ratio Data Presented in a Table Ratio of Social Security Covered Workers to Beneficiaries Calendar Years 1940-2010 Year Covered Workers (in thousands) Beneficiaries (in thousands) Ratio 1940 35,390 222 159.4 1945 46,390 1,106 41.9 1950 48,280 2,930 16.5 1955 65,200 7,563 8.6 1960 72,530 14,262 5.1 1965 80,680
  • 18. 20,157 4.0 1970 93,090 25,186 3.7 1975 100,200 31,123 3.2 Source: U.S. Social Security Administration. Figure 4.11 Trend-Mapping Graph Source: Nature Reviews Drug Discovery. Figure 4.12 Scatterplot Graph Source: National Institutes of Health, Research Services Branch. Figure 4.13 Bar Graph Source: National Kidney and Urologic Diseases Information Clearinghouse (NKUDIC). Figure 4.14 3-D Bar Graph Source: National Institutes of Health, National Eye Institute. Figure 4.15 Pie Chart Source: National Institutes of Health, National Center for Alternative and Complementary Medicine. Figure 4.16 Standard Line Graph
  • 19. Source: National Institutes of Health. Figure 4.17 3-D Shape Graph Source: Journal of Automated Methods and Management in Chemistry. Used under the terms of the Creative Commons Attribution license. Graphing Tutorial To check your knowledge and skills in presenting data graphically, give this graphing tutorial a try. Discipline-Specific Research Methods AnthropologistsGerontologistsPsychologistsSociologistsSumma ry Natural scientists and some behavioral scientists rely heavily on classic experimentation as the primary tool for scientific research. The power of the experimental method is that scientists tightly control the conditions under which a phenomenon is observed so that they can minimize the likelihood that observations are due to chance or error. In so doing, researchers can determine "causality"—that is, they can conclude that a change in one variable causes a change in another. Classic experimentation is not always possible in the social sciences. Social scientists study complex phenomena such as cultures, social norms, and behavior that are dynamic and are affected by multiple factors; therefore, it is not always possible to conduct true experiments because it is impossible to allow for every influential factor. So, how do social scientists conduct research? Do anthropologists tend to use different methods than psychologists, for example? If so, what are the methods typically used by each discipline? Do social scientists ever "borrow" methods used by other disciplines to answer their research questions?
  • 20. To introduce this topic, let’s look at the ways that different social science disciplines might investigate the life stage known as "retirement." Try to predict research questions that might be posed by different disciplines and the methods that they might use to answer them before you click on the lenses on the left side of the graphic. Figure 4.18 Retirement, Through a Social Sciences Lens Anthropologists Anthropologists have a varied toolkit available to them to answer their research questions. They are well-known for their qualitative research approach, although they also use quantitative methods. Human beings are complex biological and cultural organisms, so anthropologists will integrate quantitative and qualitative approaches in their work. Here’s an example to illustrate this: People must drink and eat to survive. How would an anthropologist study this behavior? An anthropologist may use a quantitative research approach to examine how food is apportioned differently between men and women in diverse settings. The anthropologist may ask the research question—are men allotted more high-protein food than women in certain cultures, and if so, what are the health outcomes of this difference? An anthropologist also may seek to understand and represent the ways men and women feel about these differences in food apportionment; this is a qualitative research question. The two research methods that are thought to distinguish anthropology from other social science disciplines are ethnography and participant observation. Ethnography is a research method that employs personal observations of a living culture. In their fieldwork,
  • 21. anthropologists ask open-ended questions that allow people to respond as they wish. Anthropologists call the people they study informants or consultants to emphasize the expertise of the people and the fact that the people are the experts rather the "subjects" of experiments or "respondents" to a survey with forced-choice questions. To construct an ethnography, anthropologists ask informants to detail their life histories, draw pictures and maps, tell stories, demonstrate how they make their art and artifacts, or cook their food. In other words, they ask informants to show and tell what it means to live their particular lives. They use statistical procedures or qualitative analyses to make sense of their data. Anthropologists are interested in uncovering both emic and etic points of view―that is, they try to identify the point of view of the people being studied ("emic") as well as other "outside" perspectives ("etic"). For example, surveys often ask demographic questions that divide people into groups according to age, education, income, marital status, religion, and ethnic group or race. These are standard "etic" categories, typically agreed upon by Western researchers as important markers of difference. On the other hand, people may or may not identify themselves according to these categories, and they may also have other "emic" categories for grouping people, such as clan, political group, or musical style. Indeed, they may not think in terms of differences among people at all. To better understand the "emic" and "etic" perspectives for the people they are studying, cultural anthropologists use participant observation. In this way, they experience a culture from the "inside" and the "outside." Participant observation is a fieldwork method in which a researcher lives in and participates in a culture. At the same time, he or she observes everyday life and learns how the society actually works. Gerontologists Gerontologists are interdisciplinary by training, so they rely on a variety of research methods to answer important scientific questions about aging. They may use surveys to gather
  • 22. information about attitudes and feelings. They may use unstructured interviews and observations to better understand the experience of aging from the perspective of an older adult. Gerontologists interested in health outcomes may collect physical and behavioral measurements. Because gerontologists are interested in the process of aging, they rely heavily on research designs that follow participants through time. Two such examples are: · longitudinal studies (also known as "panel studies") that collect data repeatedly from the same participants over an extended period of time. · cohort sequential design, a longitudinal design that follows multiple cohorts across time and allows researchers to differentiate among age, period, and cohort effects (described below). The primary disadvantage of this type of research is that it is expensive, labor-intensive, and takes a long time to complete. The challenge for gerontologists is to determine whether changes are due to cohort effects, period effects, or age effects. Cohort effects = Differences between age groups due to the time period in which people are born and raised. For example, the experience of an African American person born in 1930 (prior to the Civil Rights movement) is very different from that of an African American person born in 1980. Period effects = Differences between age groups attributable to an historic event or time period. As an example, if we notice that US alcohol consumption in people 50 and older increases dramatically between 1930 and 1940, we might draw the conclusion that as people get older, they drink more; however, if we remember that Prohibition ended in 1933, we might draw a very different conclusion. That is, the reason people seemed to drink more as they got older is that the ban on alcohol ended during the time period of interest. Age effects = Physiological, psychosocial, and behavioral
  • 23. changes that are attributable to getting older. For example, nearly all of us will have some degree of atherosclerosis (hardening of the arteries) as we get older, but what are the psychosocial and behavioral changes that are attributable to the aging process? One example of a true aging effect is that of criminal behavior. Across many generations and time periods, it has been shown that criminality is higher among teens and young adults. As people age, they are less likely to commit crimes (Hirschi & Gottfredson, 1983). When gerontologists are not interested in "process"(change over time), they may choose a cross-sectional study design. Cross- sectional studies gather data across groups at a single point in time. They tell researchers little about whether differences in age groups can be attributed to age, period, or cohort effects. For example, a gerontologist may compare the eating habits of two groups of 75-year-old men—one group that lives at home, and another in an assisted living environment. Gerontologists often use their research to advocate for changes in policy and legislation that directly impact older Americans. They are at the forefront when it comes to decisions on Social Security, retirement, Medicare, transportation, and other issues.Psychologists Modern psychology is defined as the scientific study of behavior and mental processes and how they are affected by an organism's physical state, mental state, and external environment (Tavris & Wade, 1995). Let's break down the definition. Behavior refers to any action that can be observed and measured. For example, smiling at a friend, crying at a movie, or blinking your eyes in response to a bright light are examples of behaviors. Mental processes refer to internal aspects of our lives, including thinking, feeling, and perceiving. Thus, calculating 7 + 9, recalling your 16th birthday, and experiencing happiness are mental processes. Our behavior and mental experiences can influence or be influenced by genetics, physical health, level of intelligence, economic situation, culture, ethnicity, and other aspects of our
  • 24. environment. An important element of psychological research is empiricism, the reliance on information from direct observation and measurement. Experimental psychologists test their hypotheses on laboratory animals in controlled environments, while clinical psychologists conduct their research on human subjects in their natural surroundings. Psychologists rely heavily on the following research designs: · Correlational research that examines the relationship between variables. Correlational research does not yield cause-and-effect conclusions. · Descriptive research that describes the characteristics of a population or phenomenon of interest. Through the use of descriptive statistics such as averages, frequencies, and ranges, researchers can make observations about the prevalence of certain variables and can make comparisons among groups. Because psychologists are interested in the measurement of behaviors, attitudes, and beliefs, they are skilled in the development and use of instruments that capture those constructs. Sophisticated statistical tools allow them to analyze and interpret correlational and descriptive research data. Sociologists Sociologists seek to uncover the social factors that affect behavior. The goal of sociologists is to obtain data that test assumptions about the social world. The sociological perspective requires us to look beyond our common sense (which can be faulty), our experience (which can be limited), and our values (which are bound in time and culture) to gain new understandings of the social world. Sociologists may use quantitative, qualitative, or mixed methods in their research. The methods used for a sociological study depend upon the research questions being asked. Quantitative research in sociology employs methods such as surveys (developed to answer specific research questions) and secondary data analysis (research using existing data sets
  • 25. gathered for general purposes). A quantitative design attempts to amass information from large numbers of people. It often requires respondents to answer prepared (close-ended) questions. Close-ended questions are limiting in that they do not allow respondents to describe how they see or experience their world. Qualitative research employs some of the methods already discussed for other social sciences. Qualitative methods include interviews (asking people open-ended questions), content analysis (research to study content to uncover the explicit and implicit or hidden meanings), and participant observation (observation of, and involvement in, the social interaction patterns of groups). In qualitative studies, sociologists may ask subjects why they act in certain ways or what rules and assumptions govern their behavior. Questions in qualitative research instruments are more open-ended. The following are limitations of qualitative methods: · greater potential for bias (because researchers themselves can be influenced by their subjects) · difficulty in generalizing findings to larger groups, given the small sample size in studies Summary What sets the social science disciplines apart from each other? Anthropologists, gerontologists, psychologists, and sociologists all select their research designs and methods based on clearly articulated research hypotheses and questions. Their designs and methods can be either qualitative, quantitative, or mixed. What truly sets the disciplines apart are the principles and theories that guide their research and interpretation of data. For more information on those principles and theories, check out the Social Science Perspectives module.References Agarwal, P. & Searls, D. B. (2009, November). Can literature analysis identify innovation drivers in drug discovery? Nature Reviews Drug Discovery, 8, 865–878. doi:10.1038/nrd297. Bianchin, J. N., Martendal, E., & Carasek, E. (2011, June 28).
  • 26. Determination of trace silver in water samples by online column preconcentration flame atomic absorption spectrometry using termite digestion product. Journal of Automated Methods and Management in Chemistry. Retrieved from http://openi.nlm.nih.gov/imgs/rescaled512/3142775_JAMMC20 11-839365.008.png. Bradley, M. E. (2000). The cyberlab for psychological research. Retrieved July 22, 2013, from http://faculty.frostburg.edu/mbradley/cyberlab.html Hirschi, T., & Gottfredson, M. (1983). Age and the explanation of crime. American Journal of Sociology, 89(3), 552–584. Nahin, R. L., Barnes, P. M., Stussman, B. J., and Bloom, B. (2009). Costs of complementary and alternative medicine (CAM) and frequency of visits to CAM practitioners: United States, 2007. National Health Statistics Reports No. 18. Hyattsville, MD: National Center for Health Statistics. Retrieved July 24, 2013, from http://nccam.nih.gov/about/plans/2011/introduction.htm. National Institutes of Health, National Eye Institute. (n.d.). Congressional justification for FY 2007. Retrieved July 24, 2013, from http://www.nei.nih.gov/news/congressjust/cj2007.asp. National Institutes of Health, Research Services Branch. (n.d.). Image processing and analysis in Java (plug-ins, Fraclac). Retrieved July 24, 2013, from http://rsbweb.nih.gov/ij/plugins/fraclac/FLHelp/Subs.htm National Kidney and Urologic Diseases Information Clearinghouse (NKUDIC). (2012, June). Kidney disease statistics for the United States (ESRD incident rate). Retrieved July 24, 2013, from http://kidney.niddk.nih.gov/kudiseases/pubs/kustats/images/Adj std_Incident_Rates_ESRD.jpg