SlideShare une entreprise Scribd logo
1  sur  8
Télécharger pour lire hors ligne
Labour productivity
By Craig Lindsay, Labour Market Division, Office for National Statistics
Office for National Statistics • Labour Market Trends •November 2004
Introduction
T
his article looks at
productivity from a labour
market perspective. The aim
is to look at the importance of
productivity, the different ways of
measuring it, and most importantly
the different drivers of productivity
within the labour market.
Productivity is a measure of the
ability to create goods and services
from a given amount of labour,
capital, materials, land, knowledge,
time, or any combination of these. It
is measured, basically, as output per
unit of input, where the input could
be land, labour, capital, etc. As the
Pre-Budget Report of 1998 put it “it is
a fundamental yardstick of economic
performance”.1
A high national
productivity level typically indicates
efficient production of goods and
services and a competitive economy.
When productivity is growing, living
standards tend to rise.2
However, this
is not always the case. Productivity
growth can also occur during periods
of recession and increased
unemployment as businesses cut jobs
and seek to become more efficient.
To put the UK productivity
experience outlined in this article in
context, UK productivity growth
over the past 30 years has averaged
around 2 per cent per annum,3
which approximates to a doubling of
income per hour over 35 years.
Research has been done which
suggests that this recent productivity
growth is faster than in the 80 years
from 1870 to 1950, when output per
hour grew by 1.25 per cent per
annum, but it has been slower than
in 1950-73 when it was nearer 3 per
cent. However, this latter period may
have been affected by post-war
catch-up.4
Following the economic
damage inflicted by the Second
World War, there was scope for
greater productivity growth as
infrastructure was replaced.
Allowing for this, long-term trend
UK productivity growth does appear
to be around 2 per cent per annum.
Measurement
As already noted, output can be seen
as the product of a number of
factors, such as labour, land, and
▼
447Special featureLabour productivity
■ There are different ways of
measuring labour productivity –
for example, per worker or per
hour. These different measures
can produce different estimates
of productivity growth.
■ Long-term UK productivity
growth is around 2 per cent per
annum.
■ UK labour productivity growth
lags that of our international
competitors, especially France
and the USA.
■ The main drivers of productivity
are skills, innovation, investment,
competition and enterprise. The
first three, especially skills, have
a particular bearing on labour
productivity.
■ In the UK a lower proportion of
people have higher skills than in
the USA, and fewer have
intermediate skills than in
Germany or France.
■ Around 6 per cent of employees
have skills which do not meet
their employers’ needs.
■ UK firms under UK ownership
have significantly lower
productivity than UK firms under
foreign ownership.
Key points
Special feature
Feature 1 November 2004 27/10/04 2:11 pm Page 447
capital. Productivity can be measured
relative to these different inputs. For
example, output per acre of land, per
pound invested, or per worker
employed. However, it is important
to note that these measures will be
affected by changes to the other
inputs. For example, output per
worker will rise through capital
investment in better equipment.
Alongside the more obvious inputs
such as labour or capital, there is
also the concept of ‘total factor
productivity’ (TFP). This captures
the contribution to output of other
more intangible factors: innovation,
managerial skill, organisation,
competition, and chance. TFP is
particularly important to
productivity growth, because while
certain factors of production like
land will always have a limited
supply, the potential for increasing
TFP is limitless. In principle, TFP is
a more appealing measure of an
economy’s efficiency as it attempts to
measure output per unit of all
inputs, and hence captures how
effectively inputs are used together.
However, in practice, it is difficult to
calculate, and is often measured
almost as a residual – as productivity
net of the contribution of capital
(both physical and human). Thus, it
is largely a catch-all for a variety of
influences on growth; it is, as
Abramovitz put it, ‘a measure of our
ignorance’.5
This article focuses on the labour
market contribution to output, and
hence on labour productivity.
Conceptually, there are a number of
ways of measuring labour
productivity. At a basic level, one can
measure output per worker.
Alternatively, productivity can be
measured per hour worked. Both
provide an indication of
productivity growth, but the per
hour measure does have advantages.
Office for National Statistics • Labour Market Trends •November 2004
The per worker measure has the
downside that it can be affected by
changes in employment
composition. For example, if there is
a move to increased part-time
working, one could have a scenario
whereby employment increased, but
total hours worked in the economy
remained unchanged. A per worker
measure of productivity would
suggest that output per worker had
fallen; by comparison, the per hour
measure would – accurately – say
that productivity was unchanged.
As of July 2004 the main whole
economy productivity measure
published by ONS is based on
output per worker, and is measured
as the ratio of an index of gross
value added (GVA)6
at basic prices
over an index of employment from
the Labour Force Survey (LFS).
Industry breakdowns are calculated
on a per job basis, with the industry
figures taken from the ONS
workforce jobs series benchmarked
to the LFS whole economy figure.
ONS also publishes an output per
hour measure which is based on the
ratio of GVA and LFS hours worked.
LFS hours worked measure the total
actual hours worked in a week,
including overtime and unpaid hours.
The full reasons underlying the
methodology are set out in Barnes and
Williams’s UK Official Productivity
Estimates: Review of Methodology.7
ONS’s preferred measure of
employment is the LFS, and its use in
calculating productivity is in line with
international best practice. A number
of other organisations produce
productivity measures based on the
LFS. For example, the Bank of
England produces productivity growth
measures based on GDP at market
prices/LFS employment and GDP at
market prices/LFS average weekly
▼
Special feature Labour productivity448
Annual productivity growth; United Kingdom; second quarter 1993
to fourth quarter 2003
Figure 1
Per cent
Sources: National Accounts; Labour Force Survey; Bank of England
0
1
2
3
4
5
2003Q4
2003Q2
2002Q4
2002Q2
2001Q4
2001Q2
2000Q4
2000Q2
1999Q4
1999Q2
1998Q4
1998Q2
1997Q4
1997Q2
1996Q4
1996Q2
1995Q4
1995Q2
1994Q4
1994Q2
1993Q4
1993Q2
ONS
Output per hour
Output per worker
Output per employee
Bank of England
Output per hour
Feature 1 November 2004 27/10/04 2:11 pm Page 448
hours. Similarly, HM Treasury also has
a measure based on GVA/LFS hours.
Figure 1 shows productivity
growth over the period 1993-2003 as
measured by both of the ONS
measures and both of the Bank of
England measures. As noted, the
Bank and ONS use different
measures of output – the Bank uses
GDP, while ONS uses GVA. The
latter is arguably the better measure
as it excludes the effects of subsidies
and taxes. However, the difference
between the two is minor. As a
result, while there is a degree of
variability between the different
measures, as the chart shows, overall
they tell a reasonably similar story.
Annual productivity growth started
the period at 3-4 per cent
(depending on the measure) before
declining sharply to 1-2 per cent by
1995 where broadly it stayed until
Office for National Statistics • Labour Market Trends •November 2004
1998. There was a slight pick-up (to
2.5-3.0 per cent) in 1999, and then
growth fell back again before
climbing sharply in 2000, reaching
3-4 per cent again. This was then
followed by a sharp fall in 2001, with
most measures seeing growth
approaching just 0.5-1.0 per cent,
and growth has now returned to
around 2-3 per cent per annum.
The main difference is between the
per person measures and the per hour
measures. The per hour measures both
peak at a slightly lower rate of growth
in 1994 (3.5 per cent compared with
the 4.0 per cent growth seen in the per
person series) and they both show
noticeably stronger growth in 2000. In
2000, the per hour measures show
growth of around 4.0 per cent,
compared with around 3.0 per cent on
the per person measures. This reflects
the fact that while the year to 2000 saw
ongoing strong growth in employment
levels, there was slower growth in
actual hours worked. Indeed, in the
year to first quarter 2002, the LFS age
16 and over employment level
increased by 1.2 per cent, but total
actual weekly hours worked actually
fell by 0.4 per cent.
In addition to these fairly standard
measures, there are a number of
more sophisticated possible ways of
estimating productivity. One might
want to allow for the fact that the
quality of labour varies, for example
by constructing a skills-weighted
index. While this is outside the scope
of this article, ONS has been
pursuing research in this area
(Lau, 2002).
The measurement of productivity
is important as it gives an indication
of economic health, and the choice
of measure can have implications.
Figure 1 suggests that the different
measures show a similar story for the
UK, and this is also the case for
international comparisons of
productivity. For example, it is well
documented that there appears to be
a productivity gap between the UK
and its international competitors,
with the UK lagging behind. The
extent of the gap varies according to
the measure used, but not
significantly. On an output per
worker basis, the G7 average in 2002
was around 13 per cent higher than
the UK figure; on an output per
hour basis the gap was around 12
per cent.8
Moreover, this gap is
spread across a wide number of
industries: a 2003 Sector Skills
Development Agency report showed
that out of 30 industries UK
productivity was below that in the
USA in 26 industries, below France
in 25, and below Germany in 21. As
Figure 2 shows, the UK continued
to lag behind the G7 average in 2003,
and specifically behind France and
449
▼
Special featureLabour productivity
International comparisons of productivity; G7 nations;a
2003
Figure 2
Index (UK=100)
GDP per worker
Source: Office for National Statistics
a The ‘group of seven’ countries: Canada, France, Germany, Italy, Japan, UK and USA.
0
20
40
60
80
100
120
140
USAG7 excluding UKFranceUKGermanyJapan
Feature 1 November 2004 27/10/04 2:11 pm Page 449
the USA. However, on the per
worker (but not the per hour) basis
the UK’s productivity is similar to
Germany’s.
Drivers of labour
productivity
As already highlighted, UK
productivity levels lag behind that of
our international rivals. In part the
relatively lower productivity growth
witnessed in the UK in the post-war
period compared with countries
such as France or Germany is not
surprising. It can be explained partly
because of the relatively smaller
scope for catch-up but also because
of the industrial structure of the
economy. France and Germany
made large productivity gains by
switching resources out of
agriculture: by comparison, the UK
had already made that switch in the
nineteenth century. However, this
can not be the whole explanation.
UK productivity performance was
nonetheless poor, such that the
country was quickly caught up, and
overtaken, with levels of productivity
and real GDP per head lower than
those of our European counterparts
by the end of the 1970s. Of course,
within this, there are variations
across industry. For example,
O’Mahoney and de Boer (2002) have
found that UK labour productivity
particularly lags the USA, France
and Germany in manufacturing and
there are also lags in distributive
trades, and finance and business
services. By comparison, Britain
leads the way in mining and
extraction productivity.9
In analysing the UK’s poor
productivity performance, various
economists have laid part of the
blame at the door of economic
policy. For example, Crafts argues
that for much of the period 1950-79,
the thrust of policy did not focus on
Office for National Statistics • Labour Market Trends •November 2004
supply-side issues such as skills or
flexibility. Rather, the focus was on
subsidising physical capital, on
nationalisation, on promoting
‘national champions’ and on
financing prestige projects, most
notably in aerospace (for example,
Concorde) and nuclear power. Such
policies were pursued throughout
Europe, but the damage done in
Britain was “relatively high”.10
Over
the past two decades there has been
a switch in policy to a focus on
improving competitiveness through
reform of industrial policy,
industrial relations, tax policy, and
expansion of education. The result
has been that relative decline
compared with France and Germany
has ceased. However, the previous
decline has not been reversed.
In examining this ongoing
productivity problem and searching
for ways to close the productivity gap,
the government has identified five
main drivers of productivity:
investment, innovation, skills,
competition and enterprise. These are
to be the target of government policy.
Within this, labour productivity
can be increased in several ways.
Most obviously by improving the
quality of the labour used, for
example by increasing the skill level
of the workforce. Increased and
better use of capital – through
investment in machinery – will have
an impact, as will improving
efficiency in how these factors of
production are used together. It is
important to appreciate that the
different drivers do not operate in
isolation; for example, innovation
and skills will be affected by
investment.
Quality of labour
Labour productivity can be
increased by increasing the skills of
the workforce. Better skills make
workers more efficient. Indeed,
research has suggested that human
capital is one of the major drivers
behind explaining differences in
productivity. For instance,
O’Mahoney and De Boer (2002)
suggest that nearly a fifth of the
productivity gap between Germany
and the UK is due to differences in
skills. Crafts and O’Mahoney (2001)
also suggest that one reason why UK
productivity has been lower than
other countries is a lack of skills.
That is not to say that the UK
necessarily underinvests in
education; indeed since 1950, the
average years of schooling in the UK
have been relatively high.11
However,
despite this, in the late 1970s the UK
had a lower proportion of people
with higher skills than the USA, and
fewer with intermediate skills than
Germany and France. This pattern
continued into the 1980s, and it is
only in recent years that the
proportion of people in the UK with
low or no skills has dipped below 50
per cent (see Figure 3).12
The lack of intermediate level
vocational skills was one of two
major deficiencies identified by HM
Treasury’s Pre-Budget Report 1998,
the other being the lack of basic
literacy and numeracy skills among
many people: 22 per cent of adults in
the UK have very poor literacy skills,
compared with 14 per cent in
Germany.
The other problem is that there is a
mismatch between the skills people
have and the skills business needs.
The UK economy is in a process of
change; for example, there has been a
long-term trend for decline in
proportion of national output
produced by the production
industries, while the service sector has
grown. However, even this is a
simplification; within production
there has been structural upheaval as
▼
Special feature Labour productivity450
Feature 1 November 2004 27/10/04 2:11 pm Page 450
Office for National Statistics • Labour Market Trends •November 2004
traditional industries decline and
more modern industries, such as
biotech, grow. Continuous changes in
economic structure require the
labour market and the skills base to
adapt. To the extent that this does not
happen skill shortages and gaps will
emerge, and productivity will suffer.
The skills issue shows up in a
number of areas in the UK. Some 23
per cent of establishments in England
report skills gaps, where people are
‘less than fully proficient in their job’.
This affects 6 per cent of employees
or around 1 million workers whose
skills do not meet their employers’
needs. In addition, 8 per cent of
establishments in England have skills
shortages vacancies; around 110,000
vacancies are hard to fill because of a
lack of skills.13
Looking ahead, the
Sector Skills Development Agency
notes that demand for skills is likely
to intensify.
Innovation and enterprise
Productivity can also be increased by
improving the efficiency with which
the different inputs to production
are used, for example through better
organisation of labour, or better
technology. To take a classic case,
Adam Smith set out the example of
specialisation in a pin factory. In his
visit he observed that the traditional
craftsman might manufacture one
pin a day. The pin factory, however,
using ten men created 48,000 pins a
day. This leap of productivity Smith
attributed to organisation and
technology: the division of labour in
which one man draws out the wire,
another straightens it, a third cuts it,
a fourth points it, a fifth grinds the
head, and so on through about 18
different operations; and, to the
ability to utilise time saving
machinery by which one labourer
can do the work of many.
The importance of innovation in
451
▼
Special featureLabour productivity
Proportions of all employees by level of skills; selected countries;
1978-79, 1993 and 1998
Figure 3
Per cent Low or no skills
Source: Crafts and O’Mahoney (2001)
0
10
20
30
40
50
60
70
80
FranceGermanyUSAUK
1978-79 1993 1998
Per cent Intermediate skills
0
10
20
30
40
50
60
70
80
FranceGermanyUSAUK
1978-79 1993 1998
Per cent Higher skills
0
10
20
30
40
50
60
70
80
FranceGermanyUSAUK
1978-79 1993 1998
Feature 1 November 2004 27/10/04 2:11 pm Page 451
driving forward productivity
highlights the importance of the
process of ‘creative destruction’. As
some firms innovate, other
technologies become obsolete and
firms exit. Indeed, it has been
estimated that in British
manufacturing since 1980 about half
of all TFP growth has come from
reallocation of production from
losers to winners in this creative
destruction process.14
This underlines
the need for competitive markets that
will drive companies to innovate in
order to stay competitive.
The UK has a good historical
record in innovation; however, in
recent years the aggregate amount of
spending on research and
development in the UK has lagged
behind that of our international
competitors. In addition,
government research15
has suggested
that there is a comparative lack of
entrepreneurial spirit; for example,
while large USA firms invest heavily
in small firms in cutting edge
industries such as computing or
biotechnology, there is little similar
investment in the UK. This,
combined with the fact that the
venture capital market prefers
investing in management buyouts,
means that it can be difficult for new
start-ups to get funding.
Moreover, linking back to the skills
issue, there is a question mark over
the quality of UK managers.
Management is critical to innovation
and enterprise. However, many
managers lack formal qualifications
and undertake limited training. The
result is that UK managers are often
seen as less efficient than their
foreign counterparts. Indeed, poor
management and leadership are
often cited as the main reason
behind the closure of small
businesses in the UK (over a third
close within the first year), and it has
Office for National Statistics • Labour Market Trends •November 2004
been suggested that relatively poor
management skills are one of the
significant factors behind the lower
productivity levels in the UK.16
Indeed, research by Oulton (1998)
has found that there are sizeable
differences in productivity between
UK firms under UK ownership and
UK firms under foreign ownership.
USA ownership raises productivity
in manufacturing by 26 per cent,
whereas other foreign ownership
raises it by 14 per cent. In non-
manufacturing, the figures are 34
and 31 per cent respectively. On the
face of it this would support the idea
that foreign ownership, and
presumably management, brings
increased productivity, suggesting
that UK managers are indeed less
efficient. However, the picture is not
entirely clear: Oulton also finds that
this productivity gap can be largely
accounted for by higher capital
investment and more skilled labour
within the foreign-owned firms;
though that in itself does raise the
question as to why foreign-owned
firms within the UK invest more
capital per worker and employ better
labour than UK-owned firms.17
In addition, work by Criscuolo and
Martin18
has suggested that part of
the apparent difference is due to
multinational enterprises (MNEs).
They find that MNEs, whether
British or foreign, tend to be more
productive than non-MNEs. This is
significant because foreign-owned
plants in the UK are, by definition,
part of MNEs, whereas only a small
fraction of domestically owned
plant will also be part of UK MNEs.
Therefore, if MNEs are more
productive, there will be a tendency
for foreign-owned plant to appear
more productive, which has nothing
to do with British management. On
the other hand, Criscuolo and
Martin also find that USA-owned
firms are more productive, regardless
of the MNE issue, suggesting that
there is indeed a management factor.
Investment
As already noted, investment will
have implications for labour
productivity through its impact on
▼
Special feature Labour productivity452
Gross expenditure on research and development as a proportion of
GDP; selected countries; 1988 to 2000
Figure 4
Per cent
0
1
2
3
2000199919981997199619951994199319921991199019891988
USA
France
Germany
UK
Source: Office of Science and Technology
Feature 1 November 2004 27/10/04 2:11 pm Page 452
skills and innovation. New
investment underpins the
introduction of new techniques.
Again, this is an area the government
believes could explain the shortfall in
UK productivity levels. The UK has
generally invested less than its major
competitors (see Figure 4).
More specifically, O’Mahoney and
de Boer (2002) have found that,
looking at capital per hour worked,
the UK is substantially behind its
rivals. For example, in 1999 the USA
invested 25 per cent more capital per
hour worked, France 60 per cent,
and Germany 32 per cent. Linking
back to the discussion of industrial
productivity, one of only two
industries where the UK had higher
investment was mining (the other
was personal services). By
comparison, in manufacturing,
distributive trades, and financial and
business services (as well as a
number of other areas) there were
sizeable shortfalls.
Of course, what matters more is
how well investment is used.
Investment needs to be well targeted
(one of the problems with prestige
projects). One area of investment
that has been strongly associated in
the economic research with
Office for National Statistics • Labour Market Trends •November 2004
productivity growth is information
and communication technology
(ICT). It has been suggested that
productivity growth results from two
impacts of ICT investment: capital
deepening, as per capita investment
increases, and ‘new economy’ effects
representing more fundamental
change and the adoption of new
techniques facilitated by technology.
The significance of the latter is still
being debated, but there appears to
be a clear impact from capital
deepening. For example, according
to London Economics, over the
period 1992-2001 ICT investment
made an average contribution to
labour productivity growth of 0.76
percentage points, and accounted for
47 per cent of the total annual
average increase in labour
productivity.19
This is a significant
impact. However, looking
internationally, it can be seen that
there is continuing scope for
improvement. Although there were a
number of areas (notably
manufacturing, construction, and
transport and communications)
where the UK ICT capital was higher
than in France, total French
investment in ICT capital per hour
worked was 15 per cent higher than
the UK in 1999. And USA ICT
capital intensity is considerably
greater: in total, ICT capital per hour
worked was 162 per cent higher in
the USA than in the UK in 1999, and
it was higher in every sector.20
In general, the current picture is of
UK productivity levels improving but
lagging behind that of our main
competitors, although for differing
reasons. In the case of the USA, there
is a gap in terms of higher level skills,
but the main driver appears to be the
USA’s investment in ICT coupled
with a greater tendency to innovate
and to produce better management.
By comparison, the difference
between the UK and France and
Germany is explained primarily by
the last two’s greater investment in
physical and human capital.
453
▼
Special featureLabour productivity
For further information, contact:
Craig Lindsay,
Room B3/02,
Office for National Statistics,
1 Drummond Gate,
London SW1V 2QQ,
E-mail: craig.lindsay@ons.gov.uk,
Tel. 020 7533 5896.
Further information
HM Treasury, Pre-Budget Report 1998, November 1998.
HM Treasury, Trend Growth: Recent Developments and Prospects, April 2002’,
http://www.hm-treasury.gov.uk/budget/bud_bud02/associated_documents/bud_bud02_adtrend.cfm
HM Treasury, Productivity in the UK: The Evidence and the Government’s Approach, November 2000,
http://www.hm-treasury.gov.uk/Documents/Enterprise_and_Productivity/the_evidence/ent_prodevi_index.cfm
HM Treasury, Productivity in the UK 5: Benchmarking UK Productivity Performance, March 2004, http://www.hm-treasury.
gov.uk/consultations_and_legislation/productivity_indicators/consult_productivity_indicators_index.cfm
Broadberry S. and Ghosal S., Technology, Organisation and Productivity Performance in Services: Lessons from Britain and
the United States 1870-1990, Depart of Economics, University of Warwick, October 2002.
Crafts N., Britain’s Relative Economic Performance, 1870 to 1999, Institute of Economic Affairs, April 2002.
Crafts N., Supply-Side Policy and British Relative Economic Decline, London School of Economics.
Crafts N. and O’Mahoney M., A Perspective on UK Productivity Performance, Fiscal Studies, vol 22, no 3., Institute for Fiscal
Studies (2001).
Disney R., Haskel J. and Heden Y., ‘Restructuring and Productivity Growth in UK Manufacturing’, Economic Journal,
July 2003.
References
Feature 1 November 2004 27/10/04 2:11 pm Page 453
Office for National Statistics • Labour Market Trends •November 2004
▼
Special feature Labour productivity454
Haskel J., ‘What raises productivity? The microeconomics of UK productivity growth’ (2000),
http://alpha.qmul.ac.uk/~ugte193/papers/raiseprod1.pdf
Haskel J. and Pereira S., ‘Skills and productivity in the UK using matched establishment and worker data’, ONS (2002),
http://www.statistics.gov.uk/articles/nojournal/Paper_6_skills_productivity.pdf
Lau E., ‘Skills and Productivity: Developing New Measures’, ONS (2002),
http://www.statistics.gov.uk/events/new_economy_measurement/downloads/NEMW(03)_EL_Skills_and_Productivity.pdf
Nasar S., ‘Productivity’, The Concise Encyclopaedia of Economics, The Library of Economics and Liberty,
http://www.econlib.org/library/Enc/Productivity.html
O’Mahoney, M., and de Boer W., Britain’s relative productivity performance: Updates to 1999, NIESR, March 2002.
Richardson C., ‘International Comparisons of Productivity’, ONS (2001), http://www.statistics.gov.uk/cci/article.asp?id=84
Pilat D., ‘Sources of Productivity Growth in the 21st Century – Findings From the OECD Growth Project’,OECD (2003),
http://www.euintangibles.net/library/localfiles/Pilat_sourcesofpvtygrowth.PDF
Sargent, T.C. and Rodriguez E. R., ‘Labour or Total Factor Productivity: Do we Need To Choose?’, Department of Finance
Working Paper 2001-04, Department of Finance, Canada.
Sector Skills Development Agency, ‘The Skills And Productivity Challenge’, SSDA (2003).
References
1 HM Treasury, Pre-Budget Report, Chapter 3, November 1998,
http://archive.treasury.gov.uk/pub/html/prebudgetNov98/4076.htm
2 Nasar S., ‘Productivity’, The Concise Encyclopaedia of Economics, The Library of Economics and Liberty,
http://www.econlib.org/library/Enc/Productivity.html
3 HM Treasury, Trend Growth: Recent Developments and Prospects, April 2002.
4 Crafts N., Britain’s Relative Economic Performance, 1870 to 1999, Institute of Economic Affairs, April 2002.
5 Abramovitz M., ‘Resources and output trends in the United States since 1970’, American Economic Review, vol 46.
6 GVA measures the value added by the production process; GVA is the total market value of goods and services
produced within a given period after deducting the cost of goods utilised in the process of production. The
relationship between GVA and GDP is that GDP=GVA plus taxes on products minus subsidies on products.
7 Barnes M. and Williams M., ‘UK Official Productivity Estimates: Review of Methodology’, ONS Methodology Paper, July
2004’, http://www.statistics.gov.uk/articles/nojournal/Productivity_Methods_Review.pdf
8 The hours data used in these calculations may not be totally comparable across countries. The UK uses LFS hours data,
which measures actual hours worked; some countries use employer-based estimates of hours which will tend to
measure just contractual hours, and hence be lower. As a result, this may tend to overstate productivity in these
countries relative to the UK.
9 O’Mahoney M. and de Boer W., ‘Britain’s relative productivity performance: Updates to 1999’, Final Report to
DTI/Treasury/ONS, NIESR, March 2002.
10 Crafts N., Supply-Side Policy and British Relative Economic Decline, LSE.
11 Crafts N., Britain’s Relative Economic Performance, 1870 to 1999, Institute of Economic Affairs, April 2002.
12 Crafts N., and O’Mahoney M., ‘A Perspective on UK Productivity Performance’, Fiscal Studies, vol 22, no. 3, Institute
for Fiscal Studies (2001).
13 Sector Skills Development Agency, ‘The Skills And Productivity Challenge’, SSDA (2003).
14 Disney R., Haskel J. and Heden Y., ‘Restructuring and Productivity Growth in UK Manufacturing’, Centre for Economic
Policy Research Discussion Paper no. 2463, 2000.
15 HM Treasury, Pre-Budget Report 1998, Chapter 3, ‘The Productivity Challenge’.
16 Sector Skills Development Agency, ‘The Skills And Productivity Challenge’, SSDA (2003).
17 Oulton N., ‘Labour Productivity and Foreign Ownership in the UK’, NIESR Discussion Paper no. 143, September 1998,
http://www.niesr.ac.uk/pubs/dps/dp143.PDF
18 Criscuolo C. and Martin R., ‘Multinationals, foreign ownership and US productivity leadership: Evidence from the UK’,
RES Annual Conference 2003, http://repec.org/res2003/Criscuolo.pdf
19 London Economics, Economic Brief, ‘ICT Investment and Productivity in the UK: a Regional Assessment’, April 2003,
http://www.londecon.co.uk/Publications/Regional%20implications.pdf
20 O’Mahoney M. and de Boer W., ‘Britain’s relative productivity performance: Updates to 1999’, Final Report to
DTI/Treasury/ONS, NIESR, March 2002.
Notes
Feature 1 November 2004 27/10/04 2:11 pm Page 454

Contenu connexe

Tendances

Relationship Between Marginal Product And Average Product
Relationship Between Marginal Product And Average ProductRelationship Between Marginal Product And Average Product
Relationship Between Marginal Product And Average ProductRejuwan Ahmed Malik
 
National income (expenditure method)
National income (expenditure method)National income (expenditure method)
National income (expenditure method)Navratan Sharma
 
AS Macro Revision Aggregate Supply
AS Macro Revision Aggregate SupplyAS Macro Revision Aggregate Supply
AS Macro Revision Aggregate Supplytutor2u
 
Macroeconomic indicators
Macroeconomic indicatorsMacroeconomic indicators
Macroeconomic indicatorskamylle galo
 
Long run aggregate_supply
Long run aggregate_supplyLong run aggregate_supply
Long run aggregate_supplymattbentley34
 
Cost Comparative Theory
Cost Comparative TheoryCost Comparative Theory
Cost Comparative TheoryMadhura Thite
 
National Income Accounting
National Income AccountingNational Income Accounting
National Income AccountingMazria Yuji
 
Slides growth
Slides growthSlides growth
Slides growthmuthann
 
Gdp and nnp ppt
Gdp and nnp ppt Gdp and nnp ppt
Gdp and nnp ppt Shyam Gupta
 
Module 1 introduction to labour markets & labour market institution final
Module 1 introduction to labour markets & labour market institution finalModule 1 introduction to labour markets & labour market institution final
Module 1 introduction to labour markets & labour market institution finalJinha
 
national income accounting
national income accountingnational income accounting
national income accountingRuchi reddy
 
International Trade
International TradeInternational Trade
International Tradetutor2u
 
Cobb-Douglas Production Function
Cobb-Douglas  Production  FunctionCobb-Douglas  Production  Function
Cobb-Douglas Production FunctionNabduan Duangmanee
 
AS Macro Revision: Inflation and Deflation
AS Macro Revision: Inflation and DeflationAS Macro Revision: Inflation and Deflation
AS Macro Revision: Inflation and Deflationtutor2u
 

Tendances (20)

National income
National incomeNational income
National income
 
Froyen02
Froyen02Froyen02
Froyen02
 
Relationship Between Marginal Product And Average Product
Relationship Between Marginal Product And Average ProductRelationship Between Marginal Product And Average Product
Relationship Between Marginal Product And Average Product
 
National income (expenditure method)
National income (expenditure method)National income (expenditure method)
National income (expenditure method)
 
Froyen03
Froyen03Froyen03
Froyen03
 
cobb douglas production function
cobb douglas production functioncobb douglas production function
cobb douglas production function
 
AS Macro Revision Aggregate Supply
AS Macro Revision Aggregate SupplyAS Macro Revision Aggregate Supply
AS Macro Revision Aggregate Supply
 
National income
National incomeNational income
National income
 
Terms of trade
Terms of tradeTerms of trade
Terms of trade
 
Macroeconomic indicators
Macroeconomic indicatorsMacroeconomic indicators
Macroeconomic indicators
 
Long run aggregate_supply
Long run aggregate_supplyLong run aggregate_supply
Long run aggregate_supply
 
Cost Comparative Theory
Cost Comparative TheoryCost Comparative Theory
Cost Comparative Theory
 
National Income Accounting
National Income AccountingNational Income Accounting
National Income Accounting
 
Slides growth
Slides growthSlides growth
Slides growth
 
Gdp and nnp ppt
Gdp and nnp ppt Gdp and nnp ppt
Gdp and nnp ppt
 
Module 1 introduction to labour markets & labour market institution final
Module 1 introduction to labour markets & labour market institution finalModule 1 introduction to labour markets & labour market institution final
Module 1 introduction to labour markets & labour market institution final
 
national income accounting
national income accountingnational income accounting
national income accounting
 
International Trade
International TradeInternational Trade
International Trade
 
Cobb-Douglas Production Function
Cobb-Douglas  Production  FunctionCobb-Douglas  Production  Function
Cobb-Douglas Production Function
 
AS Macro Revision: Inflation and Deflation
AS Macro Revision: Inflation and DeflationAS Macro Revision: Inflation and Deflation
AS Macro Revision: Inflation and Deflation
 

Similaire à Labour productivity

Confidence in Handling Economic Data
Confidence in Handling Economic DataConfidence in Handling Economic Data
Confidence in Handling Economic DataEton College
 
Economic measurement(1)
Economic measurement(1)Economic measurement(1)
Economic measurement(1)yacub13
 
Handling Data in AS and A2 Economics
Handling Data in AS and A2 EconomicsHandling Data in AS and A2 Economics
Handling Data in AS and A2 Economicstutor2u
 
Unit 4 na student version
Unit 4 na student versionUnit 4 na student version
Unit 4 na student versionNick Allgyer
 
Productivity_ năng suất làm việc
Productivity_ năng suất làm việc Productivity_ năng suất làm việc
Productivity_ năng suất làm việc Giap My
 
Global economy-watch-april-2015
Global economy-watch-april-2015Global economy-watch-april-2015
Global economy-watch-april-2015PwC España
 
“Analysis of GDP, Unemployment and Inflation rates using mathematical formula...
“Analysis of GDP, Unemployment and Inflation rates using mathematical formula...“Analysis of GDP, Unemployment and Inflation rates using mathematical formula...
“Analysis of GDP, Unemployment and Inflation rates using mathematical formula...IRJET Journal
 
Report on IIP trends for Fiscal year 13
Report on IIP trends for Fiscal year 13Report on IIP trends for Fiscal year 13
Report on IIP trends for Fiscal year 13Gitika Girotra
 
Running head Fundamentals of Macroeconomics 1Fundamentals.docx
Running head Fundamentals of Macroeconomics 1Fundamentals.docxRunning head Fundamentals of Macroeconomics 1Fundamentals.docx
Running head Fundamentals of Macroeconomics 1Fundamentals.docxcharisellington63520
 
Oecd going for growth 2016
Oecd   going for growth 2016Oecd   going for growth 2016
Oecd going for growth 2016Paolo Soro
 
1 Australian productivity trends and the effect of struc
1 Australian productivity trends and the effect of struc1 Australian productivity trends and the effect of struc
1 Australian productivity trends and the effect of strucMartineMccracken314
 
1 Australian productivity trends and the effect of struc
1 Australian productivity trends and the effect of struc1 Australian productivity trends and the effect of struc
1 Australian productivity trends and the effect of strucAbbyWhyte974
 
Agri 2312 chapter 14 consequences of business fluctuations
Agri 2312 chapter 14 consequences of business fluctuationsAgri 2312 chapter 14 consequences of business fluctuations
Agri 2312 chapter 14 consequences of business fluctuationsRita Conley
 
managerial economics chapter 3 .doc.docx
managerial economics chapter 3 .doc.docxmanagerial economics chapter 3 .doc.docx
managerial economics chapter 3 .doc.docxMEENAG19
 

Similaire à Labour productivity (20)

105 eng
105 eng105 eng
105 eng
 
Confidence in Handling Economic Data
Confidence in Handling Economic DataConfidence in Handling Economic Data
Confidence in Handling Economic Data
 
Economic measurement(1)
Economic measurement(1)Economic measurement(1)
Economic measurement(1)
 
Handling Data in AS and A2 Economics
Handling Data in AS and A2 EconomicsHandling Data in AS and A2 Economics
Handling Data in AS and A2 Economics
 
Capital Accumulation and Labour Productivity Growth in Nigeria
Capital Accumulation and Labour Productivity Growth in NigeriaCapital Accumulation and Labour Productivity Growth in Nigeria
Capital Accumulation and Labour Productivity Growth in Nigeria
 
Spant e
Spant eSpant e
Spant e
 
Unit 4 na student version
Unit 4 na student versionUnit 4 na student version
Unit 4 na student version
 
Productivity_ năng suất làm việc
Productivity_ năng suất làm việc Productivity_ năng suất làm việc
Productivity_ năng suất làm việc
 
Global economy-watch-april-2015
Global economy-watch-april-2015Global economy-watch-april-2015
Global economy-watch-april-2015
 
“Analysis of GDP, Unemployment and Inflation rates using mathematical formula...
“Analysis of GDP, Unemployment and Inflation rates using mathematical formula...“Analysis of GDP, Unemployment and Inflation rates using mathematical formula...
“Analysis of GDP, Unemployment and Inflation rates using mathematical formula...
 
Report on IIP trends for Fiscal year 13
Report on IIP trends for Fiscal year 13Report on IIP trends for Fiscal year 13
Report on IIP trends for Fiscal year 13
 
macro economic concepts
macro economic conceptsmacro economic concepts
macro economic concepts
 
Running head Fundamentals of Macroeconomics 1Fundamentals.docx
Running head Fundamentals of Macroeconomics 1Fundamentals.docxRunning head Fundamentals of Macroeconomics 1Fundamentals.docx
Running head Fundamentals of Macroeconomics 1Fundamentals.docx
 
Oecd going for growth 2016
Oecd   going for growth 2016Oecd   going for growth 2016
Oecd going for growth 2016
 
1 Australian productivity trends and the effect of struc
1 Australian productivity trends and the effect of struc1 Australian productivity trends and the effect of struc
1 Australian productivity trends and the effect of struc
 
1 Australian productivity trends and the effect of struc
1 Australian productivity trends and the effect of struc1 Australian productivity trends and the effect of struc
1 Australian productivity trends and the effect of struc
 
Agri 2312 chapter 14 consequences of business fluctuations
Agri 2312 chapter 14 consequences of business fluctuationsAgri 2312 chapter 14 consequences of business fluctuations
Agri 2312 chapter 14 consequences of business fluctuations
 
Global Wage Trends
Global Wage TrendsGlobal Wage Trends
Global Wage Trends
 
AS Econ session 5
AS Econ session 5AS Econ session 5
AS Econ session 5
 
managerial economics chapter 3 .doc.docx
managerial economics chapter 3 .doc.docxmanagerial economics chapter 3 .doc.docx
managerial economics chapter 3 .doc.docx
 

Dernier

Call Girls In DLf Gurgaon ➥99902@11544 ( Best price)100% Genuine Escort In 24...
Call Girls In DLf Gurgaon ➥99902@11544 ( Best price)100% Genuine Escort In 24...Call Girls In DLf Gurgaon ➥99902@11544 ( Best price)100% Genuine Escort In 24...
Call Girls In DLf Gurgaon ➥99902@11544 ( Best price)100% Genuine Escort In 24...lizamodels9
 
HONOR Veterans Event Keynote by Michael Hawkins
HONOR Veterans Event Keynote by Michael HawkinsHONOR Veterans Event Keynote by Michael Hawkins
HONOR Veterans Event Keynote by Michael HawkinsMichael W. Hawkins
 
Yaroslav Rozhankivskyy: Три складові і три передумови максимальної продуктивн...
Yaroslav Rozhankivskyy: Три складові і три передумови максимальної продуктивн...Yaroslav Rozhankivskyy: Три складові і три передумови максимальної продуктивн...
Yaroslav Rozhankivskyy: Три складові і три передумови максимальної продуктивн...Lviv Startup Club
 
Best VIP Call Girls Noida Sector 40 Call Me: 8448380779
Best VIP Call Girls Noida Sector 40 Call Me: 8448380779Best VIP Call Girls Noida Sector 40 Call Me: 8448380779
Best VIP Call Girls Noida Sector 40 Call Me: 8448380779Delhi Call girls
 
Cracking the Cultural Competence Code.pptx
Cracking the Cultural Competence Code.pptxCracking the Cultural Competence Code.pptx
Cracking the Cultural Competence Code.pptxWorkforce Group
 
Famous Olympic Siblings from the 21st Century
Famous Olympic Siblings from the 21st CenturyFamous Olympic Siblings from the 21st Century
Famous Olympic Siblings from the 21st Centuryrwgiffor
 
7.pdf This presentation captures many uses and the significance of the number...
7.pdf This presentation captures many uses and the significance of the number...7.pdf This presentation captures many uses and the significance of the number...
7.pdf This presentation captures many uses and the significance of the number...Paul Menig
 
Organizational Transformation Lead with Culture
Organizational Transformation Lead with CultureOrganizational Transformation Lead with Culture
Organizational Transformation Lead with CultureSeta Wicaksana
 
Boost the utilization of your HCL environment by reevaluating use cases and f...
Boost the utilization of your HCL environment by reevaluating use cases and f...Boost the utilization of your HCL environment by reevaluating use cases and f...
Boost the utilization of your HCL environment by reevaluating use cases and f...Roland Driesen
 
Call Girls Hebbal Just Call 👗 7737669865 👗 Top Class Call Girl Service Bangalore
Call Girls Hebbal Just Call 👗 7737669865 👗 Top Class Call Girl Service BangaloreCall Girls Hebbal Just Call 👗 7737669865 👗 Top Class Call Girl Service Bangalore
Call Girls Hebbal Just Call 👗 7737669865 👗 Top Class Call Girl Service Bangaloreamitlee9823
 
Pharma Works Profile of Karan Communications
Pharma Works Profile of Karan CommunicationsPharma Works Profile of Karan Communications
Pharma Works Profile of Karan Communicationskarancommunications
 
Regression analysis: Simple Linear Regression Multiple Linear Regression
Regression analysis:  Simple Linear Regression Multiple Linear RegressionRegression analysis:  Simple Linear Regression Multiple Linear Regression
Regression analysis: Simple Linear Regression Multiple Linear RegressionRavindra Nath Shukla
 
Mysore Call Girls 8617370543 WhatsApp Number 24x7 Best Services
Mysore Call Girls 8617370543 WhatsApp Number 24x7 Best ServicesMysore Call Girls 8617370543 WhatsApp Number 24x7 Best Services
Mysore Call Girls 8617370543 WhatsApp Number 24x7 Best ServicesDipal Arora
 
A DAY IN THE LIFE OF A SALESMAN / WOMAN
A DAY IN THE LIFE OF A  SALESMAN / WOMANA DAY IN THE LIFE OF A  SALESMAN / WOMAN
A DAY IN THE LIFE OF A SALESMAN / WOMANIlamathiKannappan
 
Monthly Social Media Update April 2024 pptx.pptx
Monthly Social Media Update April 2024 pptx.pptxMonthly Social Media Update April 2024 pptx.pptx
Monthly Social Media Update April 2024 pptx.pptxAndy Lambert
 
Call Girls Pune Just Call 9907093804 Top Class Call Girl Service Available
Call Girls Pune Just Call 9907093804 Top Class Call Girl Service AvailableCall Girls Pune Just Call 9907093804 Top Class Call Girl Service Available
Call Girls Pune Just Call 9907093804 Top Class Call Girl Service AvailableDipal Arora
 
Russian Call Girls In Gurgaon ❤️8448577510 ⊹Best Escorts Service In 24/7 Delh...
Russian Call Girls In Gurgaon ❤️8448577510 ⊹Best Escorts Service In 24/7 Delh...Russian Call Girls In Gurgaon ❤️8448577510 ⊹Best Escorts Service In 24/7 Delh...
Russian Call Girls In Gurgaon ❤️8448577510 ⊹Best Escorts Service In 24/7 Delh...lizamodels9
 
Call Girls Navi Mumbai Just Call 9907093804 Top Class Call Girl Service Avail...
Call Girls Navi Mumbai Just Call 9907093804 Top Class Call Girl Service Avail...Call Girls Navi Mumbai Just Call 9907093804 Top Class Call Girl Service Avail...
Call Girls Navi Mumbai Just Call 9907093804 Top Class Call Girl Service Avail...Dipal Arora
 

Dernier (20)

Call Girls In DLf Gurgaon ➥99902@11544 ( Best price)100% Genuine Escort In 24...
Call Girls In DLf Gurgaon ➥99902@11544 ( Best price)100% Genuine Escort In 24...Call Girls In DLf Gurgaon ➥99902@11544 ( Best price)100% Genuine Escort In 24...
Call Girls In DLf Gurgaon ➥99902@11544 ( Best price)100% Genuine Escort In 24...
 
HONOR Veterans Event Keynote by Michael Hawkins
HONOR Veterans Event Keynote by Michael HawkinsHONOR Veterans Event Keynote by Michael Hawkins
HONOR Veterans Event Keynote by Michael Hawkins
 
Yaroslav Rozhankivskyy: Три складові і три передумови максимальної продуктивн...
Yaroslav Rozhankivskyy: Три складові і три передумови максимальної продуктивн...Yaroslav Rozhankivskyy: Три складові і три передумови максимальної продуктивн...
Yaroslav Rozhankivskyy: Три складові і три передумови максимальної продуктивн...
 
unwanted pregnancy Kit [+918133066128] Abortion Pills IN Dubai UAE Abudhabi
unwanted pregnancy Kit [+918133066128] Abortion Pills IN Dubai UAE Abudhabiunwanted pregnancy Kit [+918133066128] Abortion Pills IN Dubai UAE Abudhabi
unwanted pregnancy Kit [+918133066128] Abortion Pills IN Dubai UAE Abudhabi
 
Best VIP Call Girls Noida Sector 40 Call Me: 8448380779
Best VIP Call Girls Noida Sector 40 Call Me: 8448380779Best VIP Call Girls Noida Sector 40 Call Me: 8448380779
Best VIP Call Girls Noida Sector 40 Call Me: 8448380779
 
Cracking the Cultural Competence Code.pptx
Cracking the Cultural Competence Code.pptxCracking the Cultural Competence Code.pptx
Cracking the Cultural Competence Code.pptx
 
Famous Olympic Siblings from the 21st Century
Famous Olympic Siblings from the 21st CenturyFamous Olympic Siblings from the 21st Century
Famous Olympic Siblings from the 21st Century
 
7.pdf This presentation captures many uses and the significance of the number...
7.pdf This presentation captures many uses and the significance of the number...7.pdf This presentation captures many uses and the significance of the number...
7.pdf This presentation captures many uses and the significance of the number...
 
Organizational Transformation Lead with Culture
Organizational Transformation Lead with CultureOrganizational Transformation Lead with Culture
Organizational Transformation Lead with Culture
 
Boost the utilization of your HCL environment by reevaluating use cases and f...
Boost the utilization of your HCL environment by reevaluating use cases and f...Boost the utilization of your HCL environment by reevaluating use cases and f...
Boost the utilization of your HCL environment by reevaluating use cases and f...
 
Call Girls Hebbal Just Call 👗 7737669865 👗 Top Class Call Girl Service Bangalore
Call Girls Hebbal Just Call 👗 7737669865 👗 Top Class Call Girl Service BangaloreCall Girls Hebbal Just Call 👗 7737669865 👗 Top Class Call Girl Service Bangalore
Call Girls Hebbal Just Call 👗 7737669865 👗 Top Class Call Girl Service Bangalore
 
Mifty kit IN Salmiya (+918133066128) Abortion pills IN Salmiyah Cytotec pills
Mifty kit IN Salmiya (+918133066128) Abortion pills IN Salmiyah Cytotec pillsMifty kit IN Salmiya (+918133066128) Abortion pills IN Salmiyah Cytotec pills
Mifty kit IN Salmiya (+918133066128) Abortion pills IN Salmiyah Cytotec pills
 
Pharma Works Profile of Karan Communications
Pharma Works Profile of Karan CommunicationsPharma Works Profile of Karan Communications
Pharma Works Profile of Karan Communications
 
Regression analysis: Simple Linear Regression Multiple Linear Regression
Regression analysis:  Simple Linear Regression Multiple Linear RegressionRegression analysis:  Simple Linear Regression Multiple Linear Regression
Regression analysis: Simple Linear Regression Multiple Linear Regression
 
Mysore Call Girls 8617370543 WhatsApp Number 24x7 Best Services
Mysore Call Girls 8617370543 WhatsApp Number 24x7 Best ServicesMysore Call Girls 8617370543 WhatsApp Number 24x7 Best Services
Mysore Call Girls 8617370543 WhatsApp Number 24x7 Best Services
 
A DAY IN THE LIFE OF A SALESMAN / WOMAN
A DAY IN THE LIFE OF A  SALESMAN / WOMANA DAY IN THE LIFE OF A  SALESMAN / WOMAN
A DAY IN THE LIFE OF A SALESMAN / WOMAN
 
Monthly Social Media Update April 2024 pptx.pptx
Monthly Social Media Update April 2024 pptx.pptxMonthly Social Media Update April 2024 pptx.pptx
Monthly Social Media Update April 2024 pptx.pptx
 
Call Girls Pune Just Call 9907093804 Top Class Call Girl Service Available
Call Girls Pune Just Call 9907093804 Top Class Call Girl Service AvailableCall Girls Pune Just Call 9907093804 Top Class Call Girl Service Available
Call Girls Pune Just Call 9907093804 Top Class Call Girl Service Available
 
Russian Call Girls In Gurgaon ❤️8448577510 ⊹Best Escorts Service In 24/7 Delh...
Russian Call Girls In Gurgaon ❤️8448577510 ⊹Best Escorts Service In 24/7 Delh...Russian Call Girls In Gurgaon ❤️8448577510 ⊹Best Escorts Service In 24/7 Delh...
Russian Call Girls In Gurgaon ❤️8448577510 ⊹Best Escorts Service In 24/7 Delh...
 
Call Girls Navi Mumbai Just Call 9907093804 Top Class Call Girl Service Avail...
Call Girls Navi Mumbai Just Call 9907093804 Top Class Call Girl Service Avail...Call Girls Navi Mumbai Just Call 9907093804 Top Class Call Girl Service Avail...
Call Girls Navi Mumbai Just Call 9907093804 Top Class Call Girl Service Avail...
 

Labour productivity

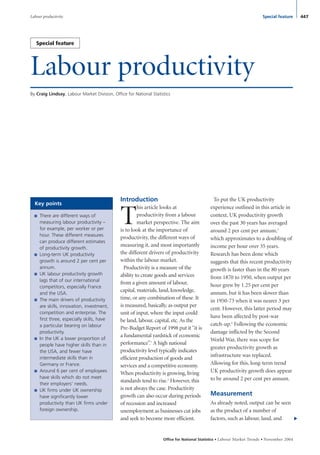
  • 1. Labour productivity By Craig Lindsay, Labour Market Division, Office for National Statistics Office for National Statistics • Labour Market Trends •November 2004 Introduction T his article looks at productivity from a labour market perspective. The aim is to look at the importance of productivity, the different ways of measuring it, and most importantly the different drivers of productivity within the labour market. Productivity is a measure of the ability to create goods and services from a given amount of labour, capital, materials, land, knowledge, time, or any combination of these. It is measured, basically, as output per unit of input, where the input could be land, labour, capital, etc. As the Pre-Budget Report of 1998 put it “it is a fundamental yardstick of economic performance”.1 A high national productivity level typically indicates efficient production of goods and services and a competitive economy. When productivity is growing, living standards tend to rise.2 However, this is not always the case. Productivity growth can also occur during periods of recession and increased unemployment as businesses cut jobs and seek to become more efficient. To put the UK productivity experience outlined in this article in context, UK productivity growth over the past 30 years has averaged around 2 per cent per annum,3 which approximates to a doubling of income per hour over 35 years. Research has been done which suggests that this recent productivity growth is faster than in the 80 years from 1870 to 1950, when output per hour grew by 1.25 per cent per annum, but it has been slower than in 1950-73 when it was nearer 3 per cent. However, this latter period may have been affected by post-war catch-up.4 Following the economic damage inflicted by the Second World War, there was scope for greater productivity growth as infrastructure was replaced. Allowing for this, long-term trend UK productivity growth does appear to be around 2 per cent per annum. Measurement As already noted, output can be seen as the product of a number of factors, such as labour, land, and ▼ 447Special featureLabour productivity ■ There are different ways of measuring labour productivity – for example, per worker or per hour. These different measures can produce different estimates of productivity growth. ■ Long-term UK productivity growth is around 2 per cent per annum. ■ UK labour productivity growth lags that of our international competitors, especially France and the USA. ■ The main drivers of productivity are skills, innovation, investment, competition and enterprise. The first three, especially skills, have a particular bearing on labour productivity. ■ In the UK a lower proportion of people have higher skills than in the USA, and fewer have intermediate skills than in Germany or France. ■ Around 6 per cent of employees have skills which do not meet their employers’ needs. ■ UK firms under UK ownership have significantly lower productivity than UK firms under foreign ownership. Key points Special feature Feature 1 November 2004 27/10/04 2:11 pm Page 447
  • 2. capital. Productivity can be measured relative to these different inputs. For example, output per acre of land, per pound invested, or per worker employed. However, it is important to note that these measures will be affected by changes to the other inputs. For example, output per worker will rise through capital investment in better equipment. Alongside the more obvious inputs such as labour or capital, there is also the concept of ‘total factor productivity’ (TFP). This captures the contribution to output of other more intangible factors: innovation, managerial skill, organisation, competition, and chance. TFP is particularly important to productivity growth, because while certain factors of production like land will always have a limited supply, the potential for increasing TFP is limitless. In principle, TFP is a more appealing measure of an economy’s efficiency as it attempts to measure output per unit of all inputs, and hence captures how effectively inputs are used together. However, in practice, it is difficult to calculate, and is often measured almost as a residual – as productivity net of the contribution of capital (both physical and human). Thus, it is largely a catch-all for a variety of influences on growth; it is, as Abramovitz put it, ‘a measure of our ignorance’.5 This article focuses on the labour market contribution to output, and hence on labour productivity. Conceptually, there are a number of ways of measuring labour productivity. At a basic level, one can measure output per worker. Alternatively, productivity can be measured per hour worked. Both provide an indication of productivity growth, but the per hour measure does have advantages. Office for National Statistics • Labour Market Trends •November 2004 The per worker measure has the downside that it can be affected by changes in employment composition. For example, if there is a move to increased part-time working, one could have a scenario whereby employment increased, but total hours worked in the economy remained unchanged. A per worker measure of productivity would suggest that output per worker had fallen; by comparison, the per hour measure would – accurately – say that productivity was unchanged. As of July 2004 the main whole economy productivity measure published by ONS is based on output per worker, and is measured as the ratio of an index of gross value added (GVA)6 at basic prices over an index of employment from the Labour Force Survey (LFS). Industry breakdowns are calculated on a per job basis, with the industry figures taken from the ONS workforce jobs series benchmarked to the LFS whole economy figure. ONS also publishes an output per hour measure which is based on the ratio of GVA and LFS hours worked. LFS hours worked measure the total actual hours worked in a week, including overtime and unpaid hours. The full reasons underlying the methodology are set out in Barnes and Williams’s UK Official Productivity Estimates: Review of Methodology.7 ONS’s preferred measure of employment is the LFS, and its use in calculating productivity is in line with international best practice. A number of other organisations produce productivity measures based on the LFS. For example, the Bank of England produces productivity growth measures based on GDP at market prices/LFS employment and GDP at market prices/LFS average weekly ▼ Special feature Labour productivity448 Annual productivity growth; United Kingdom; second quarter 1993 to fourth quarter 2003 Figure 1 Per cent Sources: National Accounts; Labour Force Survey; Bank of England 0 1 2 3 4 5 2003Q4 2003Q2 2002Q4 2002Q2 2001Q4 2001Q2 2000Q4 2000Q2 1999Q4 1999Q2 1998Q4 1998Q2 1997Q4 1997Q2 1996Q4 1996Q2 1995Q4 1995Q2 1994Q4 1994Q2 1993Q4 1993Q2 ONS Output per hour Output per worker Output per employee Bank of England Output per hour Feature 1 November 2004 27/10/04 2:11 pm Page 448
  • 3. hours. Similarly, HM Treasury also has a measure based on GVA/LFS hours. Figure 1 shows productivity growth over the period 1993-2003 as measured by both of the ONS measures and both of the Bank of England measures. As noted, the Bank and ONS use different measures of output – the Bank uses GDP, while ONS uses GVA. The latter is arguably the better measure as it excludes the effects of subsidies and taxes. However, the difference between the two is minor. As a result, while there is a degree of variability between the different measures, as the chart shows, overall they tell a reasonably similar story. Annual productivity growth started the period at 3-4 per cent (depending on the measure) before declining sharply to 1-2 per cent by 1995 where broadly it stayed until Office for National Statistics • Labour Market Trends •November 2004 1998. There was a slight pick-up (to 2.5-3.0 per cent) in 1999, and then growth fell back again before climbing sharply in 2000, reaching 3-4 per cent again. This was then followed by a sharp fall in 2001, with most measures seeing growth approaching just 0.5-1.0 per cent, and growth has now returned to around 2-3 per cent per annum. The main difference is between the per person measures and the per hour measures. The per hour measures both peak at a slightly lower rate of growth in 1994 (3.5 per cent compared with the 4.0 per cent growth seen in the per person series) and they both show noticeably stronger growth in 2000. In 2000, the per hour measures show growth of around 4.0 per cent, compared with around 3.0 per cent on the per person measures. This reflects the fact that while the year to 2000 saw ongoing strong growth in employment levels, there was slower growth in actual hours worked. Indeed, in the year to first quarter 2002, the LFS age 16 and over employment level increased by 1.2 per cent, but total actual weekly hours worked actually fell by 0.4 per cent. In addition to these fairly standard measures, there are a number of more sophisticated possible ways of estimating productivity. One might want to allow for the fact that the quality of labour varies, for example by constructing a skills-weighted index. While this is outside the scope of this article, ONS has been pursuing research in this area (Lau, 2002). The measurement of productivity is important as it gives an indication of economic health, and the choice of measure can have implications. Figure 1 suggests that the different measures show a similar story for the UK, and this is also the case for international comparisons of productivity. For example, it is well documented that there appears to be a productivity gap between the UK and its international competitors, with the UK lagging behind. The extent of the gap varies according to the measure used, but not significantly. On an output per worker basis, the G7 average in 2002 was around 13 per cent higher than the UK figure; on an output per hour basis the gap was around 12 per cent.8 Moreover, this gap is spread across a wide number of industries: a 2003 Sector Skills Development Agency report showed that out of 30 industries UK productivity was below that in the USA in 26 industries, below France in 25, and below Germany in 21. As Figure 2 shows, the UK continued to lag behind the G7 average in 2003, and specifically behind France and 449 ▼ Special featureLabour productivity International comparisons of productivity; G7 nations;a 2003 Figure 2 Index (UK=100) GDP per worker Source: Office for National Statistics a The ‘group of seven’ countries: Canada, France, Germany, Italy, Japan, UK and USA. 0 20 40 60 80 100 120 140 USAG7 excluding UKFranceUKGermanyJapan Feature 1 November 2004 27/10/04 2:11 pm Page 449
  • 4. the USA. However, on the per worker (but not the per hour) basis the UK’s productivity is similar to Germany’s. Drivers of labour productivity As already highlighted, UK productivity levels lag behind that of our international rivals. In part the relatively lower productivity growth witnessed in the UK in the post-war period compared with countries such as France or Germany is not surprising. It can be explained partly because of the relatively smaller scope for catch-up but also because of the industrial structure of the economy. France and Germany made large productivity gains by switching resources out of agriculture: by comparison, the UK had already made that switch in the nineteenth century. However, this can not be the whole explanation. UK productivity performance was nonetheless poor, such that the country was quickly caught up, and overtaken, with levels of productivity and real GDP per head lower than those of our European counterparts by the end of the 1970s. Of course, within this, there are variations across industry. For example, O’Mahoney and de Boer (2002) have found that UK labour productivity particularly lags the USA, France and Germany in manufacturing and there are also lags in distributive trades, and finance and business services. By comparison, Britain leads the way in mining and extraction productivity.9 In analysing the UK’s poor productivity performance, various economists have laid part of the blame at the door of economic policy. For example, Crafts argues that for much of the period 1950-79, the thrust of policy did not focus on Office for National Statistics • Labour Market Trends •November 2004 supply-side issues such as skills or flexibility. Rather, the focus was on subsidising physical capital, on nationalisation, on promoting ‘national champions’ and on financing prestige projects, most notably in aerospace (for example, Concorde) and nuclear power. Such policies were pursued throughout Europe, but the damage done in Britain was “relatively high”.10 Over the past two decades there has been a switch in policy to a focus on improving competitiveness through reform of industrial policy, industrial relations, tax policy, and expansion of education. The result has been that relative decline compared with France and Germany has ceased. However, the previous decline has not been reversed. In examining this ongoing productivity problem and searching for ways to close the productivity gap, the government has identified five main drivers of productivity: investment, innovation, skills, competition and enterprise. These are to be the target of government policy. Within this, labour productivity can be increased in several ways. Most obviously by improving the quality of the labour used, for example by increasing the skill level of the workforce. Increased and better use of capital – through investment in machinery – will have an impact, as will improving efficiency in how these factors of production are used together. It is important to appreciate that the different drivers do not operate in isolation; for example, innovation and skills will be affected by investment. Quality of labour Labour productivity can be increased by increasing the skills of the workforce. Better skills make workers more efficient. Indeed, research has suggested that human capital is one of the major drivers behind explaining differences in productivity. For instance, O’Mahoney and De Boer (2002) suggest that nearly a fifth of the productivity gap between Germany and the UK is due to differences in skills. Crafts and O’Mahoney (2001) also suggest that one reason why UK productivity has been lower than other countries is a lack of skills. That is not to say that the UK necessarily underinvests in education; indeed since 1950, the average years of schooling in the UK have been relatively high.11 However, despite this, in the late 1970s the UK had a lower proportion of people with higher skills than the USA, and fewer with intermediate skills than Germany and France. This pattern continued into the 1980s, and it is only in recent years that the proportion of people in the UK with low or no skills has dipped below 50 per cent (see Figure 3).12 The lack of intermediate level vocational skills was one of two major deficiencies identified by HM Treasury’s Pre-Budget Report 1998, the other being the lack of basic literacy and numeracy skills among many people: 22 per cent of adults in the UK have very poor literacy skills, compared with 14 per cent in Germany. The other problem is that there is a mismatch between the skills people have and the skills business needs. The UK economy is in a process of change; for example, there has been a long-term trend for decline in proportion of national output produced by the production industries, while the service sector has grown. However, even this is a simplification; within production there has been structural upheaval as ▼ Special feature Labour productivity450 Feature 1 November 2004 27/10/04 2:11 pm Page 450
  • 5. Office for National Statistics • Labour Market Trends •November 2004 traditional industries decline and more modern industries, such as biotech, grow. Continuous changes in economic structure require the labour market and the skills base to adapt. To the extent that this does not happen skill shortages and gaps will emerge, and productivity will suffer. The skills issue shows up in a number of areas in the UK. Some 23 per cent of establishments in England report skills gaps, where people are ‘less than fully proficient in their job’. This affects 6 per cent of employees or around 1 million workers whose skills do not meet their employers’ needs. In addition, 8 per cent of establishments in England have skills shortages vacancies; around 110,000 vacancies are hard to fill because of a lack of skills.13 Looking ahead, the Sector Skills Development Agency notes that demand for skills is likely to intensify. Innovation and enterprise Productivity can also be increased by improving the efficiency with which the different inputs to production are used, for example through better organisation of labour, or better technology. To take a classic case, Adam Smith set out the example of specialisation in a pin factory. In his visit he observed that the traditional craftsman might manufacture one pin a day. The pin factory, however, using ten men created 48,000 pins a day. This leap of productivity Smith attributed to organisation and technology: the division of labour in which one man draws out the wire, another straightens it, a third cuts it, a fourth points it, a fifth grinds the head, and so on through about 18 different operations; and, to the ability to utilise time saving machinery by which one labourer can do the work of many. The importance of innovation in 451 ▼ Special featureLabour productivity Proportions of all employees by level of skills; selected countries; 1978-79, 1993 and 1998 Figure 3 Per cent Low or no skills Source: Crafts and O’Mahoney (2001) 0 10 20 30 40 50 60 70 80 FranceGermanyUSAUK 1978-79 1993 1998 Per cent Intermediate skills 0 10 20 30 40 50 60 70 80 FranceGermanyUSAUK 1978-79 1993 1998 Per cent Higher skills 0 10 20 30 40 50 60 70 80 FranceGermanyUSAUK 1978-79 1993 1998 Feature 1 November 2004 27/10/04 2:11 pm Page 451
  • 6. driving forward productivity highlights the importance of the process of ‘creative destruction’. As some firms innovate, other technologies become obsolete and firms exit. Indeed, it has been estimated that in British manufacturing since 1980 about half of all TFP growth has come from reallocation of production from losers to winners in this creative destruction process.14 This underlines the need for competitive markets that will drive companies to innovate in order to stay competitive. The UK has a good historical record in innovation; however, in recent years the aggregate amount of spending on research and development in the UK has lagged behind that of our international competitors. In addition, government research15 has suggested that there is a comparative lack of entrepreneurial spirit; for example, while large USA firms invest heavily in small firms in cutting edge industries such as computing or biotechnology, there is little similar investment in the UK. This, combined with the fact that the venture capital market prefers investing in management buyouts, means that it can be difficult for new start-ups to get funding. Moreover, linking back to the skills issue, there is a question mark over the quality of UK managers. Management is critical to innovation and enterprise. However, many managers lack formal qualifications and undertake limited training. The result is that UK managers are often seen as less efficient than their foreign counterparts. Indeed, poor management and leadership are often cited as the main reason behind the closure of small businesses in the UK (over a third close within the first year), and it has Office for National Statistics • Labour Market Trends •November 2004 been suggested that relatively poor management skills are one of the significant factors behind the lower productivity levels in the UK.16 Indeed, research by Oulton (1998) has found that there are sizeable differences in productivity between UK firms under UK ownership and UK firms under foreign ownership. USA ownership raises productivity in manufacturing by 26 per cent, whereas other foreign ownership raises it by 14 per cent. In non- manufacturing, the figures are 34 and 31 per cent respectively. On the face of it this would support the idea that foreign ownership, and presumably management, brings increased productivity, suggesting that UK managers are indeed less efficient. However, the picture is not entirely clear: Oulton also finds that this productivity gap can be largely accounted for by higher capital investment and more skilled labour within the foreign-owned firms; though that in itself does raise the question as to why foreign-owned firms within the UK invest more capital per worker and employ better labour than UK-owned firms.17 In addition, work by Criscuolo and Martin18 has suggested that part of the apparent difference is due to multinational enterprises (MNEs). They find that MNEs, whether British or foreign, tend to be more productive than non-MNEs. This is significant because foreign-owned plants in the UK are, by definition, part of MNEs, whereas only a small fraction of domestically owned plant will also be part of UK MNEs. Therefore, if MNEs are more productive, there will be a tendency for foreign-owned plant to appear more productive, which has nothing to do with British management. On the other hand, Criscuolo and Martin also find that USA-owned firms are more productive, regardless of the MNE issue, suggesting that there is indeed a management factor. Investment As already noted, investment will have implications for labour productivity through its impact on ▼ Special feature Labour productivity452 Gross expenditure on research and development as a proportion of GDP; selected countries; 1988 to 2000 Figure 4 Per cent 0 1 2 3 2000199919981997199619951994199319921991199019891988 USA France Germany UK Source: Office of Science and Technology Feature 1 November 2004 27/10/04 2:11 pm Page 452
  • 7. skills and innovation. New investment underpins the introduction of new techniques. Again, this is an area the government believes could explain the shortfall in UK productivity levels. The UK has generally invested less than its major competitors (see Figure 4). More specifically, O’Mahoney and de Boer (2002) have found that, looking at capital per hour worked, the UK is substantially behind its rivals. For example, in 1999 the USA invested 25 per cent more capital per hour worked, France 60 per cent, and Germany 32 per cent. Linking back to the discussion of industrial productivity, one of only two industries where the UK had higher investment was mining (the other was personal services). By comparison, in manufacturing, distributive trades, and financial and business services (as well as a number of other areas) there were sizeable shortfalls. Of course, what matters more is how well investment is used. Investment needs to be well targeted (one of the problems with prestige projects). One area of investment that has been strongly associated in the economic research with Office for National Statistics • Labour Market Trends •November 2004 productivity growth is information and communication technology (ICT). It has been suggested that productivity growth results from two impacts of ICT investment: capital deepening, as per capita investment increases, and ‘new economy’ effects representing more fundamental change and the adoption of new techniques facilitated by technology. The significance of the latter is still being debated, but there appears to be a clear impact from capital deepening. For example, according to London Economics, over the period 1992-2001 ICT investment made an average contribution to labour productivity growth of 0.76 percentage points, and accounted for 47 per cent of the total annual average increase in labour productivity.19 This is a significant impact. However, looking internationally, it can be seen that there is continuing scope for improvement. Although there were a number of areas (notably manufacturing, construction, and transport and communications) where the UK ICT capital was higher than in France, total French investment in ICT capital per hour worked was 15 per cent higher than the UK in 1999. And USA ICT capital intensity is considerably greater: in total, ICT capital per hour worked was 162 per cent higher in the USA than in the UK in 1999, and it was higher in every sector.20 In general, the current picture is of UK productivity levels improving but lagging behind that of our main competitors, although for differing reasons. In the case of the USA, there is a gap in terms of higher level skills, but the main driver appears to be the USA’s investment in ICT coupled with a greater tendency to innovate and to produce better management. By comparison, the difference between the UK and France and Germany is explained primarily by the last two’s greater investment in physical and human capital. 453 ▼ Special featureLabour productivity For further information, contact: Craig Lindsay, Room B3/02, Office for National Statistics, 1 Drummond Gate, London SW1V 2QQ, E-mail: craig.lindsay@ons.gov.uk, Tel. 020 7533 5896. Further information HM Treasury, Pre-Budget Report 1998, November 1998. HM Treasury, Trend Growth: Recent Developments and Prospects, April 2002’, http://www.hm-treasury.gov.uk/budget/bud_bud02/associated_documents/bud_bud02_adtrend.cfm HM Treasury, Productivity in the UK: The Evidence and the Government’s Approach, November 2000, http://www.hm-treasury.gov.uk/Documents/Enterprise_and_Productivity/the_evidence/ent_prodevi_index.cfm HM Treasury, Productivity in the UK 5: Benchmarking UK Productivity Performance, March 2004, http://www.hm-treasury. gov.uk/consultations_and_legislation/productivity_indicators/consult_productivity_indicators_index.cfm Broadberry S. and Ghosal S., Technology, Organisation and Productivity Performance in Services: Lessons from Britain and the United States 1870-1990, Depart of Economics, University of Warwick, October 2002. Crafts N., Britain’s Relative Economic Performance, 1870 to 1999, Institute of Economic Affairs, April 2002. Crafts N., Supply-Side Policy and British Relative Economic Decline, London School of Economics. Crafts N. and O’Mahoney M., A Perspective on UK Productivity Performance, Fiscal Studies, vol 22, no 3., Institute for Fiscal Studies (2001). Disney R., Haskel J. and Heden Y., ‘Restructuring and Productivity Growth in UK Manufacturing’, Economic Journal, July 2003. References Feature 1 November 2004 27/10/04 2:11 pm Page 453
  • 8. Office for National Statistics • Labour Market Trends •November 2004 ▼ Special feature Labour productivity454 Haskel J., ‘What raises productivity? The microeconomics of UK productivity growth’ (2000), http://alpha.qmul.ac.uk/~ugte193/papers/raiseprod1.pdf Haskel J. and Pereira S., ‘Skills and productivity in the UK using matched establishment and worker data’, ONS (2002), http://www.statistics.gov.uk/articles/nojournal/Paper_6_skills_productivity.pdf Lau E., ‘Skills and Productivity: Developing New Measures’, ONS (2002), http://www.statistics.gov.uk/events/new_economy_measurement/downloads/NEMW(03)_EL_Skills_and_Productivity.pdf Nasar S., ‘Productivity’, The Concise Encyclopaedia of Economics, The Library of Economics and Liberty, http://www.econlib.org/library/Enc/Productivity.html O’Mahoney, M., and de Boer W., Britain’s relative productivity performance: Updates to 1999, NIESR, March 2002. Richardson C., ‘International Comparisons of Productivity’, ONS (2001), http://www.statistics.gov.uk/cci/article.asp?id=84 Pilat D., ‘Sources of Productivity Growth in the 21st Century – Findings From the OECD Growth Project’,OECD (2003), http://www.euintangibles.net/library/localfiles/Pilat_sourcesofpvtygrowth.PDF Sargent, T.C. and Rodriguez E. R., ‘Labour or Total Factor Productivity: Do we Need To Choose?’, Department of Finance Working Paper 2001-04, Department of Finance, Canada. Sector Skills Development Agency, ‘The Skills And Productivity Challenge’, SSDA (2003). References 1 HM Treasury, Pre-Budget Report, Chapter 3, November 1998, http://archive.treasury.gov.uk/pub/html/prebudgetNov98/4076.htm 2 Nasar S., ‘Productivity’, The Concise Encyclopaedia of Economics, The Library of Economics and Liberty, http://www.econlib.org/library/Enc/Productivity.html 3 HM Treasury, Trend Growth: Recent Developments and Prospects, April 2002. 4 Crafts N., Britain’s Relative Economic Performance, 1870 to 1999, Institute of Economic Affairs, April 2002. 5 Abramovitz M., ‘Resources and output trends in the United States since 1970’, American Economic Review, vol 46. 6 GVA measures the value added by the production process; GVA is the total market value of goods and services produced within a given period after deducting the cost of goods utilised in the process of production. The relationship between GVA and GDP is that GDP=GVA plus taxes on products minus subsidies on products. 7 Barnes M. and Williams M., ‘UK Official Productivity Estimates: Review of Methodology’, ONS Methodology Paper, July 2004’, http://www.statistics.gov.uk/articles/nojournal/Productivity_Methods_Review.pdf 8 The hours data used in these calculations may not be totally comparable across countries. The UK uses LFS hours data, which measures actual hours worked; some countries use employer-based estimates of hours which will tend to measure just contractual hours, and hence be lower. As a result, this may tend to overstate productivity in these countries relative to the UK. 9 O’Mahoney M. and de Boer W., ‘Britain’s relative productivity performance: Updates to 1999’, Final Report to DTI/Treasury/ONS, NIESR, March 2002. 10 Crafts N., Supply-Side Policy and British Relative Economic Decline, LSE. 11 Crafts N., Britain’s Relative Economic Performance, 1870 to 1999, Institute of Economic Affairs, April 2002. 12 Crafts N., and O’Mahoney M., ‘A Perspective on UK Productivity Performance’, Fiscal Studies, vol 22, no. 3, Institute for Fiscal Studies (2001). 13 Sector Skills Development Agency, ‘The Skills And Productivity Challenge’, SSDA (2003). 14 Disney R., Haskel J. and Heden Y., ‘Restructuring and Productivity Growth in UK Manufacturing’, Centre for Economic Policy Research Discussion Paper no. 2463, 2000. 15 HM Treasury, Pre-Budget Report 1998, Chapter 3, ‘The Productivity Challenge’. 16 Sector Skills Development Agency, ‘The Skills And Productivity Challenge’, SSDA (2003). 17 Oulton N., ‘Labour Productivity and Foreign Ownership in the UK’, NIESR Discussion Paper no. 143, September 1998, http://www.niesr.ac.uk/pubs/dps/dp143.PDF 18 Criscuolo C. and Martin R., ‘Multinationals, foreign ownership and US productivity leadership: Evidence from the UK’, RES Annual Conference 2003, http://repec.org/res2003/Criscuolo.pdf 19 London Economics, Economic Brief, ‘ICT Investment and Productivity in the UK: a Regional Assessment’, April 2003, http://www.londecon.co.uk/Publications/Regional%20implications.pdf 20 O’Mahoney M. and de Boer W., ‘Britain’s relative productivity performance: Updates to 1999’, Final Report to DTI/Treasury/ONS, NIESR, March 2002. Notes Feature 1 November 2004 27/10/04 2:11 pm Page 454