POSSESSION AND GOAL SCORING OPPORTUNITIES IN FOOTBALL
•
1 j'aime•356 vues

The primary aim of this study is to determine the passing patterns that are more likely to create goal scoring opportunities. The objectives include: • Examine passing patterns in the attacking third and evaluate their effectiveness in retaining possession • Determine the passing trends of winning and losing teams • Explore the relationship between pass type and pass outcome
Recommandé

Recommandé
Contenu connexe
Similaire à POSSESSION AND GOAL SCORING OPPORTUNITIES IN FOOTBALL
Similaire à POSSESSION AND GOAL SCORING OPPORTUNITIES IN FOOTBALL (20)
Plus de Keane Wheeler
Dernier
Dernier (20)
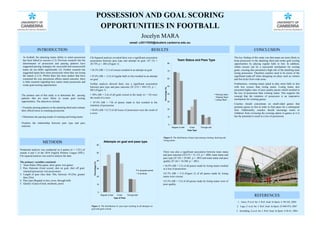
POSSESSION AND GOAL SCORING OPPORTUNITIES IN FOOTBALL
- 1. REFERENCES 1. Jones, P et al. Int. J. Perf. Anal. In Sport. 4: 98-102, 2004 2. Lago, C et al. Int. J. Perf. Anal. In Sport. 25:969-974, 2007 3. Scoulding, A et al. Int. J. Perf. Anal. In Sport. 4:36-41, 2004 CONCLUSION The key finding of this study was that teams are more likely to keep possession in the attacking third and create goal scoring opportunities by playing regular balls to feet. In addition, whilst crosses can be a successful mechanism for scoring goals, crossing also presented a high risk of the attacking team losing possession. Therefore coaches need to be aware of the significant trade-off when designing set plays such as corners and free kicks from wide areas. Furthermore, winning teams opted to play more balls to feet with less crosses than losing teams. Losing teams also presented higher rates of poor quality passes which resulted in the loss of possession than winning teams. This supports the concept that the retention of possession is an imperative mechanism for winning games. Coaches should concentrate on small-sided games that promote passes to feet in order to find space for a subsequent shot. Additionally, coaches should encourage teams to withdraw from overusing the crossing option in games as it is has the potential to result in a loss of possession. RESULTSINTRODUCTION In football, the attacking teams ability to retain possession has been linked to success (1,3). Previous research into the determinants of possession and passing patterns have suggested passing strategies for successful and unsuccessful teams do not differ significantly (3). Further research has suggested teams have more possession when they are losing the match (1,2,3). Whilst there has been studies that have examined the way possession affects match outcome, there is little research regarding how teams retain possession and create goal-scoring opportunities. METHODS Notational analysis was conducted on 6 games (n = 1121) of rounds 4 and 5 of the 2010 English Premier League (EPL). Chi-squared analysis was used to analyse the data. The primary variables consisted: 1. Team Status (Won game, drew game, lost game) 2. Pass Outcome (Goal scored, shot on goal, shot off goal, retained possession, lost possession) 3. Length of pass (less than 10m, between 10-25m, greater than 25m) 4. Pass type (Regular to feet, cross, through ball) 5. Quality of pass (Good, moderate, poor) Jocelyn MARA POSSESSION AND GOAL SCORING OPPORTUNITIES IN FOOTBALL Chi Squared analysis revealed there was a significant association association between pass type and attempt on goal. (X2 (3) = 20.759, p < .001) (Figure 1) . • 36.3% (SR = 3.1) of crosses resulted in an attempt on goal • 47.6% (SR = -2.5) of regular balls to feet resulted in an attempt on goal. Further analysis showed there was a significant association between pass type and pass outcome (X2 (15) = 444.155, p < . 001) (Figure 1) • 50% (SR = 2.4) of all goals scored in the study (n = 18) were the result of a cross • 87.4% (SR = 7.0) of passes made to feet resulted in the retention of possession • 58.8% (SR =12.7) of all losses of possession were the result of a cross email: u3017005@student.canberra.edu.au Figure 1: The distribution of pass type resulting in all attempts on goal and goals scored Figure 2: The distribution of pass type among winning, drawing and losing teams. The primary aim of this study is to determine the passing patterns that are more likely to create goal scoring opportunities. The objectives include: • Examine passing patterns in the attacking third and evaluate their effectiveness in retaining possession • Determine the passing trends of winning and losing teams • Explore the relationship between pass type and pass outcome 0 10 20 30 40 50 60 Regular to feet Cross Through ball Percentage(%) Type of Pass Attempts on goal and pass type % all goals scored % all shots 0 10 20 30 40 50 60 70 80 Regular to feet Cross Through ball Percentage(%) Pass Type Team Status and Pass Type Winning Team Drawing Team Losing Team There was also a significant association between team status and pass outcome (X2(15) = 31.112, p = .008), team status and pass type (X2 (9) = 29.401, p = .001) and team status and pass quality (X2 (6) = 34.560, p < .001). • 36.9% (SR = 3.5) of all passes made by losing teams resulted in a loss of possession. • 32.7% (SR = 3.3) (Figure 2) of all passes made by losing teams were crosses • 33.5% (SR = 3.2) of all passes made by losing teams were of poor quality.