

Recommandé
Contenu connexe
En vedette
En vedette (16)
Similaire à NPI Evaluation of Spark
Similaire à NPI Evaluation of Spark (20)
Plus de Nonprofit Investor
Plus de Nonprofit Investor (12)
Dernier
Dernier (20)
NPI Evaluation of Spark
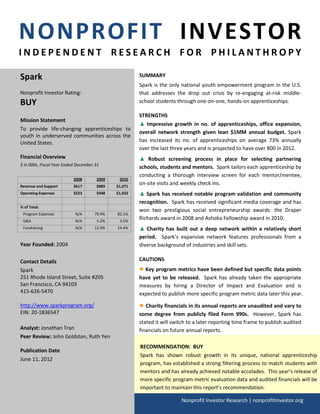
- 1. NONPROFIT INVESTOR INDEPENDENT RESEARCH FOR PHILANTHROPY Spark SUMMARY Spark is the only national youth empowerment program in the U.S. Nonprofit Investor Rating: that addresses the drop out crisis by re-engaging at-risk middle- BUY school students through one-on-one, hands-on apprenticeships. STRENGTHS Mission Statement ▲ Impressive growth in no. of apprenticeships, office expansion, To provide life-changing apprenticeships to overall network strength given lean $1MM annual budget. Spark youth in underserved communities across the United States. has increased its no. of apprenticeships on average 73% annually over the last three years and is projected to have over 800 in 2012. Financial Overview ▲ Robust screening process in place for selecting partnering $ in 000s, Fiscal Year Ended December 31 schools, students and mentors. Spark tailors each apprenticeship by conducting a thorough interview screen for each mentor/mentee, 2008 2009 2010 Revenue and Support $617 $889 $1,071 on-site visits and weekly check ins. Operating Expenses $523 $948 $1,032 ▲ Spark has received notable program validation and community recognition. Spark has received significant media coverage and has % of Total: won two prestigious social entrepreneurship awards: the Draper Program Expenses N/A 79.4% 82.1% G&A N/A 5.2% 3.5% Richards award in 2008 and Ashoka Fellowship award in 2010. Fundraising N/A 12.4% 14.4% ▲ Charity has built out a deep network within a relatively short period. Spark’s expansive network features professionals from a Year Founded: 2004 diverse background of industries and skill sets. Contact Details CAUTIONS Spark ● Key program metrics have been defined but specific data points 251 Rhode Island Street, Suite #205 have yet to be released. Spark has already taken the appropriate San Francisco, CA 94103 measures by hiring a Director of Impact and Evaluation and is 415-626-5470 expected to publish more specific program metric data later this year. http://www.sparkprogram.org/ ● Charity financials in its annual reports are unaudited and vary to EIN: 20-1836547 some degree from publicly filed Form 990s. However, Spark has stated it will switch to a later reporting time frame to publish audited Analyst: Jonathan Tran financials on future annual reports. Peer Review: John Goldston, Ruth Yen RECOMMENDATION: BUY Publication Date Spark has shown robust growth in its unique, national apprenticeship June 11, 2012 program, has established a strong filtering process to match students with mentors and has already achieved notable accolades. This year’s release of more specific program metric evaluation data and audited financials will be important to maintain this report’s recommendation. Nonprofit Investor Research | nonprofitinvestor.org
- 2. OVERVIEW OF SPARK’S ACTIVITIES Former middle school teachers Chris Balme and Melia Dicker founded Spark in 2004 after they identified the major issue that 30% of U.S. students drop out of high school, with these rates exceeding 50% in poor urban communities. This ignited Chris and Melia’s career passion to link students with apprenticeships to provide them the skills and confidence to succeed in their school and future career aspirations. Spark pairs 7th and 8th grade middle school students with a professional volunteer mentor (“Apprentice Teacher”) in the student’s “dream” career through a one-on-one apprenticeship that lasts for a semester. Students have the option to participate in up to four apprenticeships, which allow them to gain professional and life experience working with their mentor in a way that would otherwise be an impossible opportunity. Outside of the apprenticeship, students also participate in a workshop-based leadership class that focuses on critical life skills such as literacy, networking and resume writing. Additionally, students can go on interactive field trips with partnering local companies like Google and engage their community’s business leaders and members through “Community Quests”. Before the start of each apprenticeship round, Spark will work with school partner leaders to identify students for the program and once selected, the two parties will interview each student through a “Myers Briggs” similar test to understand each student’s passions and character traits. The charity will screen out mentors to add to its network by requiring applications and conducting background checks and on-site visits to ensure the environment is conducive for the kids. Additionally, Spark will require that two adults are always present for the kids’ safety. Mentors are required to go through an extensive training program prior to the start of the apprenticeship. Spark identifies mentors for each semester’s apprenticeships by either looking at past mentors or tailoring their search to a particular area once a new school partnership is added. Spark currently serves middle school students in the San Francisco Bay Area, Los Angeles and Chicago with near-term plans of expanding its programs to Oakland and Philadelphia in 2012. Spark piloted its first program in Redwood City, CA in the summer of 2005, and by 2008 the organization operated four program sites in the Bay Area, serving about 250 students. After five years of testing and validating its model in the Bay Area, Spark went on to pilot its program in Los Angeles in Spring 2010, San Rafael in Fall 2010 and began to lay the foundation for its first national expansion to Chicago. PROGRAM RESULTS AND EFFECTIVENESS Spark’s early findings have found that their apprenticeship programs have had positive impacts on their students. A statistical analysis conducted in 2011 has shown that students’ grades have improved from one trimester to another, particularly in the English subject. Also, the charity’s initial studies have shown that 88% of participating middle school students have become more interested in learning after completing the program and 90% of students say they have learned new skills. The majority of students have built relationships with their apprenticeship teachers. Over 70% of students surveyed in the 2009-2010 school year said they will talk to and will ask their mentors for help again. The charity has expressed a commitment to improving its data collection to measure the efficacy of its programs and intends to make the results publicly available. It hired a Director of Evaluation and Impact last year to address the importance of analyzing specific program metric data. Spark has made it a priority to build a better infrastructure to evaluate its programs and this topic was front and center on a recent Board of Director’s agenda. Already, the charity has come up with very specific metrics they will track going forward to evaluate their programs’ effectiveness. Spark defines their six broad measures of student success as: 1) grade and attendance improvement, 2) higher student engagement, 3) development of personal resources, 4) high school graduation rate, 5) increased social capital for students and families, and 6) development of positive future orientation. Spark has clearly defined two numeric hurdles for each of these six broad categories of student success. Spark | Nonprofit Investor Research 2
- 3. Additionally in efforts to improve data tracking, the charity targets partnerships with schools that have access to more data on its students. Spark’s first alumni study revealed a 98.2% high school enrollment rate, which is substantially higher than equivalent demographic averages. Also, Spark has used surveys by students’ parents and teachers to get a gauge of how impactful its programs are. More specific information on these programs will be important to see on the charity’s next annual report. These figures are expected to be available to the public later this year. TRANSPARENCY Spark has consistently made available annual reports directly on its website for the last four years. These reports were helpful in communicating the CEO’s evaluation on the charity’s full year progress, as well as other notable accomplishments and activities. Additionally, the charity has filed its Form 990s on a regular basis. While Spark has clearly identified key data metrics to evaluate its programs’ effectiveness, it has not publicly published any post- apprenticeship program study. These statistics will be extremely important to more accurately gauge program effectiveness and its long-term impact on students. FINANCIAL OVERVIEW Revenue Breakdown Expense Breakdown ($USD) ($USD) Spark is a lean organization and its revenues have grown solidly over the past several years, annualizing at an average rate of 80%+ over the past few years and have grown ahead of expense increases over same time period. The charity derives essentially all its revenues from foundation, individual and corporation support. In the latest reported period (2010), foundation support accounted for 63% of total revenues, individual for 27% and corporate for 9%. The ability for Spark to sustain its strong growth trajectory will depend heavily on the charity’s ability to maintain its strong support from these donors. We believe that Spark should continue to publish informative annual reports, but should begin to include more specific program metric results in order to validate Spark’s programs to its various donors. Separately, tuition revenue, which accounted for 5% of total revenues in 2007, was a model offered to students who weren’t considered “at risk” but still wanted to participate. This program was stopped recently because the charity wanted to focus on just providing free services. In terms of apprenticeships, Spark has grown this number from just 12 in 2005 to 515 in 2011, which represents a +76% annualized rate. This growth is impressive given Spark’s lean $1MM budget. On the expense side, the charity has seen a big ramp up in 2008 and 2009, with expenses increasing 168% and 81% year over year, respectively. Over 70% of total expenses in 2010 were employee-related salaries and benefits. Personnel costs have composed the bulk of Spark’s expenses over the past several years and this trend is expected given the nature of its apprenticeship model. As the charity continues its goals of expanding into new offices nationally, we expect payroll expenses will continue to grow. The charity has demonstrated it can serve a growing number of students faster than the ramp in its total expenses. In 2010, the cost per student was $2,949, which is about half the level it was in 2008-2009. The broad $1,000 cost per student mentioned on Spark’s website is just a general framework to help Spark | Nonprofit Investor Research 3
- 4. donors make a donation. According to the charity, the cost per student is approximately $1,200 in the Bay area, $1,600 in Los Angeles and $1,425 in Chicago. However, as these figures appear to exclude certain other expenses, they should not be compared directly to the cost per beneficiary calculations in the detailed financial statement below. Detailed Financial Statement ($USD) Spark | Nonprofit Investor Research 4
- 5. THIRD PARTY RATINGS There is currently minimal coverage of Spark on third party review websites. Charity Navigator does not cover this organization and Great Nonprofits has a 5-star rating of this organization based on 11 voluntary site reviews. These reviews are a bit outdated, with the most recent review on September 2010. Guidestar provides a high level summary of Spark and assigns the same 5-star rating, which is directly powered by Great Nonprofits 11 reviews. GET INVOLVED Donate: http://www.sparkprogram.org/index.php/get_involved/donate Volunteer: http://www.sparkprogram.org/index.php/get_involved/volunteer Become a Partner: http://www.sparkprogram.org/index.php/get_involved/corporate_partnership DISCLOSURES Jonathan Tran certifies that he does not have any affiliation with Spark and has never made a donation to the organization. Additionally, Jonathan has not supported directly competing organizations in a greater capacity than a nominal donation. NPI analysts and NPI as an organization do not receive any form of compensation from reviewed charities. This report is for informational purposes only and does not constitute a solicitation for donations. While the reliability of information contained in this report has been assessed by NPI, NPI makes no representation as to its accuracy or completeness, except with respect to the Disclosure Section of the report. Any opinions expressed herein reflect our judgment as of the date of the materials and are subject to change without notice. NPI has no obligation to update, modify or amend any report or to otherwise notify a reader thereof in the event that any matter stated herein, or any opinion, projection, forecast or estimate set forth herein, changes or subsequently becomes inaccurate, or if research on the subject organization is withdrawn. Opinions and recommendations in our reports do not take into account specific reader circumstances, objectives, or needs. The recipients of our reports must make their own independent decisions regarding any organization mentioned by NPI. Spark | Nonprofit Investor Research 5