Details on the indicators included within the Community Needs Index. This formed part of the research 'Left behind? Understanding communities on the edge' from Local Trust and OCSI
CHEAP Call Girls in Saket (-DELHI )🔝 9953056974🔝(=)/CALL GIRLS SERVICE
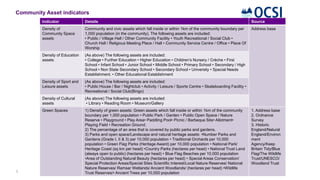
Community Needs Index Domains
1. Indicator Details Source
Density of
Community Space
assets
Community and civic assets which fall inside or within 1km of the community boundary per
1,000 population (in the community). The following assets are included:
• Public / Village Hall / Other Community Facility • Youth Recreational / Social Club •
Church Hall / Religious Meeting Place / Hall • Community Service Centre / Office • Place Of
Worship
Address base
Density of Education
assets
(As above) The following assets are included:
• College • Further Education • Higher Education • Children’s Nursery / Crèche • First
School • Infant School • Junior School • Middle School • Primary School • Secondary / High
School • Non State Secondary School • Secondary School • University • Special Needs
Establishment. • Other Educational Establishment
Density of Sport and
Leisure assets
(As above) The following assets are included:
• Public House / Bar / Nightclub • Activity / Leisure / Sports Centre • Skateboarding Facility •
Recreational / Social Club(Bingo)
Density of Cultural
assets
(As above) The following assets are included:
• Library • Reading Room • Museum/Gallery
Green Spaces 1) Density of green assets: Green assets which fall inside or within 1km of the community
boundary per 1,000 population • Public Park / Garden • Public Open Space / Nature
Reserve • Playground • Play Area• Paddling Pool• Picnic / Barbeque Site• Allotment•
Playing Field • Recreation Ground.
2) The percentage of an area that is covered by public parks and gardens.
3) Parks and open space/Landscape and natural heritage assets: •Number Parks and
Gardens (Grade I, II & 3) per 10,000 population • Traditional Orchards per 10,000
population • Green Flag Parks (Heritage Award) per 10,000 population • National Park/
Heritage Coast (sq km per head) •Country Parks (hectares per head) • National Trust Land
(always open to public) (hectares per head) • Blue Flag Beaches per 10,000 population
•Area of Outstanding Natural Beauty (hectares per head) • Special Areas Conservation/
Special Protection Areas/Special Sites Scientific Interest/Local Nature Reserves/ National
Nature Reserves/ Ramsar Wetlands/ Ancient Woodlands/ (hectares per head) •Wildlife
Trust Reserves/• Ancient Trees per 10,000 population
1. Address base
2. Ordnance
Survey
3. Historic
England/Natural
England/Environ
ment
Agency/Keep
Britain Tidy/Blue
Flag/The Wildlife
Trust/UNESCO/
Woodland Trust
1
Community Asset indicators
2. Indicator Details Source
Jobs density in the
Travel to Work Area
The number of jobs located in the local area as a percentage of the working age population
in that area. Data is taken from the Business Register and Employment Survey (BRES) of
approximately 80,000 businesses and weighted to represent all sectors of the UK economy.
Business
Register and
Employment
Survey
Travel time (mins) to
key services by public
transport/walk
These statistics are derived from the analysis of spatial data on public transport timetables;
road, cycle and footpath networks; population and key local services. The following
services are included:
• Primary School • Further Education • Secondary School • Hospital
• Town Centre • Employment Centre • GP• Supermarket
Department for
Transport
People living alone Shows the proportion of households that are comprised of one person living alone (as a
proportion of all households). Figures are self-reported and taken from the household
composition questions in the 2011 census. This is included as a proxy measure of social
isolation.
Census 2011
Households with no car The proportion of households who do not have a car or van. Figures are based on
responses to the 2011 Census car ownership question.
Census 2011
Broadband speeds A composite indicator of the average broadband download linespeed (Mbit/s) for
connections in the area and The percentage of broadband connections in the area that
receive low download speeds (less than 2 Mbit/s).
Ofcom
2
Connectedness indicators
3. Indicator Details Source
Voter turnout at
Local Elections
Valid votes turnout (%) at the most recent Local Council Elections Electoral Commission
Registered charities
per head
Registered Charities in England by Postcode Charities Commission
Big Lottery funding
per head
Combined total of grants made to local projects and organisations by the Big Lottery Fund
between 2004 and 2015 per head of population (£). Figures are taken from data on grants
made to projects and organisations in local areas in the UK by the Big Lottery Fund, from
ward grants data published by Big Lottery in conjunction with the 360Giving initiative.
Big Lottery (through
360 Giving)
Grant funding per
head from major
grant funders
Combined grant funding from grant giving organisations whose data has be subject to the
360giving standard.
360 Giving Grant Nav
data
SME lending by
banks
Total value of lending to SME businesses from key financial lenders (Barclays, CYBG,
Lloyds Banking Group, HSBC, Nationwide Building Society, Royal Bank of Scotland and
Santander UK in Great Britain).
UK Finance
Arts Council
Funding
Data on a range of arts council funding stream, location of national portfolio organisations
are located and how much each organisation receives in funding.
Arts council England
Self-reported
measures of
community and civic
participation
As part of the National Indicator Set programme, MHCLG collected a series of indicators
relating to community and civic participation
• Civic participation in the local area (The proportion of the adult population who say they
have in the last 12 months participated in a group which makes decisions that affect their
local area) • Percentage who have given unpaid help at least once per month over the last
12 months • Young people’s participation in positive activities (The proportion of young
people in school year 10 reporting participating in any group activity led by an adult outside
school lessons (such as sports, arts, music or youth group) in the last four weeks based on
the analysis of the weighted)
Place Survey /TellUs
Survey
3
Active and engaged community indicators (part 1)
4. Indicator Details Source
Strength of local
social relationships
Self reported measures of strength of local social relationships: Calculated by combining
responses to the following questions: "To what extent would you agree or disagree that
people in this neighbourhood pull together to improve the neighbourhood?" "The
friendships and associations I have with other people in my neighbourhood mean a lot to
me." "I borrow things and exchange favours with my neighbours." "I regularly stop and
talk with people in my neighbourhood." "I would be willing to work together with others on
something to improve my neighbourhood." "If I needed advice about something I could
go to someone in my neighbourhood."
Social Life (constructed
from responses to the
Community Life Survey
and Understanding
Society Survey)
Leisure and Cultural
Participation a)
Culture and Heritage
participation
A combined indicator derived from responses to the Taking Part survey to produce the
following indicators
• % of local authority population visiting heritage site at least 3 times in last 12 months
• % of local authority population visiting museum or gallery at least once in last 12
months
• % of local authority population visiting archive at least once in last 12 months
Taking Part survey
Leisure and Cultural
Participation b)
Participation in sport
This data shows the modelled estimated percentage of adults (aged 16+) who are
classed as ‘active’. People are described as being active if they have done at least 150
minutes of moderate intensity equivalent (MIE) physical activity (excluding gardening) in
the past week. Activity is counted in moderate intensity equivalent minutes whereby each
‘moderate’ minute counts as one minute and each 'vigorous' minute counts as two
moderate minutes. Moderate activity is defined as activity where you raise your breathing
rate, whereas vigorous activity is defined as doing activity where you are out of breath or
are sweating (you may not be able to say more than a few words without pausing for
breath).
Sport England (Active
Lives Adult Survey)
4
Active and engaged community indicators (part 2)