More than Just Lines on a Map: Best Practices for U.S Bike Routes
Daily market recap Saudi arabia
1. Daily Market Recap
July 27, 2011
Market Summary
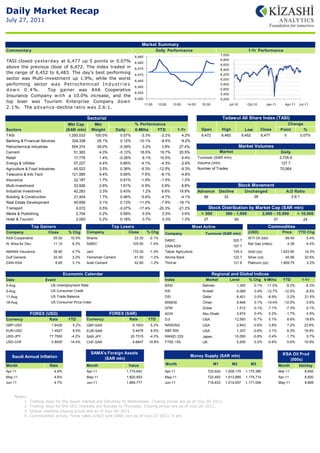
Commentary Daily Performance 1-Yr Performance
7,000
6,485
TASI closed y e ste rd ay at 6,477 up 5 points or 0.07% 6,480
6,800
6,600
above the previous close of 6,472. The index traded in 6,475 6,400
the range of 6,452 to 6,483. The day's best performing 6,470 6,200
sector was Multi-investment up 1.9%, while the worst 6,000
6,465
performing sector was Pe troche mical I n d u s t r i e s 5,800
6,460
d o w n 0 . 4 %. Top gainer was AXA Cooperative 5,600
6,455
Insurance Company w i t h a 10.0% increase, and the 5,400
6,450 5,200
top loser was Tourism Enterprise Company d own
11:00 12:00 13:00 14:00 15:00 Jul-10 Oct-10 Jan-11 Apr-11 Jul-11
2.1%. The a d v a n ce -decline ratio was 2.6:1.
Sectorial Tadawul All Share Index (TASI)
Performance
Mkt Cap Mkt % Performance Change
Sectors (SAR mln) Weight Daily 6-Mths YTD 1-Yr Open High Low Close Point %
TASI 1,293,033 100.0% 0.07% -3.3% -2.2% 4.2% 6,472 6,483 6,452 6,477 5 0.07%
Banking & Financial Services 324,338 25.1% 0.12% -10.1% -8.5% -8.2%
Petrochemical Industries 504,374 39.0% -0.39% 3.2% 3.8% 27.4% Market Volumes
Cement 51,383 4.0% -0.12% 16.5% 19.7% 20.5% Market Daily
Retail 17,776 1.4% -0.26% 8.1% 10.5% 9.4% Turnover (SAR mln) 2,735.6
Energy & Utilities 57,227 4.4% 0.66% -4.1% -4.3% -2.6% Volume (mln) 127.7
Agriculture & Food Industries 45,523 3.5% 0.38% -9.3% -12.5% -9.3% Number of Trades 70,064
Telecoms & Info Tech 121,085 9.4% 0.95% -7.6% -8.1% -4.8%
Insurance 22,187 1.7% 0.91% -1.9% -1.5% 1.2%
Multi-investment 33,926 2.6% 1.91% -0.9% 0.9% 8.8% Stock Movement
Industrial Investment 42,283 3.3% 0.43% 1.2% 9.6% 19.9% Advance Decline Unchanged A:D Ratio
Building & Construction 21,404 1.7% 0.46% -5.6% -4.7% -4.1% 86 33 26 2.6:1
Real Estate Development 40,656 3.1% 0.13% -11.0% -7.9% -16.1%
Transport 6,072 0.5% -0.07% -17.4% -20.3% -21.2% Stock Distribution by Market Cap (SAR mln)
Media & Publishing 2,704 0.2% 0.59% 5.5% 2.0% 3.6% < 500 500 - 1,999 2,000 - 10,000 > 10,000
Hotel & Tourism 2,093 0.2% 0.18% 0.7% 0.3% 1.3% 27 59 37 24
Top Gainers Top Losers Most Active Commodities
Company Close % Chg Company Close % Chg Company Turnover (SAR mln) (USD) Price YTD Chg
AXA-Cooperative 55.00 10.0% Shams 23.30 -2.1% W TI Oil (bbl) 99.46 5.4%
SABIC 520.7
Al Ahsa for Dev. 11.10 8.3% SABIC 105.50 -1.4% Nat Gas (mbtu) 4.38 -4.4%
ZAIN KSA 157.7
AMANA Insurance 39.80 4.7% Jarir 170.00 -1.3% Tabuk Agriculture 129.3 Gold (oz) 1,623.85 14.3%
Gulf General 32.40 3.2% Yamamah Cement 61.50 -1.2% Alinma Bank 122.7 Silver (oz) 40.99 32.6%
ZAIN KSA 6.65 3.1% Arab Cement 42.60 -1.2% Thim'ar 121.6 Platinum (oz) 1,809.75 2.2%
Economic Calendar Regional and Global Indices
Date Event Index Market Level % Chg 6-Mths YTD 1-Yr
5-Aug US Unemployment Rate BASI Bahrain 1,300 0.1% -11.0% -9.2% -6.3%
5-Aug US Consumer Credit KSI Kuwait 6,089 0.4% -12.7% -12.5% -8.5%
11-Aug US Trade Balance DSI Qatar 8,401 0.0% -6.9% -3.2% 21.5%
18-Aug US Consumer Price Index MSM30 Oman 5,946 0.1% -14.4% -12.0% -3.6%
DFM Dubai 1,512 0.1% -7.1% -7.3% 0.1%
FOREX (USD) FOREX (SAR) ADXI Abu Dhabi 2,674 0.4% 0.2% -1.7% 4.5%
Currency Rate YTD Currency Rate YTD DJI USA 12,593 -0.7% 5.1% 8.8% 19.6%
GBP-USD 1.6426 5.2% GBP-SAR 6.1603 5.2% NASDAQ USA 2,843 -0.6% 3.8% 7.2% 23.8%
EUR-USD 1.4527 8.5% EUR-SAR 5.4476 8.5% S&P 500 USA 1,337 -0.6% 3.1% 6.3% 19.9%
USD-JPY 77.7500 -4.2% SAR-JPY 20.7315 -4.2% NIKKEI 225 Japan 10,050 -0.8% -3.4% -1.7% 5.7%
USD-CHF 0.8005 -14.4% CHF-SAR 4.6847 16.8% FTSE 100 UK 5,935 0.2% -0.6% 0.6% 10.9%
SAMA's Foreign Assets KSA Oil Prod
Saudi Annual Inflation Money Supply (SAR mln)
(SAR mln) (000s)
Month Rate Month Value Month M1 M2 M3 Month bbl/day
Apr-11 4.8% Apr-11 1,774,543 Apr-11 722,624 1,009,170 1,175,390 Mar-11 8,655
May-11 4.6% May-11 1,820,653 May-11 722,483 1,013,885 1,174,714 Apr-11 8,820
Jun-11 4.7% Jun-11 1,864,777 Jun-11 716,633 1,014,937 1,171,004 May-11 8,895
Notes:
1. Trading days for the Saudi market are Saturday to Wednesday. Closing prices are as of July-26-2011.
2. Trading days for the GCC markets are Sunday to Thursday. Closing prices are as of July-26-2011.
3. Global markets closing prices are as of July-26-2011
4. Commodities prices, Forex rates (USD) and (SAR) are as of July-27-2011, 9 am.
2. Daily Market Recap
July 27, 2011
Saudi Corporate & Economic News
• Abdullah A. M. Al-Khodari Sons Company announces the signing of a memorandum of understanding on 26-07-2011 with both Balfour
Beatty Group Ltd and Saudi Kier Construction Limited for the prequalification and the submittal jointly for the construction of the railway link
from Ras Az zawr to Jubail and from Jubail to Dmmam, and executing this project jointly if awarded. The company will make an
announcement if awarded the project. This memorandum of understanding has no financial impact till now.
Close Price Market Cap Market Sector EPS
Company Issued Shares (mln) BVPS P/E P/B
(SAR) (mln) Weight (%) Weight (%) (SAR)
Riyad Bank 24.60 1,500 36,900 2.9% 11.4% 1.92 19.24 12.8 1.3
Bank Al-Jazira 17.30 300 5,190 0.4% 1.6% 0.26 15.16 66.7 1.1
Saudi Investment Bank 18.25 550 10,038 0.8% 3.1% 1.12 15.10 16.3 1.2
Saudi Hollandi Bank 28.80 331 9,526 0.7% 2.9% 2.41 19.97 11.9 1.4
Banque Saudi Fransi 43.30 723 31,315 2.4% 9.7% 3.88 24.60 11.2 1.8
SABB 42.60 750 31,950 2.5% 9.9% 2.68 20.30 15.9 2.1
Arab National Bank 29.80 850 25,330 2.0% 7.8% 2.19 17.80 13.6 1.7
SAMBA 48.80 900 43,920 3.4% 13.5% 4.83 28.92 10.1 1.7
Al-Rajhi Bank 73.25 1,500 109,875 8.5% 33.9% 4.53 19.34 16.2 3.8
Bank Al-Bilad 18.15 300 5,445 0.4% 1.7% 0.32 10.49 57.2 1.7
Alinma Bank 9.90 1,500 14,850 1.2% 4.6% 0.11 10.46 92.5 0.9
Banks & Financial Services 324,338 25.1% 100.0% 14.5 1.9
CHEMANOL 12.90 121 1,556 0.1% 0.3% 0.06 11.80 234.7 1.1
Petrochem 21.90 480 10,512 0.8% 2.1% -0.02 9.80 M 2.2
SABIC 105.50 3,000 316,500 24.5% 62.8% 7.95 42.82 13.3 2.5
SAFCO 175.00 250 43,750 3.4% 8.7% 13.48 31.88 13.0 5.5
Industrialization 42.90 557 23,914 1.9% 4.7% 3.07 17.61 14.0 2.4
Alujain 19.15 69 1,325 0.1% 0.3% 0.85 8.29 22.6 2.3
Nama Chemicals 10.65 129 1,369 0.1% 0.3% 0.22 12.60 48.8 0.8
SIIG 22.10 450 9,945 0.8% 2.0% 1.10 13.14 20.0 1.7
Sahara Petrochemical 24.35 293 7,123 0.6% 1.4% 1.07 11.52 22.7 2.1
YANSAB 50.25 563 28,266 2.2% 5.6% 3.79 14.32 13.3 3.5
Sipchem 21.20 367 7,773 0.6% 1.5% 1.14 13.78 18.6 1.5
Advanced 32.70 141 4,623 0.4% 0.9% 2.88 12.71 11.4 2.6
Saudi Kayan 17.30 1,500 25,950 2.0% 5.1% -0.01 10.30 M 1.7
Petro Rabigh 24.85 876 21,769 1.7% 4.3% 0.73 9.92 34.2 2.5
Petrochemical Industries 504,374 39.0% 100.0% 14.0 2.5
Arab Cement 42.60 80 3,408 0.3% 6.6% 3.61 31.98 11.8 1.3
Yamamah Cement 61.50 135 8,303 0.6% 16.2% 4.97 22.67 12.4 2.7
Saudi Cement 61.00 153 9,333 0.7% 18.2% 4.54 23.41 13.5 2.6
Qassim Cement 67.00 90 6,030 0.5% 11.7% 5.59 19.48 12.0 3.4
Southern Cement 71.50 140 10,010 0.8% 19.5% 4.96 16.88 14.4 4.2
Yanbu Cement 59.25 105 6,221 0.5% 12.1% 3.89 23.02 15.2 2.6
Eastern Cement 48.10 86 4,137 0.3% 8.1% 3.88 22.10 12.4 2.2
Tabuk Cement 23.00 90 2,070 0.2% 4.0% 1.45 12.12 15.9 1.9
Jouf Cement 14.40 130 1,872 0.1% 3.6% 0.33 9.95 43.5 1.4
Cement 51,383 4.0% 100.0% 13.6 2.6
Abdullah Al-Othaim Market 92.25 23 2,076 0.2% 11.7% 7.41 18.55 12.5 5.0
Mouwasat 82.00 25 2,050 0.2% 11.5% 5.01 24.44 16.4 3.4
SASCO 13.95 45 628 0.1% 3.5% 0.74 11.57 18.9 1.2
Thim'ar 21.55 10 216 0.0% 1.2% -1.92 3.12 M 6.9
Fitaihi Group 12.05 50 603 0.1% 3.4% 0.45 13.20 26.8 0.9
Jarir 170.00 40 6,800 0.5% 38.3% 10.48 21.35 16.2 8.0
Al-Drees 44.50 25 1,113 0.1% 6.3% 3.53 14.55 12.6 3.1
Al-Hokair 50.75 70 3,553 0.3% 20.0% 4.51 15.64 11.3 3.2
Al-Khaleej Training 37.00 20 740 0.1% 4.2% 2.42 13.93 15.3 2.7
Gas & Industrialization 18.60 75 1,395 0.1% 2.4% 1.29 13.22 14.4 1.4
Saudi Electricity 13.40 4,167 55,832 4.3% 97.6% 0.56 11.87 24.1 1.1
Energy & Utilities 57,227 4.4% 100.0% 23.7 1.1
SAVOLA Group 25.80 500 12,900 1.0% 28.3% 1.32 14.02 19.6 1.8
Food Products 24.00 20 480 0.0% 1.1% 0.95 9.94 25.4 2.4
SADAFCO 40.10 33 1,303 0.1% 2.9% 4.00 22.49 10.0 1.8
Al-Marai 91.50 230 21,045 1.6% 46.2% 5.59 27.80 16.4 3.3
Anaam Holding 44.70 11 487 0.0% 1.1% 1.22 11.47 36.7 3.9
Halwani Bros 35.70 29 1,020 0.1% 2.2% 2.84 16.83 12.6 2.1
Herfy Foods 87.00 27 2,349 0.2% 5.2% 4.77 15.28 18.3 5.7
NADEC 26.60 60 1,596 0.1% 3.5% 0.20 16.53 133.3 1.6
Qassim Agriculture 10.15 50 508 0.0% 1.1% -0.41 7.58 M 1.3
Tabuk Agriculture 27.60 20 552 0.0% 1.2% 1.12 18.07 24.7 1.5
Saudi Fisheries 47.60 20 952 0.1% 2.1% -1.30 5.20 M 9.1
Sharqiya Dev Co 36.30 8 272 0.0% 0.6% -0.09 10.64 M 3.4
Jouff Agriculture 27.90 25 698 0.1% 1.5% 2.61 20.83 10.7 1.3
Bishah Agriculture 69.75 5 349 0.0% 0.8% - 11.29 - 6.2
Jazan Development 20.25 50 1,013 0.1% 2.2% -1.02 11.84 M 1.7
Agriculture & Food Industries 45,523 3.5% 100.0% 17.6 2.5
M=Minus
5. Daily Market Recap
July 27, 2011
Contact Us
India Office
23#24 Sunpoint Complex Ground Floor,
Near Gurukul Temple,
Gurukul Road.
Ahmedabad - 380052.
Gujarat.
Inquire at
info@kizashianalytics.com
Visit us at
www.kizashianalytics.com
Disclaimer
The report is prepared on behalf of Kizashi Analytics. This report is not, or should not be, relied upon in any way as a promise
or representation as to future results, earnings or events. Kizashi reserves the right to modify data without providing any
reason for such modifications. Any information delivered by Kizashi in this report is not intended to provide the basis of any
evaluation of the market trend and share prices and should not be considered as a recommendation that any prospective or
actual investor should underwrite to shares on basis of the prices listed herein in the report. In making any investment
decisions, prospective investors should not rely on this report or on any other information. Kizashi shall not accept any
responsibility for updating this information. No agency, authority or exchange has passed upon the accuracy or adequacy of
this report, or the merits of an investment in any product herein.