SlideShare une entreprise Scribd logo
1  sur  7
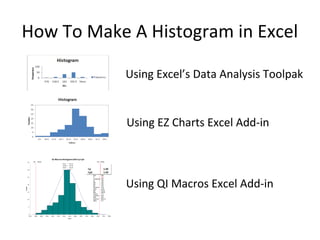
How To Make A Histogram in Excel

            Using Excel’s Data Analysis Toolpak


            Using EZ Charts Excel Add-in


            Using QI Macros Excel Add-in
Histogram Using Excel Data Analysis


                                        +
1. Input Data in Spreadsheet   2. Select Data Analysis + Histogram


   4. Histogram Results             3. Define Data Range, Chart
                                     Output and Other Criteria
Make a Histogram Using Excel


Step 4: Delete Legend


                        Step 5: No Gap
Step 3 Can be Confusing


    Steps 4 and 5 Take Too Much Time
Histograms the Easy Way!
            EZ Chart Plus for Excel


1. Input Data in Spreadsheet


                               2. Select Your Data and Click on
                               Histogram in the EZ Chart Menu


   3. Histogram Results                easy-excel-charts.com
Histograms with Cp & Cpk the Easy Way!
                   QI Macros for Excel


 1. Input Data in Spreadsheet


                                   2. Select Your Data and Click on
                                   Histogram in the QI Macros Menu


3. Histogram with Capability Analysis        www.qimacros.com
Pros and Cons
Excel’s Data Analysis
                        •   Adds chart legend which takes up space and
                            has no value
                        •   Step 3: Definition Window is Confusing
                        •   Have to delete gaps between bars to get a
    EZ Charts               histogram vs a bar chart

                        •   Just select your data with a mouse and click
                            on histogram in the EZ Chart Menu
                        •   Creates histogram on its own page


   QI Macros            •   Same easy to use features as EZ Chart
                        •   Calculates mean, median and mode
                        •   Calculates capability metrics including Cp, Cpk
                        •   Option to add your own spec limits or change
                            spec limits after the chart is run to analyze the
                            impact on Cp, Cpk
                        •   Plots normal curve

Contenu connexe

Tendances

Module for principles and application of precision agriculture
Module for principles and application of precision agricultureModule for principles and application of precision agriculture
Module for principles and application of precision agriculture
JAWI Herbs Centre
 
Witing DE materials
Witing DE materialsWiting DE materials
Witing DE materials
No Limit
 

Tendances (20)

Module for principles and application of precision agriculture
Module for principles and application of precision agricultureModule for principles and application of precision agriculture
Module for principles and application of precision agriculture
 
Excel-bar-graph
Excel-bar-graphExcel-bar-graph
Excel-bar-graph
 
Use of matrix in daily life
Use of matrix in daily lifeUse of matrix in daily life
Use of matrix in daily life
 
Presentation on application of matrix
Presentation on application of matrixPresentation on application of matrix
Presentation on application of matrix
 
Matrix and it's Application
Matrix and it's ApplicationMatrix and it's Application
Matrix and it's Application
 
Applications of Matrices in Engineering
Applications of Matrices in EngineeringApplications of Matrices in Engineering
Applications of Matrices in Engineering
 
Matrix in software engineering
Matrix in software engineeringMatrix in software engineering
Matrix in software engineering
 
Geographical information system
Geographical information systemGeographical information system
Geographical information system
 
Dot Plot Presentation
Dot Plot PresentationDot Plot Presentation
Dot Plot Presentation
 
Geographical information system unit 5
Geographical information  system unit 5Geographical information  system unit 5
Geographical information system unit 5
 
Lect 7 & 8 types of vector data model-gis
Lect 7 & 8 types of vector data model-gisLect 7 & 8 types of vector data model-gis
Lect 7 & 8 types of vector data model-gis
 
Uses Of Calculus is Computer Science
Uses Of Calculus is Computer ScienceUses Of Calculus is Computer Science
Uses Of Calculus is Computer Science
 
Editing and topology
Editing and topologyEditing and topology
Editing and topology
 
Lect 5 data models-gis
Lect 5 data models-gisLect 5 data models-gis
Lect 5 data models-gis
 
Application of calculus in cse
Application of calculus in cseApplication of calculus in cse
Application of calculus in cse
 
GIS & Raster
GIS & RasterGIS & Raster
GIS & Raster
 
Masters Projects in CAD/CAM
Masters Projects in CAD/CAMMasters Projects in CAD/CAM
Masters Projects in CAD/CAM
 
Witing DE materials
Witing DE materialsWiting DE materials
Witing DE materials
 
Raster data ppt
Raster data pptRaster data ppt
Raster data ppt
 
3D Analyst
3D Analyst3D Analyst
3D Analyst
 

Similaire à Histograms the Easy Way in Excel

MS_Excel_Module4.1 ffor beginners yo .pptx
MS_Excel_Module4.1 ffor beginners yo .pptxMS_Excel_Module4.1 ffor beginners yo .pptx
MS_Excel_Module4.1 ffor beginners yo .pptx
shagunjain2k22phdcs0
 
Project Planning | Project Plan In Excel With Gantt Chart | Project Managemen...
Project Planning | Project Plan In Excel With Gantt Chart | Project Managemen...Project Planning | Project Plan In Excel With Gantt Chart | Project Managemen...
Project Planning | Project Plan In Excel With Gantt Chart | Project Managemen...
Simplilearn
 
Basic Computer skill-P4 Excel.pptx
Basic Computer skill-P4 Excel.pptxBasic Computer skill-P4 Excel.pptx
Basic Computer skill-P4 Excel.pptx
Mastewal5
 

Similaire à Histograms the Easy Way in Excel (20)

06 Excel.pdf
06 Excel.pdf06 Excel.pdf
06 Excel.pdf
 
Advance excel training in pune ppt.
Advance excel training in pune ppt.Advance excel training in pune ppt.
Advance excel training in pune ppt.
 
Advance Microsoft Office Excel Course.pptx
Advance Microsoft Office Excel Course.pptxAdvance Microsoft Office Excel Course.pptx
Advance Microsoft Office Excel Course.pptx
 
Microsoft Excel Dashboards and Their Features.pdf
Microsoft Excel Dashboards and Their Features.pdfMicrosoft Excel Dashboards and Their Features.pdf
Microsoft Excel Dashboards and Their Features.pdf
 
Data Visualization in Excel
Data Visualization in ExcelData Visualization in Excel
Data Visualization in Excel
 
Lab 2
Lab 2Lab 2
Lab 2
 
Excel2002
Excel2002Excel2002
Excel2002
 
Excel2002
Excel2002Excel2002
Excel2002
 
presentation_excel_ppt_1568277302_374766.ppt
presentation_excel_ppt_1568277302_374766.pptpresentation_excel_ppt_1568277302_374766.ppt
presentation_excel_ppt_1568277302_374766.ppt
 
Statistics
StatisticsStatistics
Statistics
 
Excel.t04
Excel.t04Excel.t04
Excel.t04
 
introduction to Statistical Theory.pptx
 introduction to Statistical Theory.pptx introduction to Statistical Theory.pptx
introduction to Statistical Theory.pptx
 
MODULE 1 continuation .pptx
MODULE 1 continuation .pptxMODULE 1 continuation .pptx
MODULE 1 continuation .pptx
 
MS_Excel_Module4.1 ffor beginners yo .pptx
MS_Excel_Module4.1 ffor beginners yo .pptxMS_Excel_Module4.1 ffor beginners yo .pptx
MS_Excel_Module4.1 ffor beginners yo .pptx
 
Spreadsheets 1.pptx
Spreadsheets 1.pptxSpreadsheets 1.pptx
Spreadsheets 1.pptx
 
Excel tips and tricks
Excel tips and tricksExcel tips and tricks
Excel tips and tricks
 
QBIC
QBICQBIC
QBIC
 
Project Planning | Project Plan In Excel With Gantt Chart | Project Managemen...
Project Planning | Project Plan In Excel With Gantt Chart | Project Managemen...Project Planning | Project Plan In Excel With Gantt Chart | Project Managemen...
Project Planning | Project Plan In Excel With Gantt Chart | Project Managemen...
 
Advanced excel topics
Advanced excel topicsAdvanced excel topics
Advanced excel topics
 
Basic Computer skill-P4 Excel.pptx
Basic Computer skill-P4 Excel.pptxBasic Computer skill-P4 Excel.pptx
Basic Computer skill-P4 Excel.pptx
 

Plus de Jay Arthur

Create an xm r chart in excel
Create an xm r chart in excelCreate an xm r chart in excel
Create an xm r chart in excel
Jay Arthur
 

Plus de Jay Arthur (12)

What is Kaizen?
What is Kaizen?What is Kaizen?
What is Kaizen?
 
Statistical Process Control (SPC) Quick Reference Card
Statistical Process Control (SPC) Quick Reference CardStatistical Process Control (SPC) Quick Reference Card
Statistical Process Control (SPC) Quick Reference Card
 
Statistical Process Control (SPC) in a Nutshell
Statistical Process Control (SPC) in a NutshellStatistical Process Control (SPC) in a Nutshell
Statistical Process Control (SPC) in a Nutshell
 
Using Charts to Present Statistical Data to Non-Statisticians
Using Charts to Present Statistical Data to Non-StatisticiansUsing Charts to Present Statistical Data to Non-Statisticians
Using Charts to Present Statistical Data to Non-Statisticians
 
What is Capability Analysis?
What is Capability Analysis?What is Capability Analysis?
What is Capability Analysis?
 
Focus for Lean Six Sigma
Focus for Lean Six SigmaFocus for Lean Six Sigma
Focus for Lean Six Sigma
 
Create an xm r chart in excel
Create an xm r chart in excelCreate an xm r chart in excel
Create an xm r chart in excel
 
A Cheaper Hospital In Five Days
A Cheaper Hospital In Five DaysA Cheaper Hospital In Five Days
A Cheaper Hospital In Five Days
 
C & u charts
C & u chartsC & u charts
C & u charts
 
A better-hospital-in-five-days
A better-hospital-in-five-daysA better-hospital-in-five-days
A better-hospital-in-five-days
 
A Better Hospital in Five Days
A Better Hospital in Five DaysA Better Hospital in Five Days
A Better Hospital in Five Days
 
A Faster Hospital in Five Days
A Faster Hospital in Five DaysA Faster Hospital in Five Days
A Faster Hospital in Five Days
 

Dernier

Why Teams call analytics are critical to your entire business
Why Teams call analytics are critical to your entire businessWhy Teams call analytics are critical to your entire business
Why Teams call analytics are critical to your entire business
panagenda
 

Dernier (20)

Powerful Google developer tools for immediate impact! (2023-24 C)
Powerful Google developer tools for immediate impact! (2023-24 C)Powerful Google developer tools for immediate impact! (2023-24 C)
Powerful Google developer tools for immediate impact! (2023-24 C)
 
Apidays New York 2024 - Accelerating FinTech Innovation by Vasa Krishnan, Fin...
Apidays New York 2024 - Accelerating FinTech Innovation by Vasa Krishnan, Fin...Apidays New York 2024 - Accelerating FinTech Innovation by Vasa Krishnan, Fin...
Apidays New York 2024 - Accelerating FinTech Innovation by Vasa Krishnan, Fin...
 
FWD Group - Insurer Innovation Award 2024
FWD Group - Insurer Innovation Award 2024FWD Group - Insurer Innovation Award 2024
FWD Group - Insurer Innovation Award 2024
 
Strategize a Smooth Tenant-to-tenant Migration and Copilot Takeoff
Strategize a Smooth Tenant-to-tenant Migration and Copilot TakeoffStrategize a Smooth Tenant-to-tenant Migration and Copilot Takeoff
Strategize a Smooth Tenant-to-tenant Migration and Copilot Takeoff
 
A Year of the Servo Reboot: Where Are We Now?
A Year of the Servo Reboot: Where Are We Now?A Year of the Servo Reboot: Where Are We Now?
A Year of the Servo Reboot: Where Are We Now?
 
EMPOWERMENT TECHNOLOGY GRADE 11 QUARTER 2 REVIEWER
EMPOWERMENT TECHNOLOGY GRADE 11 QUARTER 2 REVIEWEREMPOWERMENT TECHNOLOGY GRADE 11 QUARTER 2 REVIEWER
EMPOWERMENT TECHNOLOGY GRADE 11 QUARTER 2 REVIEWER
 
Axa Assurance Maroc - Insurer Innovation Award 2024
Axa Assurance Maroc - Insurer Innovation Award 2024Axa Assurance Maroc - Insurer Innovation Award 2024
Axa Assurance Maroc - Insurer Innovation Award 2024
 
Boost Fertility New Invention Ups Success Rates.pdf
Boost Fertility New Invention Ups Success Rates.pdfBoost Fertility New Invention Ups Success Rates.pdf
Boost Fertility New Invention Ups Success Rates.pdf
 
Why Teams call analytics are critical to your entire business
Why Teams call analytics are critical to your entire businessWhy Teams call analytics are critical to your entire business
Why Teams call analytics are critical to your entire business
 
Apidays New York 2024 - Scaling API-first by Ian Reasor and Radu Cotescu, Adobe
Apidays New York 2024 - Scaling API-first by Ian Reasor and Radu Cotescu, AdobeApidays New York 2024 - Scaling API-first by Ian Reasor and Radu Cotescu, Adobe
Apidays New York 2024 - Scaling API-first by Ian Reasor and Radu Cotescu, Adobe
 
Data Cloud, More than a CDP by Matt Robison
Data Cloud, More than a CDP by Matt RobisonData Cloud, More than a CDP by Matt Robison
Data Cloud, More than a CDP by Matt Robison
 
Artificial Intelligence Chap.5 : Uncertainty
Artificial Intelligence Chap.5 : UncertaintyArtificial Intelligence Chap.5 : Uncertainty
Artificial Intelligence Chap.5 : Uncertainty
 
Web Form Automation for Bonterra Impact Management (fka Social Solutions Apri...
Web Form Automation for Bonterra Impact Management (fka Social Solutions Apri...Web Form Automation for Bonterra Impact Management (fka Social Solutions Apri...
Web Form Automation for Bonterra Impact Management (fka Social Solutions Apri...
 
Apidays Singapore 2024 - Building Digital Trust in a Digital Economy by Veron...
Apidays Singapore 2024 - Building Digital Trust in a Digital Economy by Veron...Apidays Singapore 2024 - Building Digital Trust in a Digital Economy by Veron...
Apidays Singapore 2024 - Building Digital Trust in a Digital Economy by Veron...
 
Polkadot JAM Slides - Token2049 - By Dr. Gavin Wood
Polkadot JAM Slides - Token2049 - By Dr. Gavin WoodPolkadot JAM Slides - Token2049 - By Dr. Gavin Wood
Polkadot JAM Slides - Token2049 - By Dr. Gavin Wood
 
Emergent Methods: Multi-lingual narrative tracking in the news - real-time ex...
Emergent Methods: Multi-lingual narrative tracking in the news - real-time ex...Emergent Methods: Multi-lingual narrative tracking in the news - real-time ex...
Emergent Methods: Multi-lingual narrative tracking in the news - real-time ex...
 
How to Troubleshoot Apps for the Modern Connected Worker
How to Troubleshoot Apps for the Modern Connected WorkerHow to Troubleshoot Apps for the Modern Connected Worker
How to Troubleshoot Apps for the Modern Connected Worker
 
Apidays Singapore 2024 - Modernizing Securities Finance by Madhu Subbu
Apidays Singapore 2024 - Modernizing Securities Finance by Madhu SubbuApidays Singapore 2024 - Modernizing Securities Finance by Madhu Subbu
Apidays Singapore 2024 - Modernizing Securities Finance by Madhu Subbu
 
TrustArc Webinar - Stay Ahead of US State Data Privacy Law Developments
TrustArc Webinar - Stay Ahead of US State Data Privacy Law DevelopmentsTrustArc Webinar - Stay Ahead of US State Data Privacy Law Developments
TrustArc Webinar - Stay Ahead of US State Data Privacy Law Developments
 
MS Copilot expands with MS Graph connectors
MS Copilot expands with MS Graph connectorsMS Copilot expands with MS Graph connectors
MS Copilot expands with MS Graph connectors
 

Histograms the Easy Way in Excel

  • 1. How To Make A Histogram in Excel Using Excel’s Data Analysis Toolpak Using EZ Charts Excel Add-in Using QI Macros Excel Add-in
  • 2. Histogram Using Excel Data Analysis + 1. Input Data in Spreadsheet 2. Select Data Analysis + Histogram 4. Histogram Results 3. Define Data Range, Chart Output and Other Criteria
  • 3. Make a Histogram Using Excel Step 4: Delete Legend Step 5: No Gap
  • 4. Step 3 Can be Confusing Steps 4 and 5 Take Too Much Time
  • 5. Histograms the Easy Way! EZ Chart Plus for Excel 1. Input Data in Spreadsheet 2. Select Your Data and Click on Histogram in the EZ Chart Menu 3. Histogram Results easy-excel-charts.com
  • 6. Histograms with Cp & Cpk the Easy Way! QI Macros for Excel 1. Input Data in Spreadsheet 2. Select Your Data and Click on Histogram in the QI Macros Menu 3. Histogram with Capability Analysis www.qimacros.com
  • 7. Pros and Cons Excel’s Data Analysis • Adds chart legend which takes up space and has no value • Step 3: Definition Window is Confusing • Have to delete gaps between bars to get a EZ Charts histogram vs a bar chart • Just select your data with a mouse and click on histogram in the EZ Chart Menu • Creates histogram on its own page QI Macros • Same easy to use features as EZ Chart • Calculates mean, median and mode • Calculates capability metrics including Cp, Cpk • Option to add your own spec limits or change spec limits after the chart is run to analyze the impact on Cp, Cpk • Plots normal curve